MK350 Series
Survival Handbook

Table of Contents
Introducon . . . . . . . . . . . . . . . . . . .1
Common Types of Arcial Lighng . . . . . . 2
Incandescent Lighng . . . . . . . . . . . . . . . . . . . . . . . 4
Fluorescent Lighng . . . . . . . . . . . . . . . . . . . . . . . . 6
LED Lighng . . . . . . . . . . . . . . . . . . . . . . . . . . . . . 8
Advantages & Disadvantages . . . . . . . . . . . . . . . . . . .12
The Market . . . . . . . . . . . . . . . . . . . . . . . . . . . . .16
Where does light come from? . . . . . . . . 18
Atoms Make Light . . . . . . . . . . . . . . . . . . . . . . . . . .20
How does an Incandescent Bulb make light? . . . . . . . . . . .24
How does a Fluorescent Light makes light? . . . . . . . . . . .26
How does an LED make light? . . . . . . . . . . . . . . . . . . .28
Fluorescent Yellow . . . . . . . . . . . . . . . . . . . . . . . . .30
Why LEDs use Semiconductors? . . . . . . . . . . . . . . . . . .32
How does light work? . . . . . . . . . . . . . 34
Famous Experiment 1 . . . . . . . . . . . . . . . . . . . . . . .34
Famous Experiment 2 . . . . . . . . . . . . . . . . . . . . . . .36
Wave Behavior . . . . . . . . . . . . . . . . . . . . . . . . . . .40
See Light or Sense Light? . . . . . . . . . . . . . . . . . . . . .44
So what is color? . . . . . . . . . . . . . . . 46
Reecon, Absorpon, Transmission . . . . . . . . . . . . . . .48
Color Wheel - Mixing colors . . . . . . . . . . . . . . . . . . . .50
Rods & Cones . . . . . . . . . . . . . . . . . . . . . . . . . . . .52
Measuring Light . . . . . . . . . . . . . . . . 54
Using Temperature to measure light color? . . . . . . . . . . .56
How does a device measure light? . . . . . . . . . . . . . . . .58
Matching Wavelengths to Colors . . . . . . . . . . . . . . . . .60
The Chromacity Diagram - CIE 1931 . . . . . . . . . . . . . . .62
How the Chromacity Diagram Came About . . . . . . . . . . .64
Wavelength Intensity . . . . . . . . . . . . . . . . . . . . . . . .69
How does a light meter determine x,y? . . . . . . . . . . . . . .70
The Color wheel and the Chromacity Diagram . . . . . . . . .72
CIE 1931 to CIE 1976 . . . . . . . . . . . . . . . . . . . . . . . .76
MK350 Series - Things you should know . . . 78
Diracon Grang . . . . . . . . . . . . . . . . . . . . . . . . .81
Cosine Correcon . . . . . . . . . . . . . . . . . . . . . . . . . .82
Dark Calibraon . . . . . . . . . . . . . . . . . . . . . . . . . . .84
Measuring Fluorescent Light with MK350 . . . . . . . . . . . .86
Half Bandwidth . . . . . . . . . . . . . . . . . . . . . . . . . . .87
Planckian Locus . . . . . . . . . . . . . . . . . . . . . . . . . . .88
Rundown of Unit Measurements . . . . . . . . . . . . . . . . .90
Recognizing Dierent Wavelength Spectra . . . . . . . . . . . .92
Applicaons . . . . . . . . . . . . . . . . . . 94
Light and Agriculture . . . . . . . . . . . . . . . . . . . . . . . .96
Measuring PAR . . . . . . . . . . . . . . . . . . . . . . . . . . . . . . . . . . . .98
PPF Values . . . . . . . . . . . . . . . . . . . . . . . . . . . . . . . . . . . . . . .99
Lighng Designers . . . . . . . . . . . . . . . . . . . . . . . .100
Dialux . . . . . . . . . . . . . . . . . . . . . . . . . . . . . . . . . . . . . . . . . 101
Measuring LUX . . . . . . . . . . . . . . . . . . . . . . . . . . . . . . . . . . . 104
Cool vs Warm - Color Temperature . . . . . . . . . . . . . . . . . . . . . .106
Correlated Color Temperature . . . . . . . . . . . . . . . . . . . . . . . . . . 107
Duv ∆u ∆v ∆y ∆x . . . . . . . . . . . . . . . . . . . . . . . . . . . . . . . . . . 108
Light Health and Safety . . . . . . . . . . . . . . . . . . . . . . 112
Measuring UV Light . . . . . . . . . . . . . . . . . . . . . . . . . . . . . . . . 112
Measuring Harmful Blue Light . . . . . . . . . . . . . . . . . . . . . . . . .114
Measuring Flicker . . . . . . . . . . . . . . . . . . . . . . . . . . . . . . . . .116
Lighng Road & Trac . . . . . . . . . . . . . . . . . . . . . . 120
Measuring LED Degradation . . . . . . . . . . . . . . . . . . . . . . . . . .120
Measuring Trac Lights . . . . . . . . . . . . . . . . . . . . . . . . . . . . . 122
Measuring Light in Hospitals . . . . . . . . . . . . . . . . . . 123
Surgical Lights . . . . . . . . . . . . . . . . . . . . . . . . . . . 123
Replacing LEDs in Jumbo Screens . . . . . . . . . . . . . . . . 125
Tesng and Calibrang LED Based screens and Monitors. . .126
sRGB, AdobeRGB . . . . . . . . . . . . . . . . . . . . . . . . . . . . . . . . . . 129
Lighng Store Display . . . . . . . . . . . . . . . . . . . . . . . 130
Lighng Academics & Research . . . . . . . . . . . . . . . . . 132
Research - Measuring Surface Colors . . . . . . . . . . . . . . . . . . . . .134
LED Heat Sink Research . . . . . . . . . . . . . . . . . . . . . . . . . . . . . . 137
Research Publishing . . . . . . . . . . . . . . . . . . . . . . . . . . . . . . . . 137
LED Professionals . . . . . . . . . . . . . . . . . . . . . . . . . 138
Research and Development . . . . . . . . . . . . . . . . . . . . . . . . . . . 140
Light Exhibitions . . . . . . . . . . . . . . . . . . . . . . . . . . . . . . . . . . 141
Quality Control . . . . . . . . . . . . . . . . . . . . . . . . . . . . . . . . . . . 141
Appendix 1 - CIE 1931 in-depth . . . . . . . 144
Bibliography . . . . . . . . . . . . . . . . . 148
Versio 20140410b - Not for distribution - © Copyright 2014 UPRtek All rights reserved
The overwhelming ood of LED lighting in the market is undeniable – LEDs are energy efcient,
longer lasting, cooler, shockproof and non-toxic and this is why this guide will focus on LEDs.
However, there are challenges to LED lighting - namely, that LED light quality and color can be quite
inconveniently unpredictable.
Therefore, you need measuring equipment to gauge LED light quality. However, light is about
physics and precision equipment and is highly specialized, bulky, expensive and for the most part
impractical. This is where the MK350 Spectroradiometer makes its timely entry into the market, a
hand-carry, cost-effective light meter that provides precision light measurement outside the connes
of laboratory space and into our everyday working and living environments.
It’s the Question that drives us ...
Why the MK350 Survival Handbook?
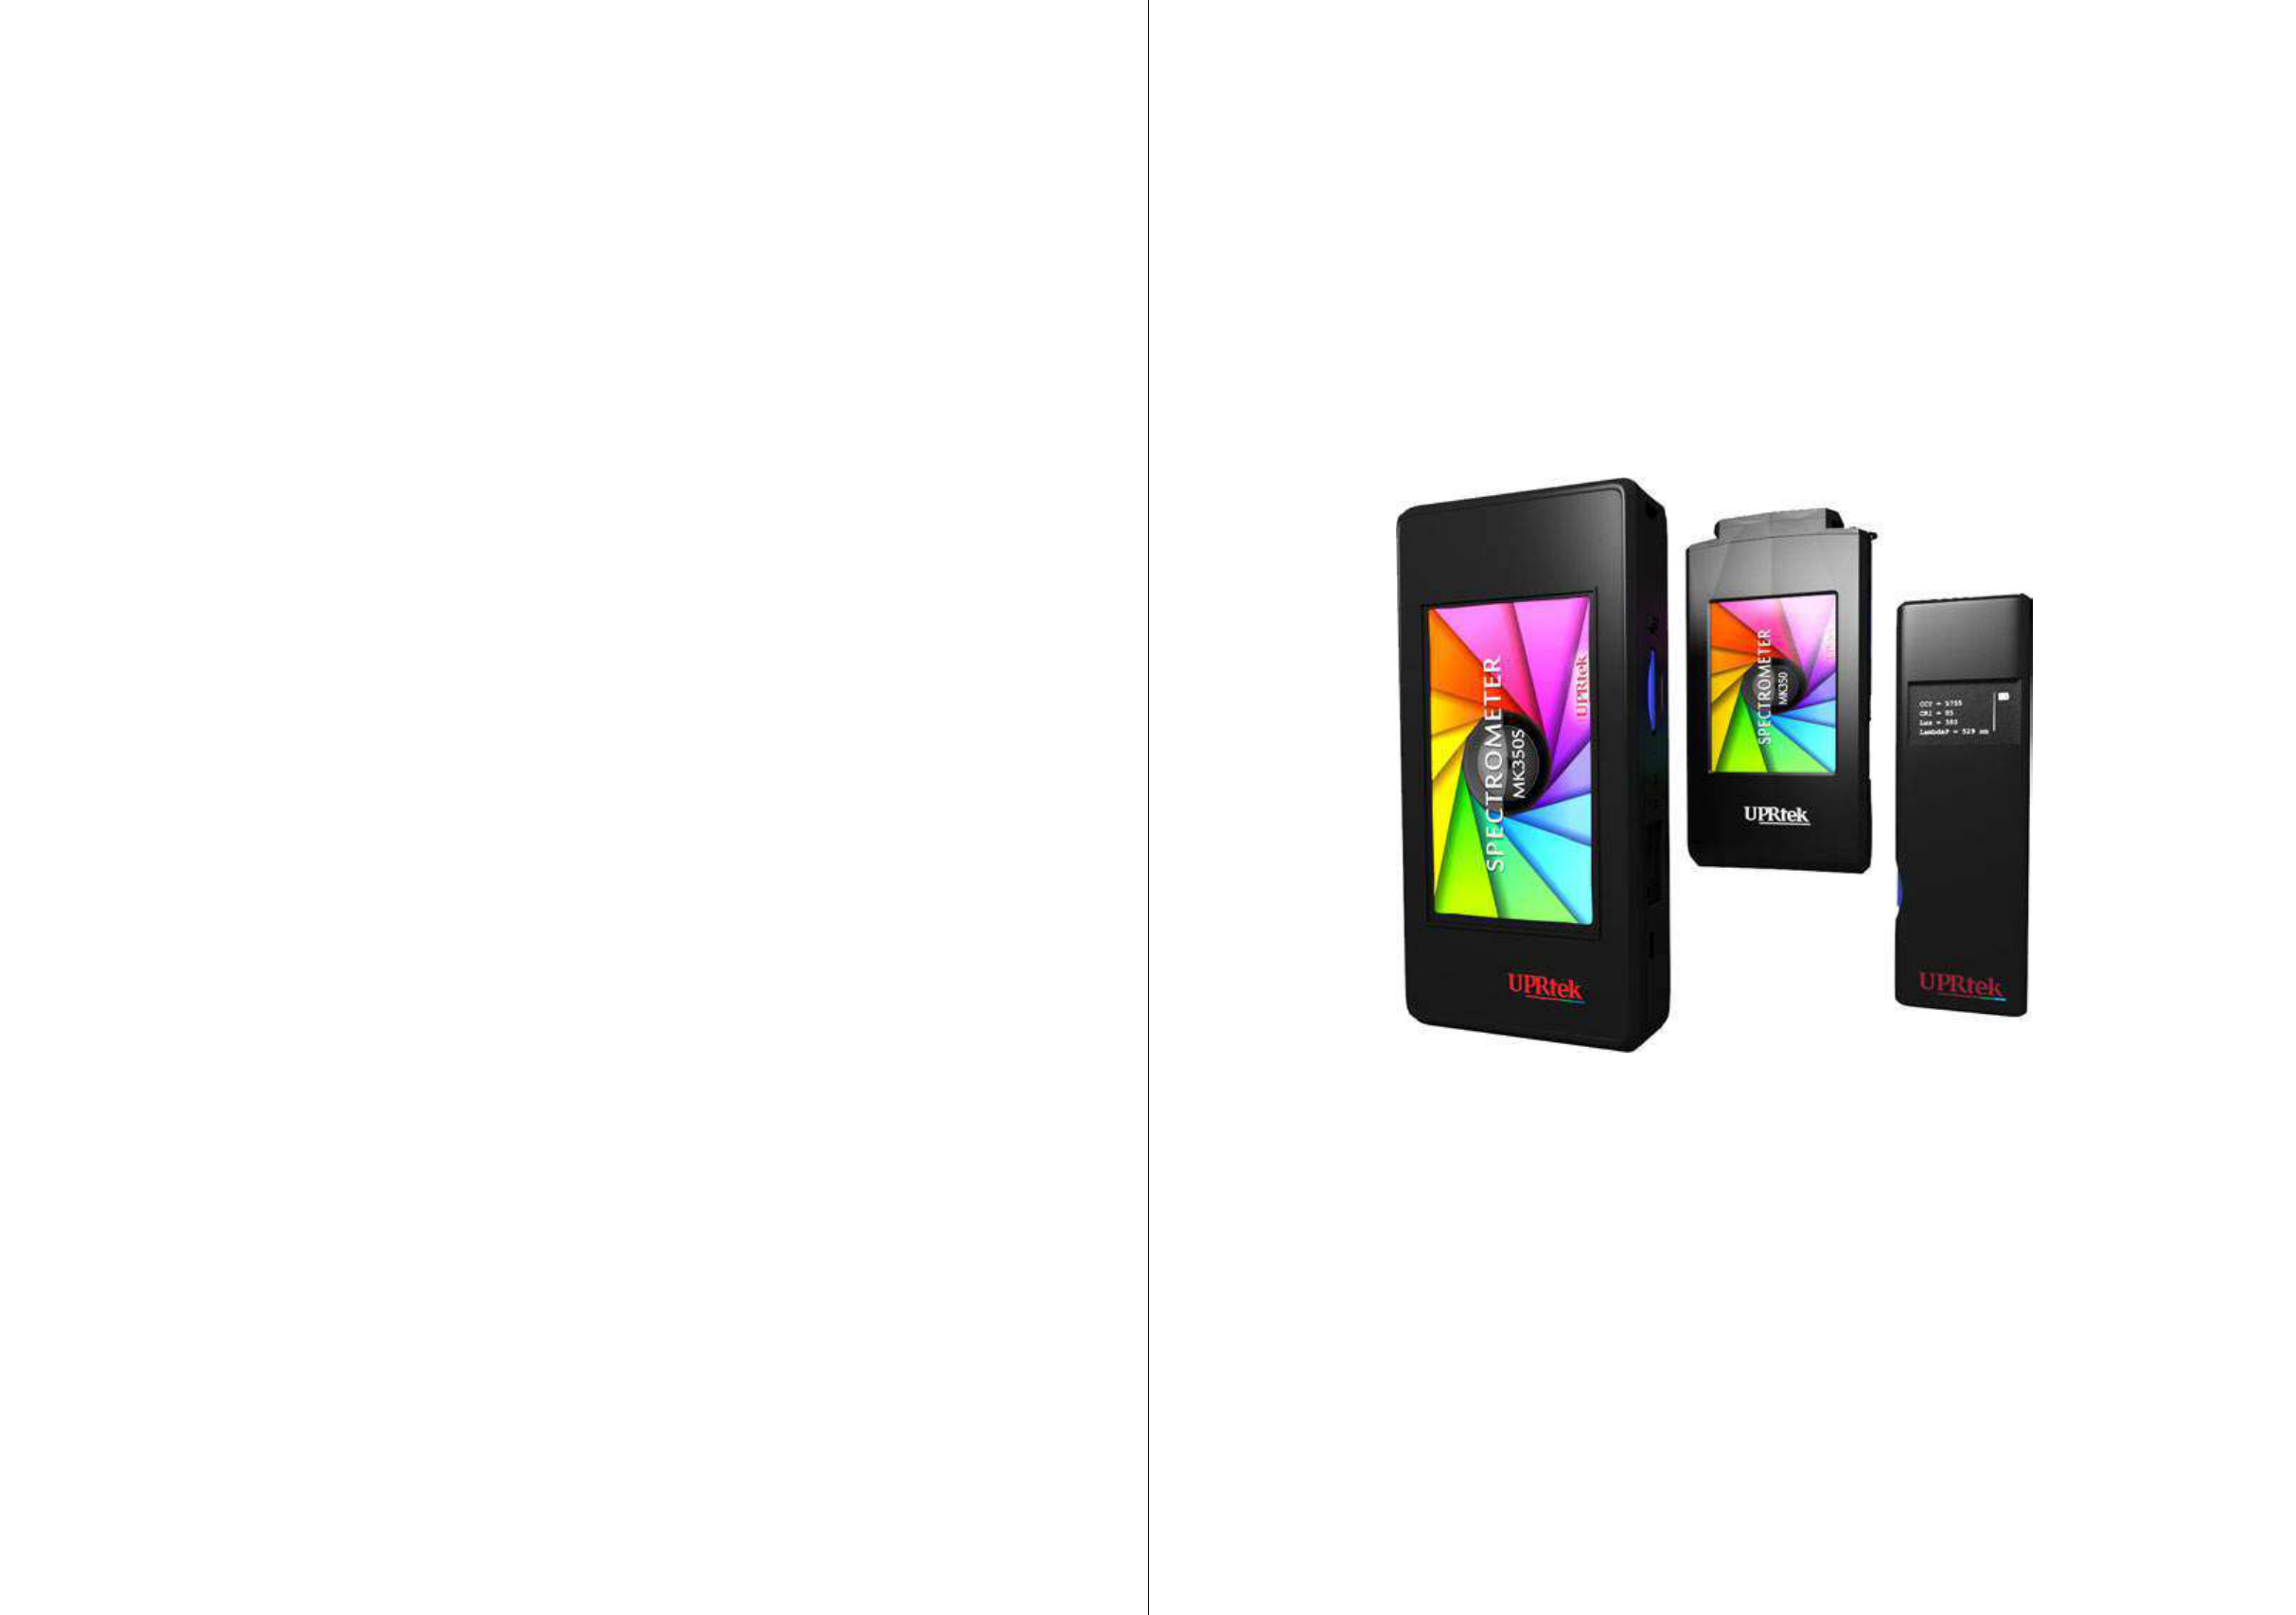
The MK350S series devices are designed to measure the quality of light. As simple as that may
sound, understanding the importance of good lighting and how the MK350 devices work can be quite
challenging. This handbook is a survival guide to help you through the complexities of light science
and to teach you the great advantages of MK350 technology.
This handbook …
■ is customized for learning the MK350 devices, light and lighting
■ is easy to follow (like a “Dummies” Book)
■ theoretically requires no prior knowledge
Our Goals
■ Goal 1 - Fast Track to MK350 knowledge
■ Goal 2 – Become a Lighting Expert
■ Goal 3 – #1 Customer Service/Sales Force
Introduction
- The Matrix -
1
Version 20140410b - Not for distribution - © Copyright 2014 UPRtek All rights reserved
Versio 20140410b - Not for distribution - © Copyright 2014 UPRtek All rights reserved
Incandescent
■ Commercial use - mid 1900s
■ Uses lots of energy
■ Generates heat - hot to the touch
■ Needs to be replaced often
■ Shatters easily
■ Light quality is very consistent
and close to the quality of Sun
light.
KMJ, alpha masking by Edokter - GFDL - CC-SA-3.0 Wikimedia Commons
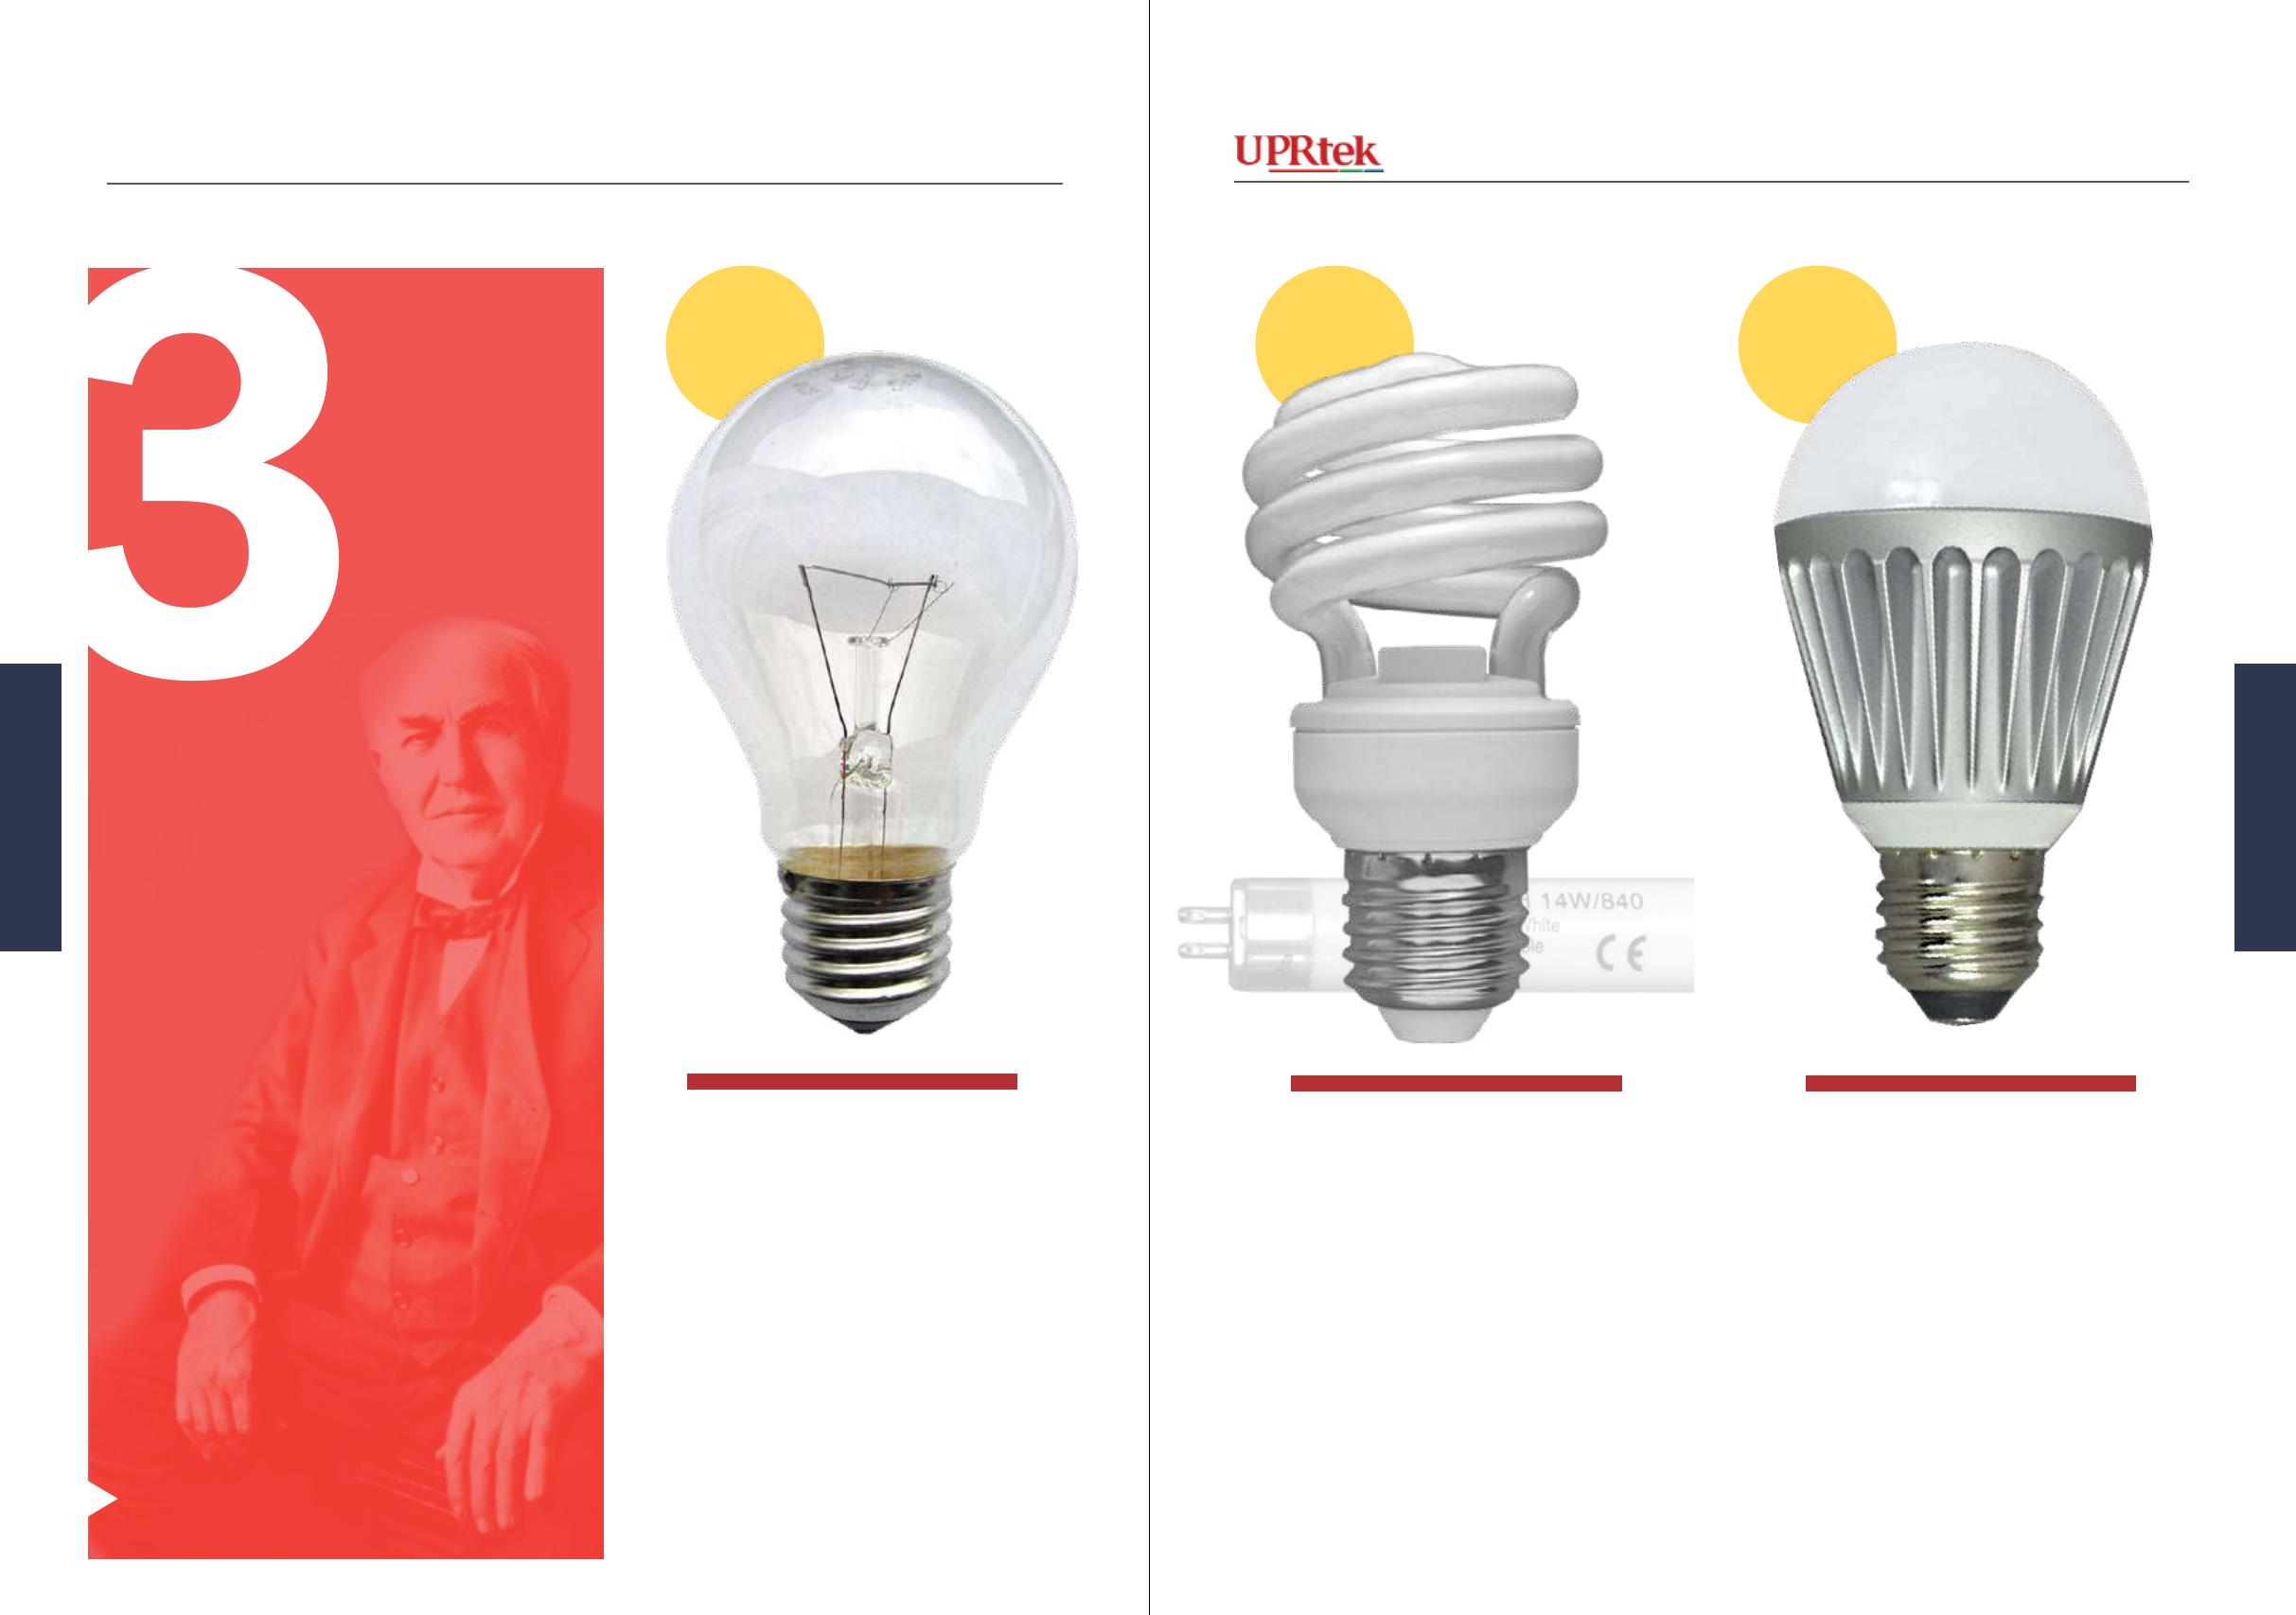
Common
Types of
Articial
Lighting
Let’s rst discuss the 3 common
types of Lights:
Incandescent Lighting
Fluorescent Lighting
LED Lighting
The traditional Incandescent bulbs
were rst on the scene . Next,
came the Fluorescent Lights and
then LED Lights, both bringing
advantages in bulb lifespan and
energy savings. However, they are
all three, still in use with their own
distinct advantages and disadvan-
tages.
ONE
Thomas Edison did NOT invent the Incandescent Bulb ...
but he did make it commercially viable!
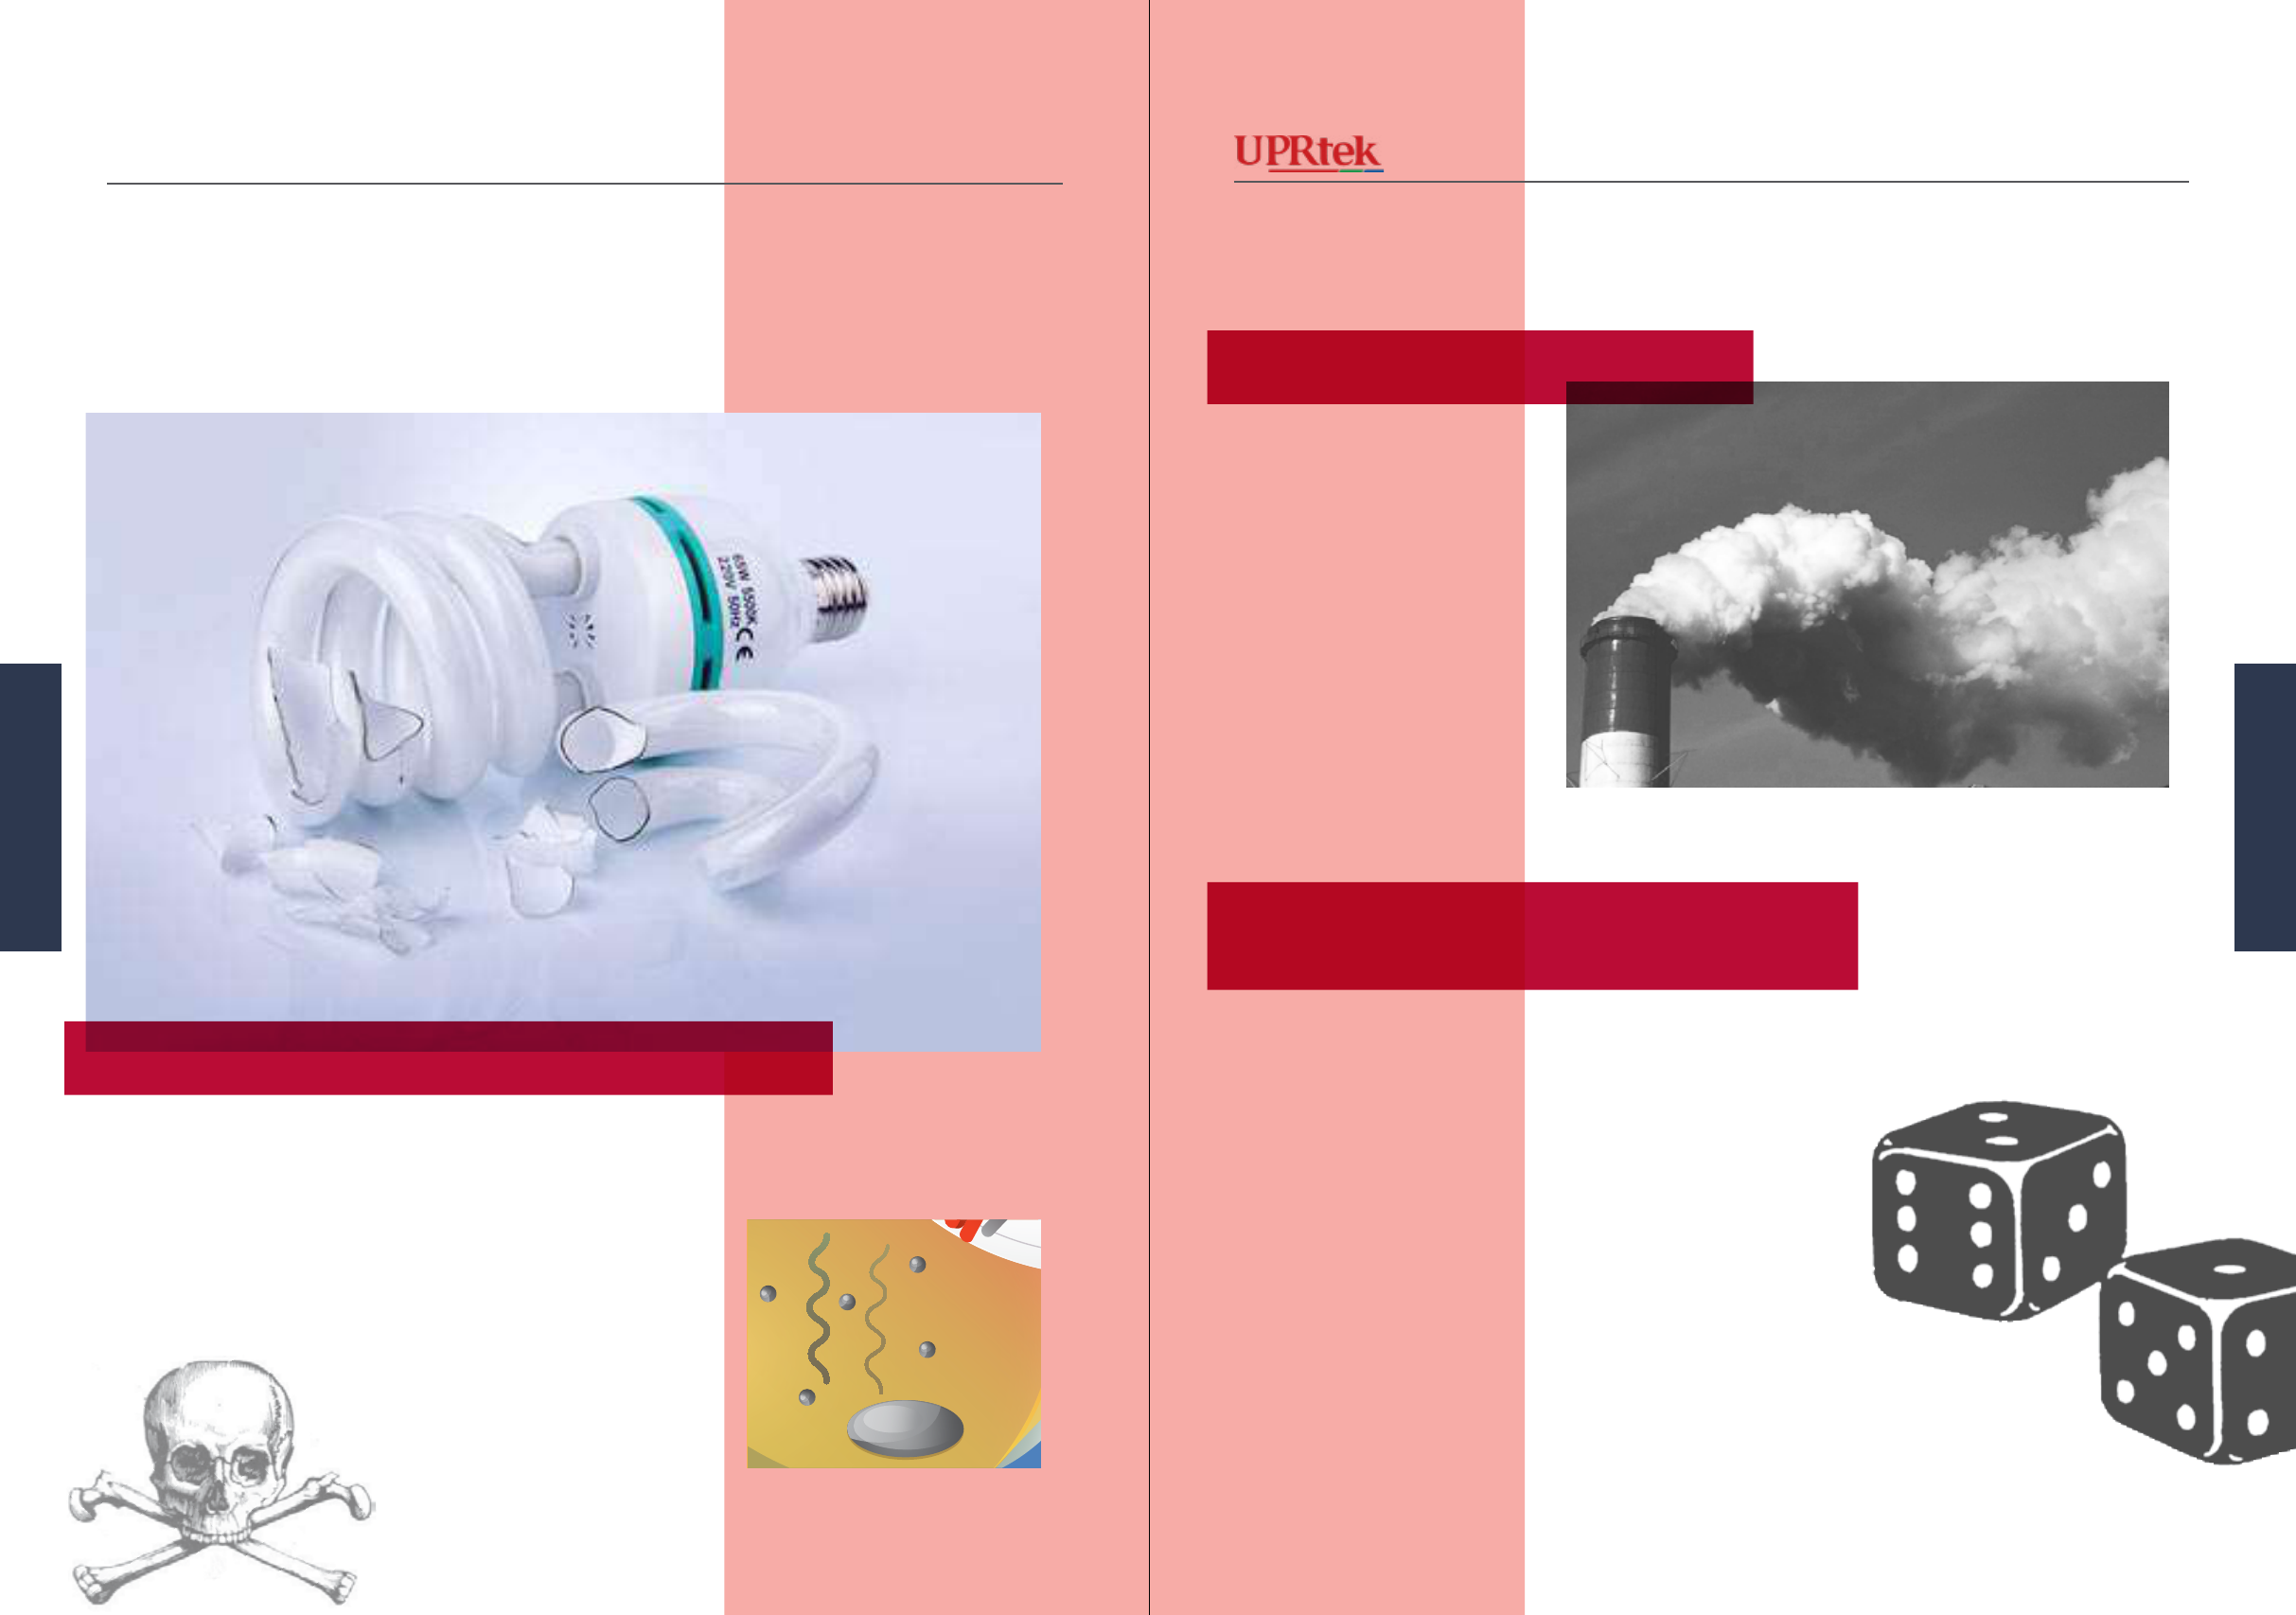
Fluorescent
■ Commercial use - 1930s
■ Cool to the touch
■ Lasts longer than Incandescent
■ Uses less energy than Incandes-
cent
■ Still shatters easily
■ Contains dangerous mercury -
poses a hazard when broken or
during normal disposal.
LED
■ Commercial use - Early 2000s
■ Cool to the touch
■ Lasts longer than Fluorescents
■ Uses less energy than Fluorescents
■ Does NOT shatter
■ LED quality is not consistent
during production and needs to be
classied and sorted at different
quality levels after production.
Sun Ladder - Creative Commons Attribution-Share Alike 3.0 Unported Wikimedia Commons
TWO
THREE
Common Types of Articial Lighting
Arcial Lighng
32
Arcial Lighng
MK350 Series Survival Handbook
Version 20140410b - Not for distribution - © Copyright 2014 UPRtek All rights reserved
Versio 20140410b - Not for distribution - © Copyright 2014 UPRtek All rights reserved
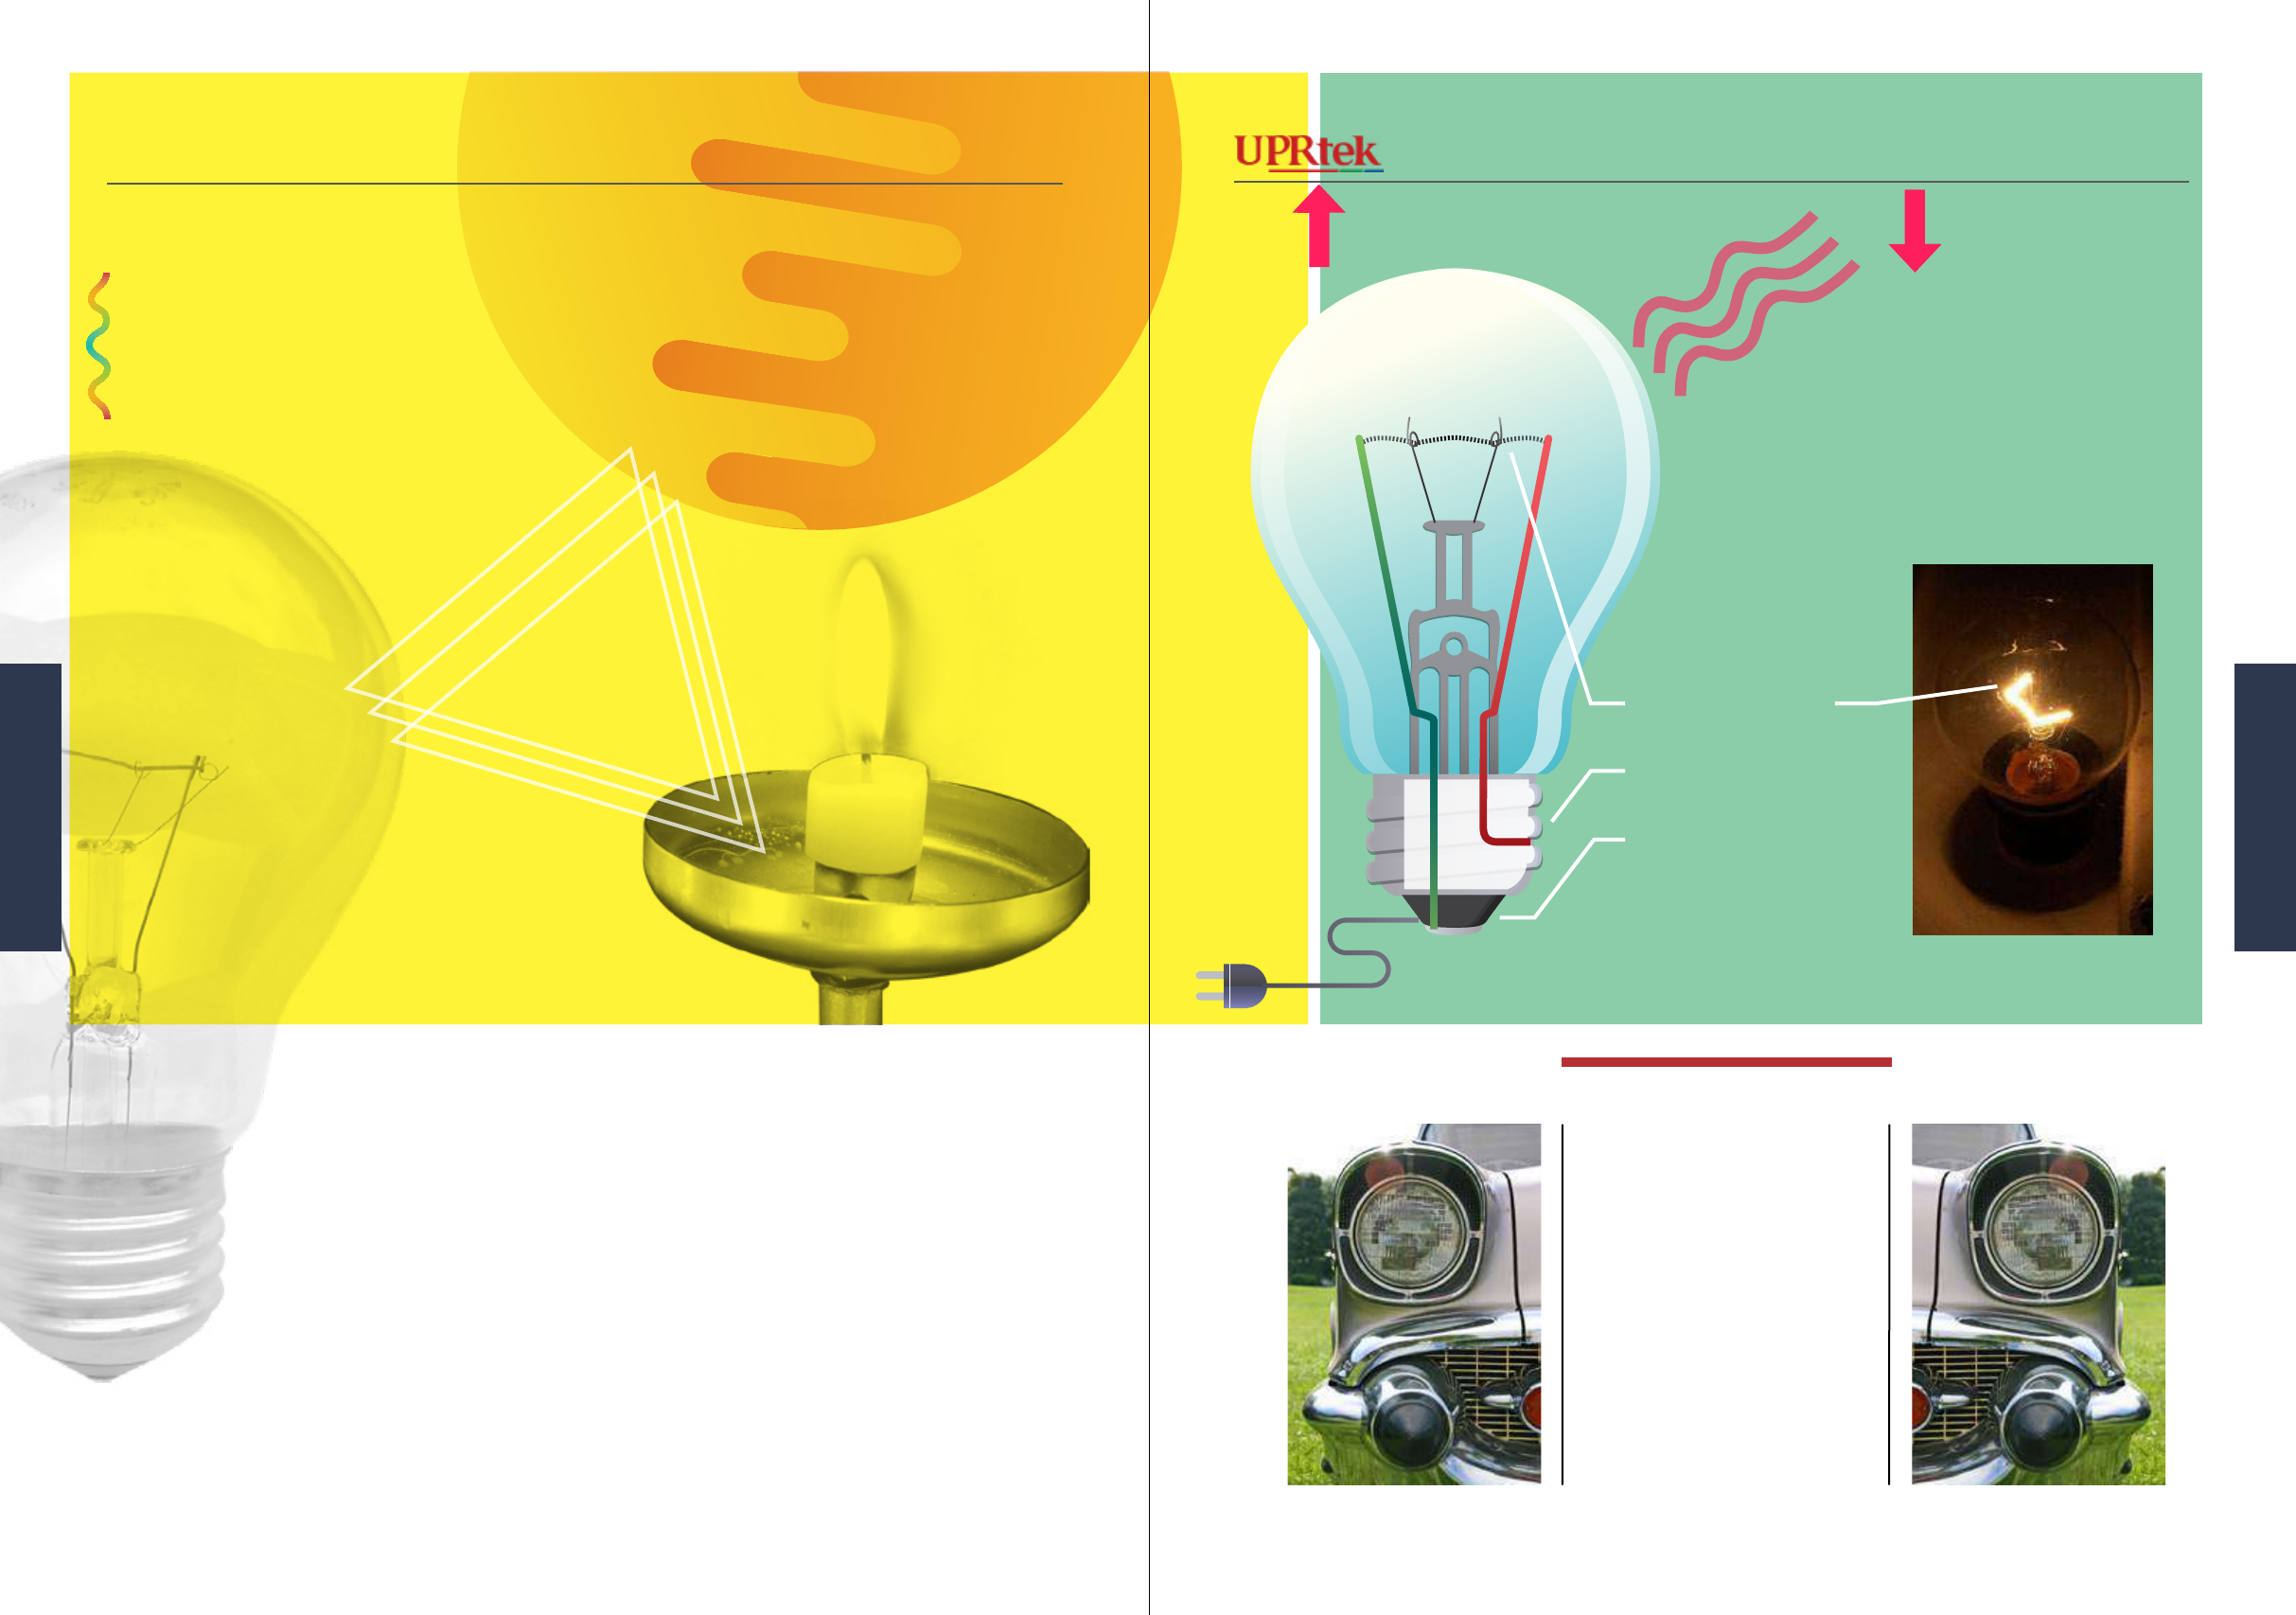
Incandescent Lighting
Incandescence
uses heat (thermal radiation) to
produce light. Sunlight and
Candle-light are generated in
this way. Incandescent Light
Bulbs also generate heat (ther-
mal radiation) through a “la-
ment” - the lament heats up to
produce light like a candle.
uses heat to make light ...
The great advantage is that
this type of light quality and
color is generally very consis-
tent between most brands. Its
color qualities are also very
close what the Sun produces.
The great disadvantage is that
this type of bulb requires lots of
energy which is wasted as dis-
sipated heat (90%). Also, the
intense heat causes faster degra-
dation of the lament leading to
a shorter lifespan of the bulb.
Tungsten Filament
Electrical Foot Contact
Foot Base Contact
Tungsten is a hard metal that
doesn’t melt or degrade easily,
and so it makes a good material
for a lament.
Halogen lights are a type of
Incandescent Light but contain
Halogen gas inside the bulb to
slow down degradation of the
lament, allowing it to with-
stand more heat, and making it
suitable for high intensity lights
(e.g. car head lights).
TELL ME MORE
Heat means Lifespan
Incandescent Lighting
KMJ, alpha masking by Edokter - GFDL - CC-SA-3.0
Redsimon - CC-Attrib-2.5-Generic - Wikimedia Commons
By 4028mdk09 Creative Commons Attribution-Share A like
3.0 Unported
Arcial Lighng
54
Arcial Lighng
MK350 Series Survival Handbook
Version 20140410b - Not for distribution - © Copyright 2014 UPRtek All rights reserved
Versio 20140410b - Not for distribution - © Copyright 2014 UPRtek All rights reserved
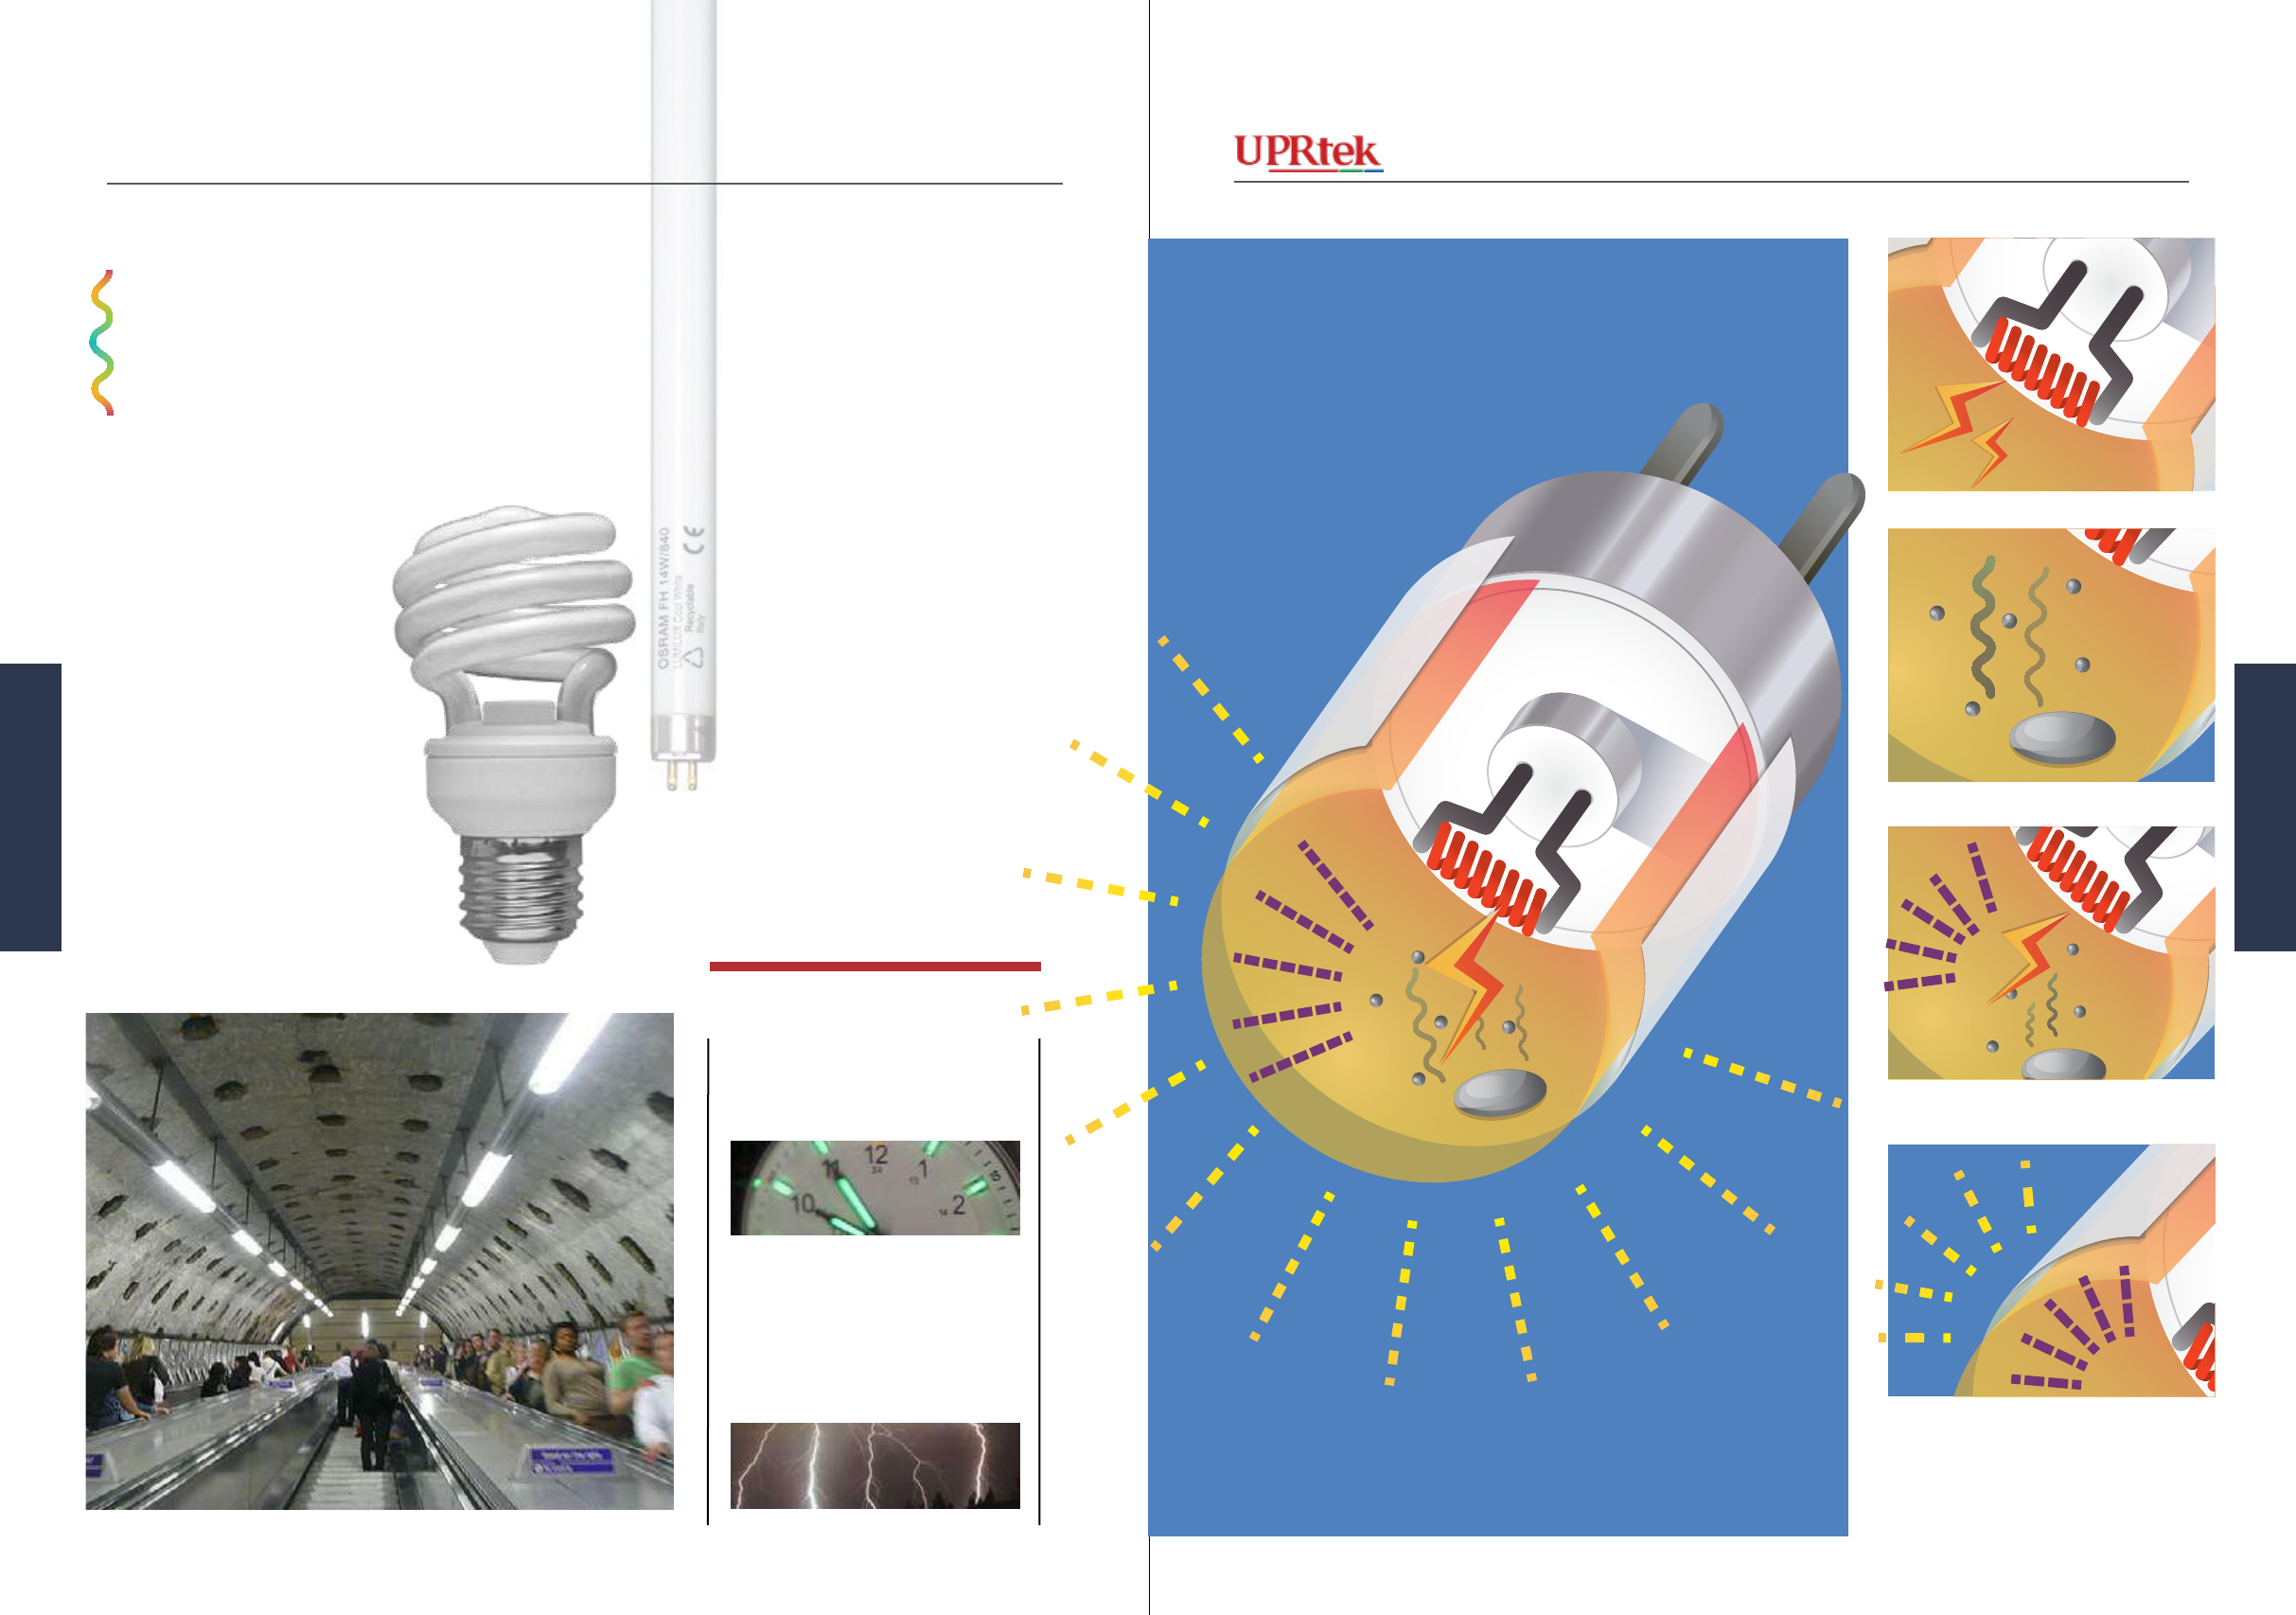
Fluorescent Lighting
Image: © Nevit Dilmen found at Wikimedia commons - CC-BY-SA-3.0
uses UV radiation to make light ...
Fluorescence uses light (or
electromagnetic radiation) to
make light - it’s related to phos-
phorescence (watches).
TELL ME MORE
Image by I, Autopilot - CC BY 2.5 Generic Wiki-
media Commons
Arc Lamp - Fluorescent Lights
are a type of Arc Lamp that pro-
duces light, typically through a
non-conductive medium, like
air. Lightning is similar, a type
of natural Arc Lamp.
Ziemor at pl.wikipedia - CC-BY-2.5-Generic
Fluorescent Lights have been
commercially available since
the 1930s as long Fluorescent
Tubes. A smaller bulb-like
CFL (Compact Fluorescent
Light) only became widely
available in the 2000s.
These lights use a mercury
vapor (steam) inside the tube;
electricity is applied within the
tube, which causes the mercury
vapor to emit UV light, or more
accurately UV radiation. The
UV radiation hits the inside sur-
face of the tube which is coated
with a phosphor material. The
UV radiation causes the phos-
phor to glow.
Their advantage is that they
are cooler and more energy
efcient than Incandescent.
Their disadvantage is that
Mercury is dangerous - if the
bulb is broken, it can present a
health hazard. Used bulb dis-
posal is also problematic.
1.Electricity warms the tube.
2.Mercury turns to vapor.
3.Vapor is excited by further elec-
tricity and UV light is emitted.
4.UV light hits the inside surface
of tube, which is coated with Phos-
phor material, which then glows
(emits light) - i.e. Using light (UV
light) to make visible light.
Fluorescent Lighting
Christian Taube, White Balance Deglr6328 - CC-BY-SA 2.0 - Germany
Sun Ladder - CC-BY-SA-3.0
Arcial Lighng
76
Arcial Lighng
MK350 Series Survival Handbook

Version 20140410b - Not for distribution - © Copyright 2014 UPRtek All rights reserved
Versio 20140410b - Not for distribution - © Copyright 2014 UPRtek All rights reserved
LED Lighting
Early LEDs (Light Emitting
Diodes) were used mainly for
small indicator lights for ap-
plications like display panels -
they have been used in this way
since the 1960s and they looked
like the bulbs at the top of this
page.
During the early 2000s, we
began to see LED technology
used for environment lighting
as well (e.g. homes, ofces, fac-
tories, schools) and LED bulbs
began to look much like our
Circuit Board Pro-
cessor made from
semiconductor
material
Early LED bulbs (from 1960s)
LED strips used for tube lighting.
Mcapdevila - Multi-license CC-BY-SA-3.0 and GFDL -
Wikimedia Commons
Afrank99 - CC-BY-SA-2.0 Generic Wikimedia Commons
uses semiconductors to make light ...
traditional light bulbs. They
even produced LED strips to
look like Fluorescent Tubes.
LEDs use semiconductors.
Yes, it’s similar to the material
used on processors for circuit
boards. However, the materials
used in LEDs are for the pur-
pose of producing light.
In addition to being cooler and
more energy efcient (like
Fluorescent Lighting), LEDs
have an added value of lasting
a VERY long time, in addition
to being shatter/shock proof.
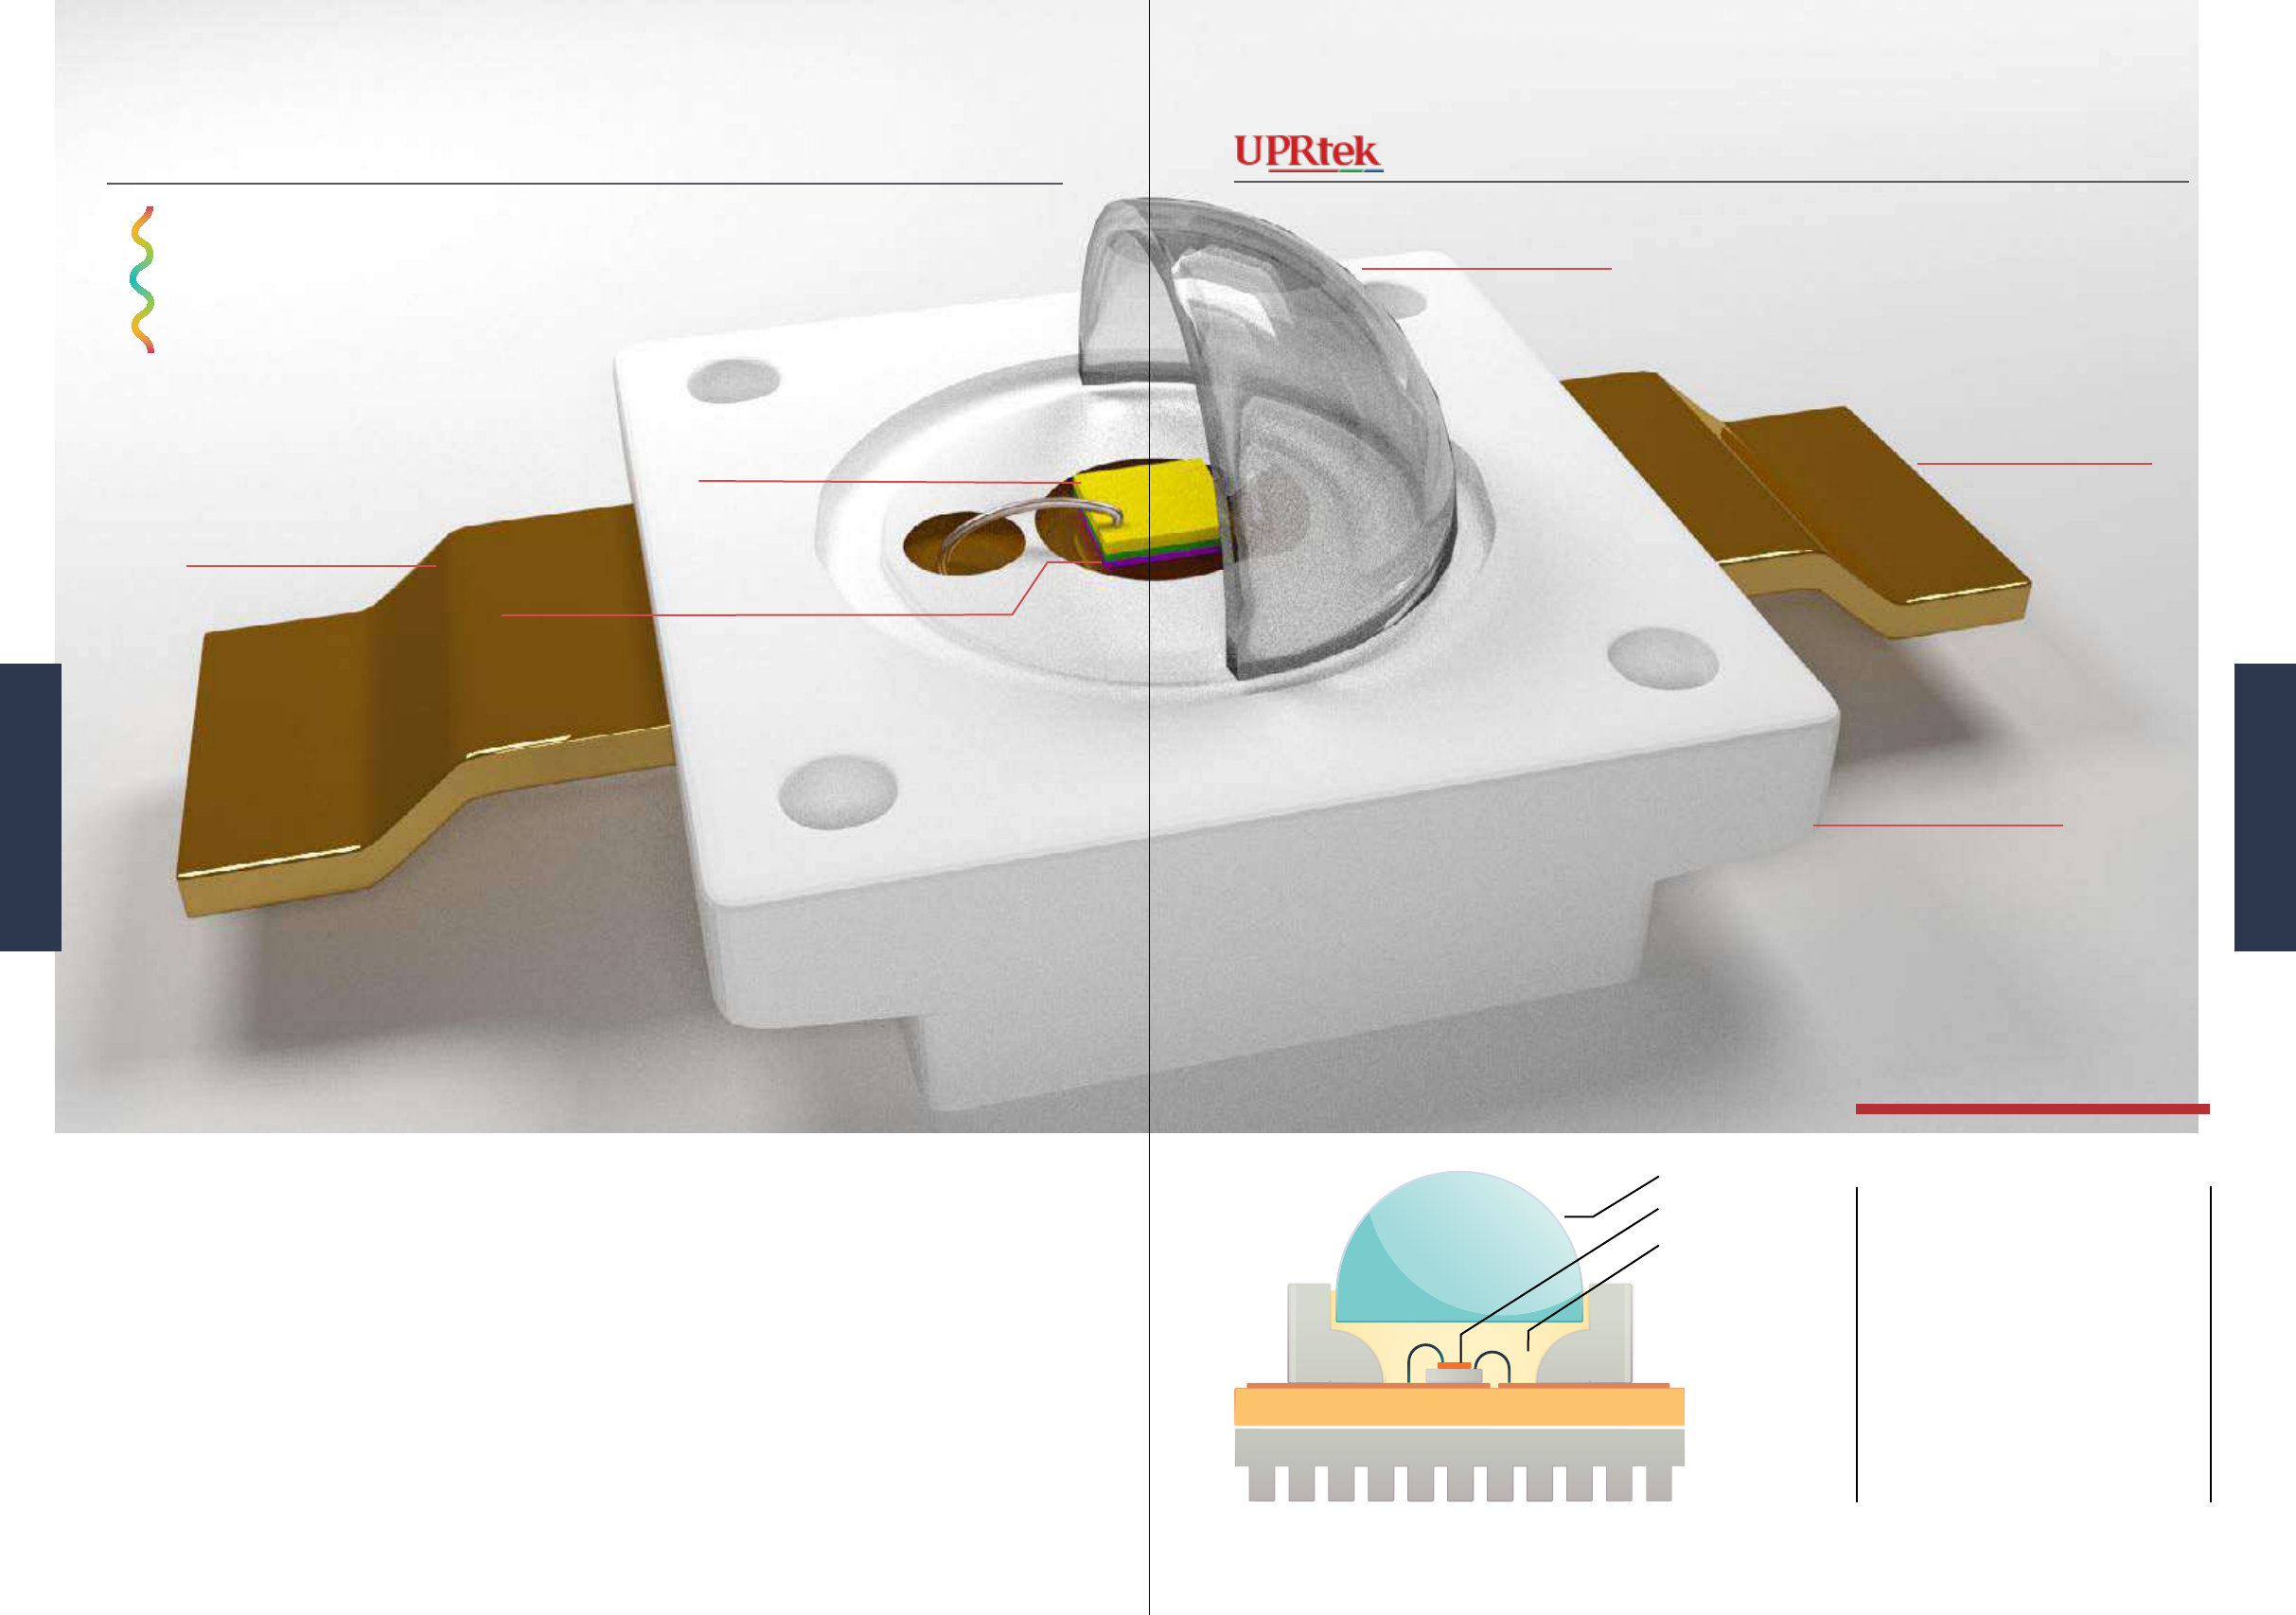
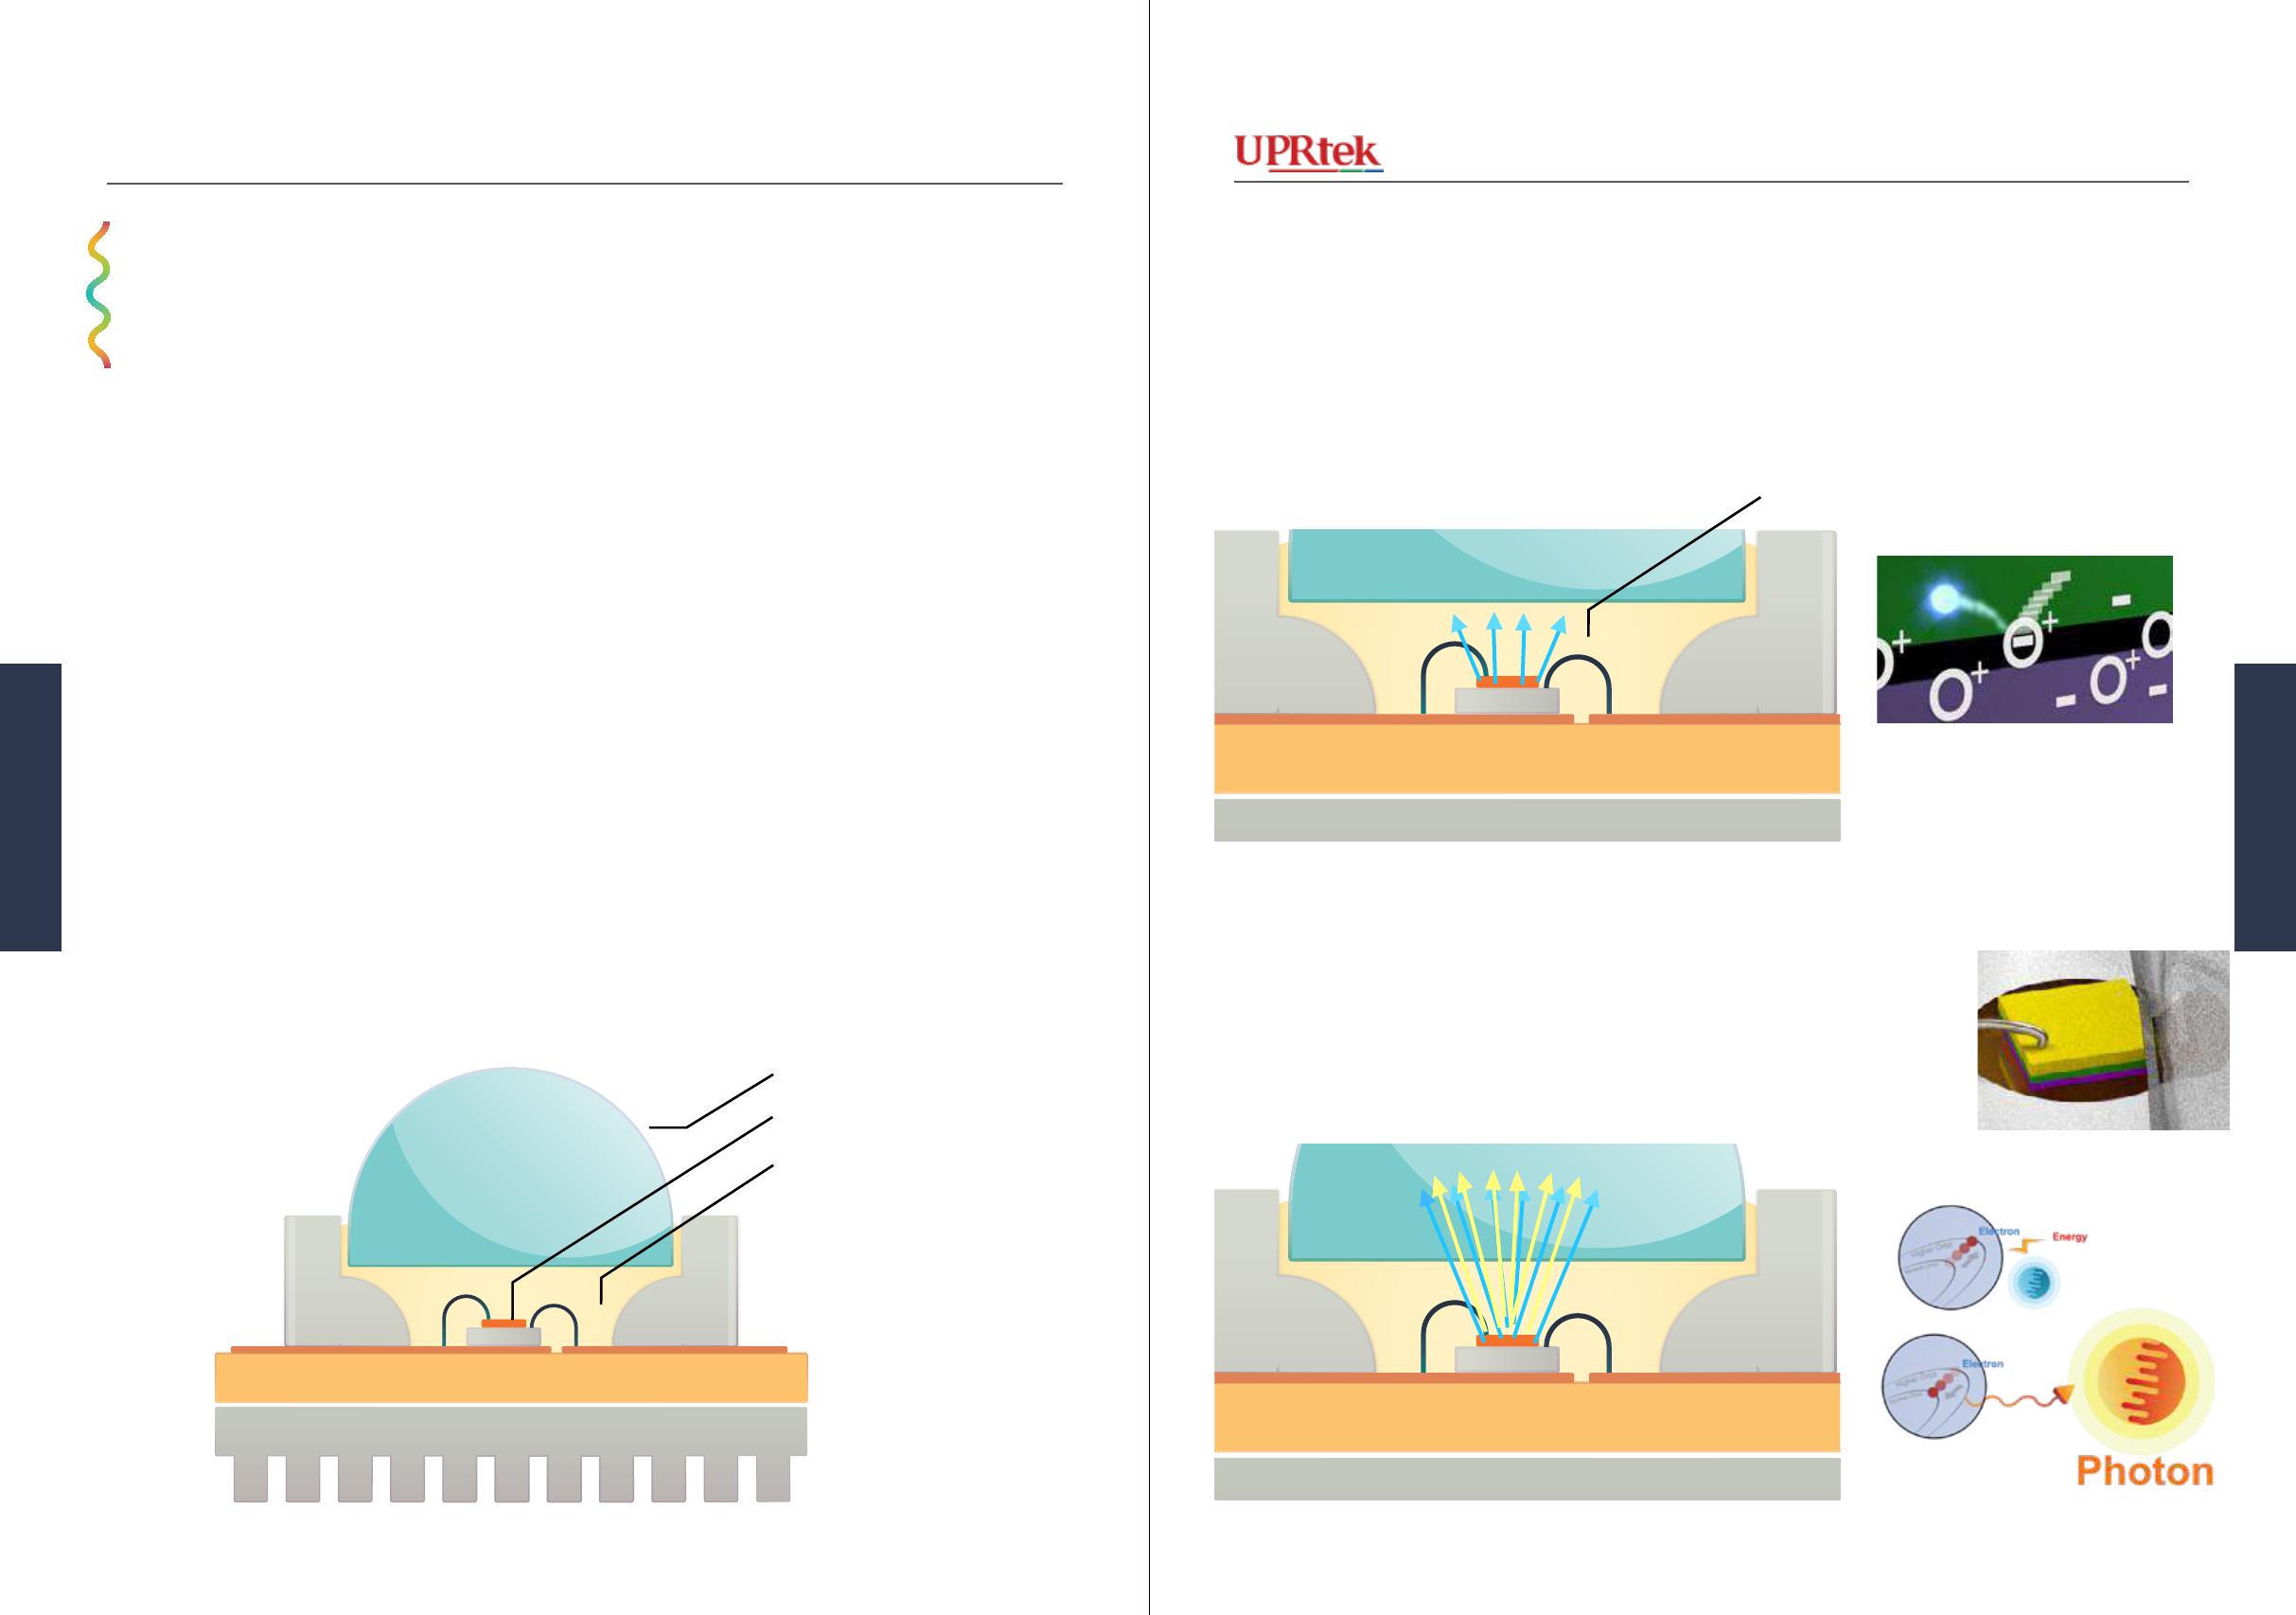
As you can see from the early LED lights,
the semiconductor is a very small compo-
nent. The semiconductor itself produces a
bluish-white light and the lens/case chang-
es the color to t the application. More
recent LEDs might appear as below, but
the same semiconductor principles apply.
Modern LEDs may look like this ... or like this ...
+
-
Anode
Cathode
Epoxy lens/case
Semiconductor die
or like this ...
LED Lighting
Arcial Lighng
98
Arcial Lighng
MK350 Series Survival Handbook
Version 20140410b - Not for distribution - © Copyright 2014 UPRtek All rights reserved
Versio 20140410b - Not for distribution - © Copyright 2014 UPRtek All rights reserved
LED Lighting
LED lights work when elec-
tricity is run through the semi-
conductor die, which makes it
produce a bluish light.
Notice the yellow layer on top
of the semiconductor - it chang-
es the semiconductor’s bluish
light to become more of a com-
fortable white light - sometimes
A closer look ...
this yellow layer is referred
to as the Fluorescent layer or
Phosphor layer.
The LED may have a lens on
top to redirect the light to ob-
tain uniform overall intensity.
Cathode
Semiconductor Die
Phosphorescence vs. Fluores-
cence
Both use “light to make light”.
However, phosphorescent material
does not immediately re-emit the
radiation it absorbs.
Die or Diode - these words may
sometimes be used in place of
LED chip or semiconductor chip.
LED Package - this is the entire
housing (i.e. package) for the
LED.
Fluorescent Layer
LED chip
Lens
Lens
Anode
Package
Fluorescent
TELL ME MORE
Arcial Lighng
1110
Arcial Lighng
MK350 Series Survival Handbook
Version 20140410b - Not for distribution - © Copyright 2014 UPRtek All rights reserved
Versio 20140410b - Not for distribution - © Copyright 2014 UPRtek All rights reserved
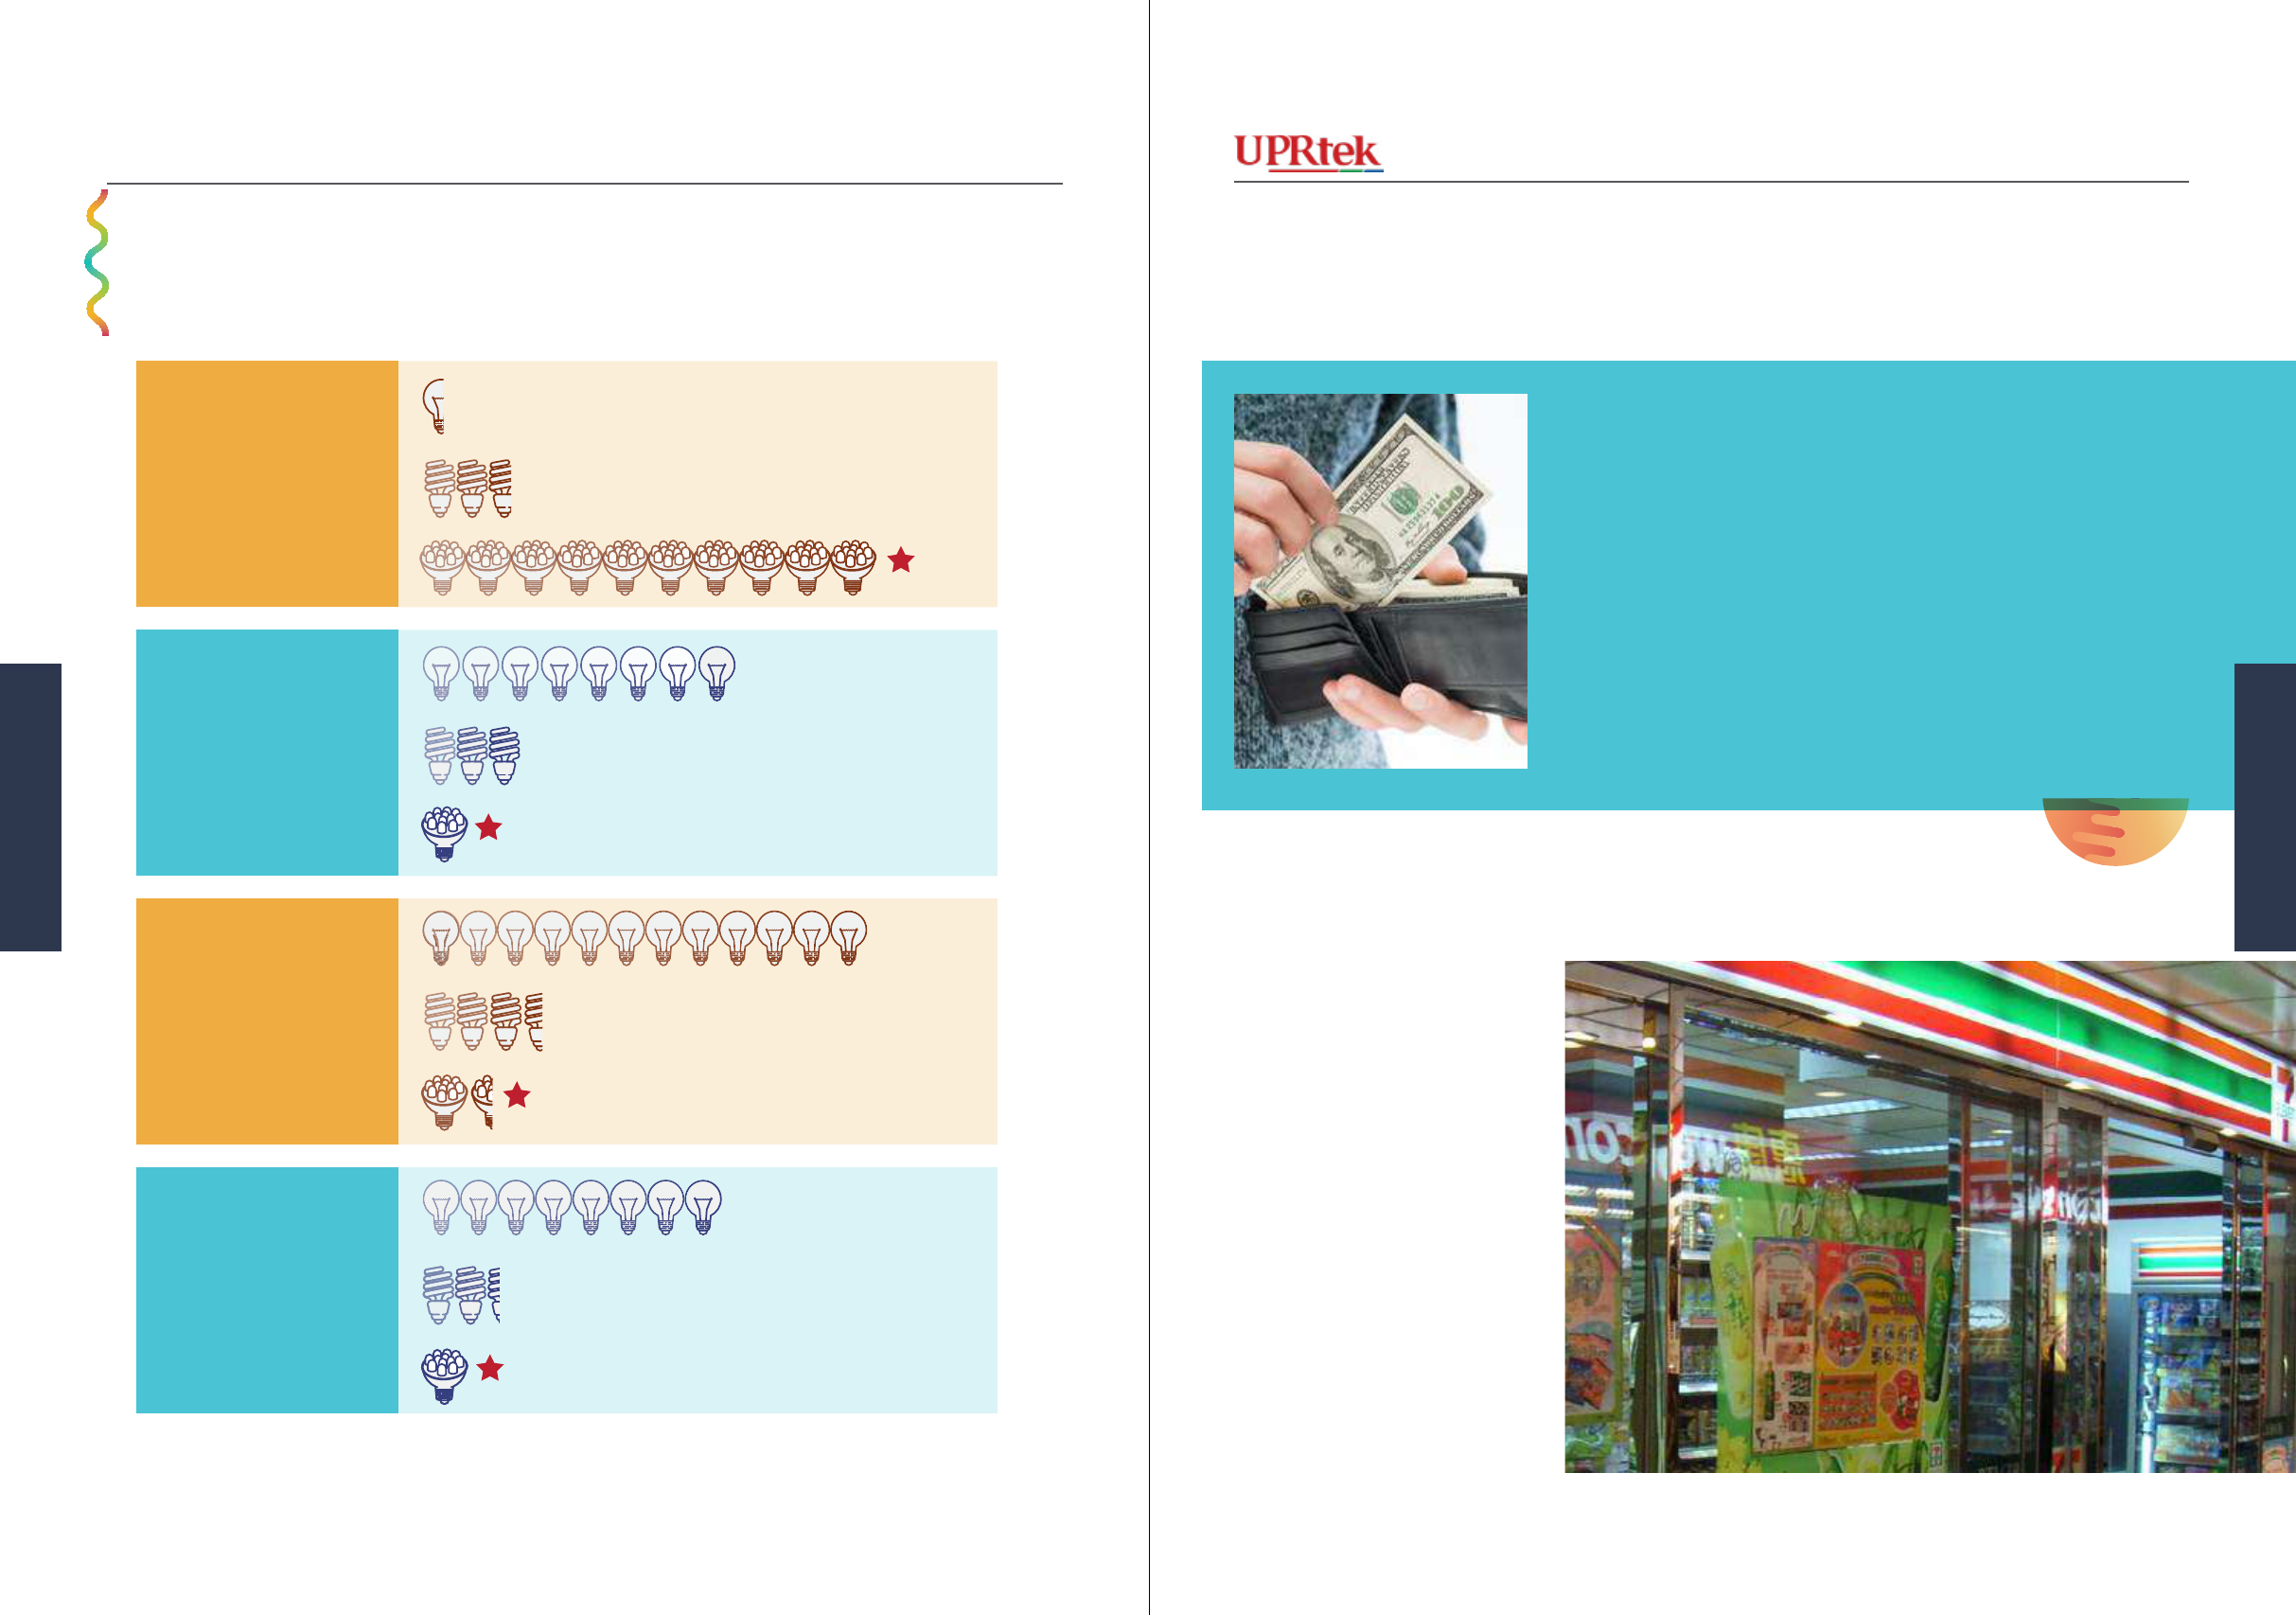
Advantages & Disadvantages
Practically and economically speaking, LEDs seem to have a huge advantage and this is why
most newly built facilities in developing countries are choosing LEDs for most of their envi-
ronment lighting (e.g. factories, ofces, libraries, museums).
So why continue
to buy Incandescent
Lights?
For the consumer, it is the
out-of-pocket expense that is a
signicant factor. A retail LED
(as of this writing 1/2014) may
cost $15 out-of-pocket but an
Incandescent bulb may cost
you only $3. Which would you
buy? What if you had to re-
So why continue
to buy Fluorescent
Lights?
Fluorescent Lights fall between
Incandescent and LEDs. It lasts
much longer than an Incandes-
cent light, but it’s cheaper than
an LED light.
It’s ideal for places that are
not assured a long term loca-
tion (e.g. for a convenience
store that is renting space, why
would you buy a 50,000 hour
LED light?).
CC-BY-SA-2.5 Generic - NoAuthorListed
place 2 bulbs ($30 vs $6).
The Incandescent light also
comes as close to natural sun-
light compared to the other two,
and its light quality is close
to Sunlight, which is the gold
standard for light because, as
evolutionary beings, our eyes
have become accustomed to
sunlight and the rich colors it
produces.
Life Span (average)
Watts of electricity used
(equivalent to 60 watt bulb)
Kilo-watts of Electricity used
(equivalent to 30
Incandescent Bulbs
per year)
Annual Operating Cost
(equivalent to 30
Incandescent Bulbs
per year)
50,000 hours
6-8 watts
3285 KWh/yr
767 KWh/yr
329 KWh/yr
$ 32.85 /year
$ 76.65 /year
$ 328.59 /year
60 watts
13-15 watts
1,200 hours
8,000 hours
Advantages & Disadvantages
Why people still use incandescent bulbs (USAtoday 12/27/2013)
http://www.usatoday.com/story/news/nation-now/2013/12/27/incandescent-light-bulbs-phaseout-leds/4217009/
Arcial Lighng
1312
Arcial Lighng
MK350 Series Survival Handbook
Version 20140410b - Not for distribution - © Copyright 2014 UPRtek All rights reserved
Versio 20140410b - Not for distribution - © Copyright 2014 UPRtek All rights reserved
Disadvantages ...
The fragile Fluorescent tube
can easily shatter and presents
a health hazard when the toxic
Mercury liquid is exposed;
clean up requires careful, me-
ticulous removal procedures.
Mercury exposure is known to
cause neurological problems.
The most troublesome aspect of
incandescent lights is its indis-
criminate use of energy.
90% of the energy used is dissi-
pated as heat - only about 10%
is released as light.
LEDs use semiconductors -
though you may think this type
of technology is quite sophis-
ticated, the actual production
of the LED chip is not always
an exact science - LED light
quality can vary quite greatly
between batches and each batch
may be categorized and sold as
different qualities of color and
intensity.
Fluorescent Lights use UV light
inside their tubes, but small
amounts do escape - UV light is
harmful to the eyes and skin.
Fluorescent Lights have also
been known to Flicker - studies
indicate that long term exposure
to light icker is harmful to our
eyes.
Fluorescent Light - Health Issues
LED lights
Not all LED chips are created equal
In fact, CPUs used in com-
puters are also semiconductor
based and have similar issues -
they cannot guarantee the same
exact performance from batch
to batch and measures must be
taken to moderate performance
expectations (e.g. over-clock-
ing).
Incandescent Light
http://www.designrecycleinc.com/led%20comp%20chart.html
Arcial Lighng
1514
Arcial Lighng
MK350 Series Survival Handbook
Version 20140410b - Not for distribution - © Copyright 2014 UPRtek All rights reserved
Versio 20140410b - Not for distribution - © Copyright 2014 UPRtek All rights reserved
The Market
■ There are still lots of people who use incan-
descent lights (mostly in homes).
■ There are still lots of Fluorescent Lights in
public places (e.g. hospitals, ofces etc.).
■ Lighting designers are saying new facilities
(factories, hospitals, libraries etc.) are most
likely to install LEDs.
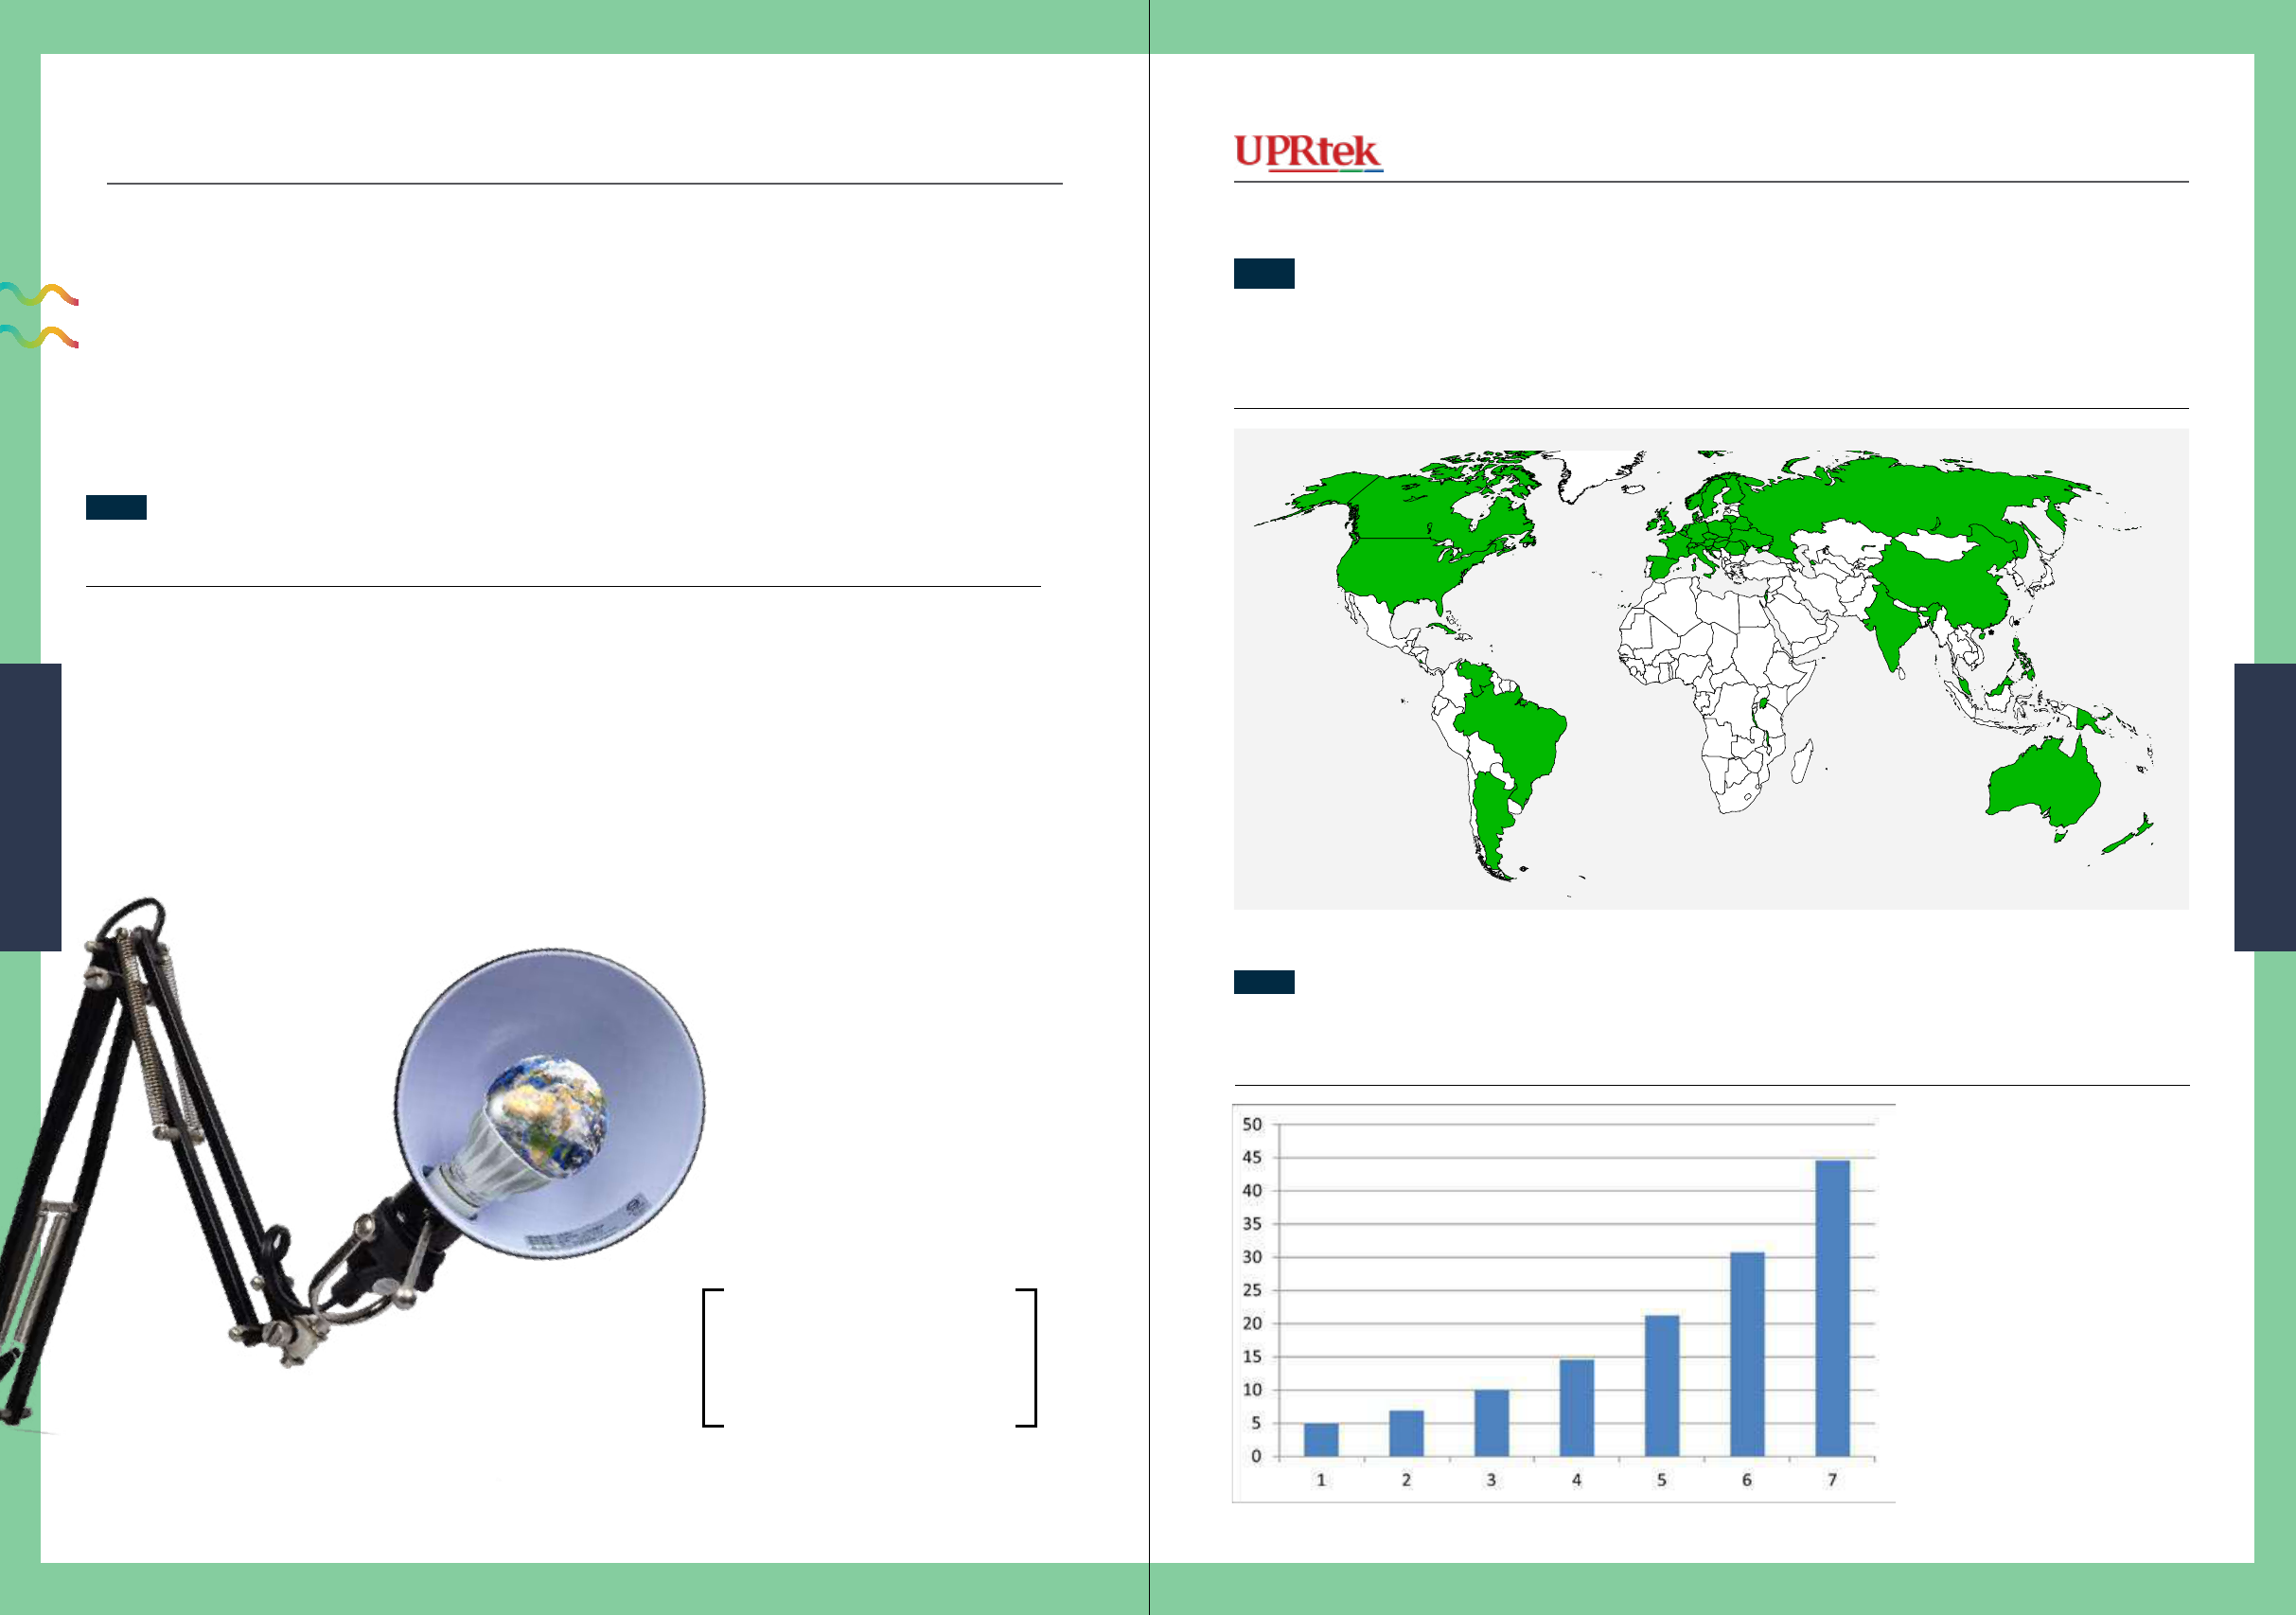
G’bye to Incandescent
Countries exercising full, partial, planned bans of incandescent bulbs or exchange programs.
(according http://en.wikipedia.org/wiki/Phase-out_of_incandescent_light_bulbs as of this writing 02/2014)
Hello to LED
Estimated North American LED market to grow about 45% every year over the next 7-8 years.
A changing world - What we know
Bottom Line:
LEDs are on course to take
over the world.
■ Some existing facilities are changing out
their lights completely for LEDs, already
realizing the long term cost savings.
■ Most developed countries are exercising
phase-out plans for use of incandescent
bulbs.
■ The price of an LED bulb is dropping to the
point that they will start to compete with
CFLs for market share and eventually sur-
pass them in a few years (maybe by 2015).
The Market
Original by Ukelay33 - GFDL- CC-BY-SA-3.0 - Adapted for this topic
Arcial Lighng
1716
Arcial Lighng
MK350 Series Survival Handbook
Version 20140410b - Not for distribution - © Copyright 2014 UPRtek All rights reserved
Versio 20140410b - Not for distribution - © Copyright 2014 UPRtek All rights reserved
The importance of
understanding light.
Understanding the basics of what light is and where
light comes from is the key to understanding LED
lighting and MK350 devices. However, we must rst
get our feet wet in the world of Science, particularly
Physics and Chemistry. This section explains the
lighting fundamentals in layman terms, in a straight-
forward, concise and practical way, without any
MATH!
Before we begin, we must set some expec-
tations. Physics and Chemistry are like
Magic - there are things you will see that
will amaze and confound you at the same
time. So it’s important to prepare yourself
to turn your world upside-down and be
ready for anything.
A little Science and Magic ...
Dispersive_Prism_Illustration_by_Spigget.jpg: Spigget, derivative work: Cepheiden (talk)
CC-BY-SA-3.0 Generic - Wikimedia Commons
Turning your world
upside-down
Where does Light come from?
Where does light come from?
1918 MK350 Series Survival Handbook
Light
Light
Version 20140410b - Not for distribution - © Copyright 2014 UPRtek All rights reserved
Versio 20140410b - Not for distribution - © Copyright 2014 UPRtek All rights reserved
Molecular
Structure
Determines
Color
Texture
Smell
Weight
Conductivity
and more ...
1
2
3
4
What is an atom?
Light comes from atoms, so we need to rst under-
stand what an atom is. Everything is made of atoms.
The table, the wall, your cell phone, oxygen ... even
you. Actually, an atom is so small that you can’t really
see one - but, when you combine them together, they
become things, like water.
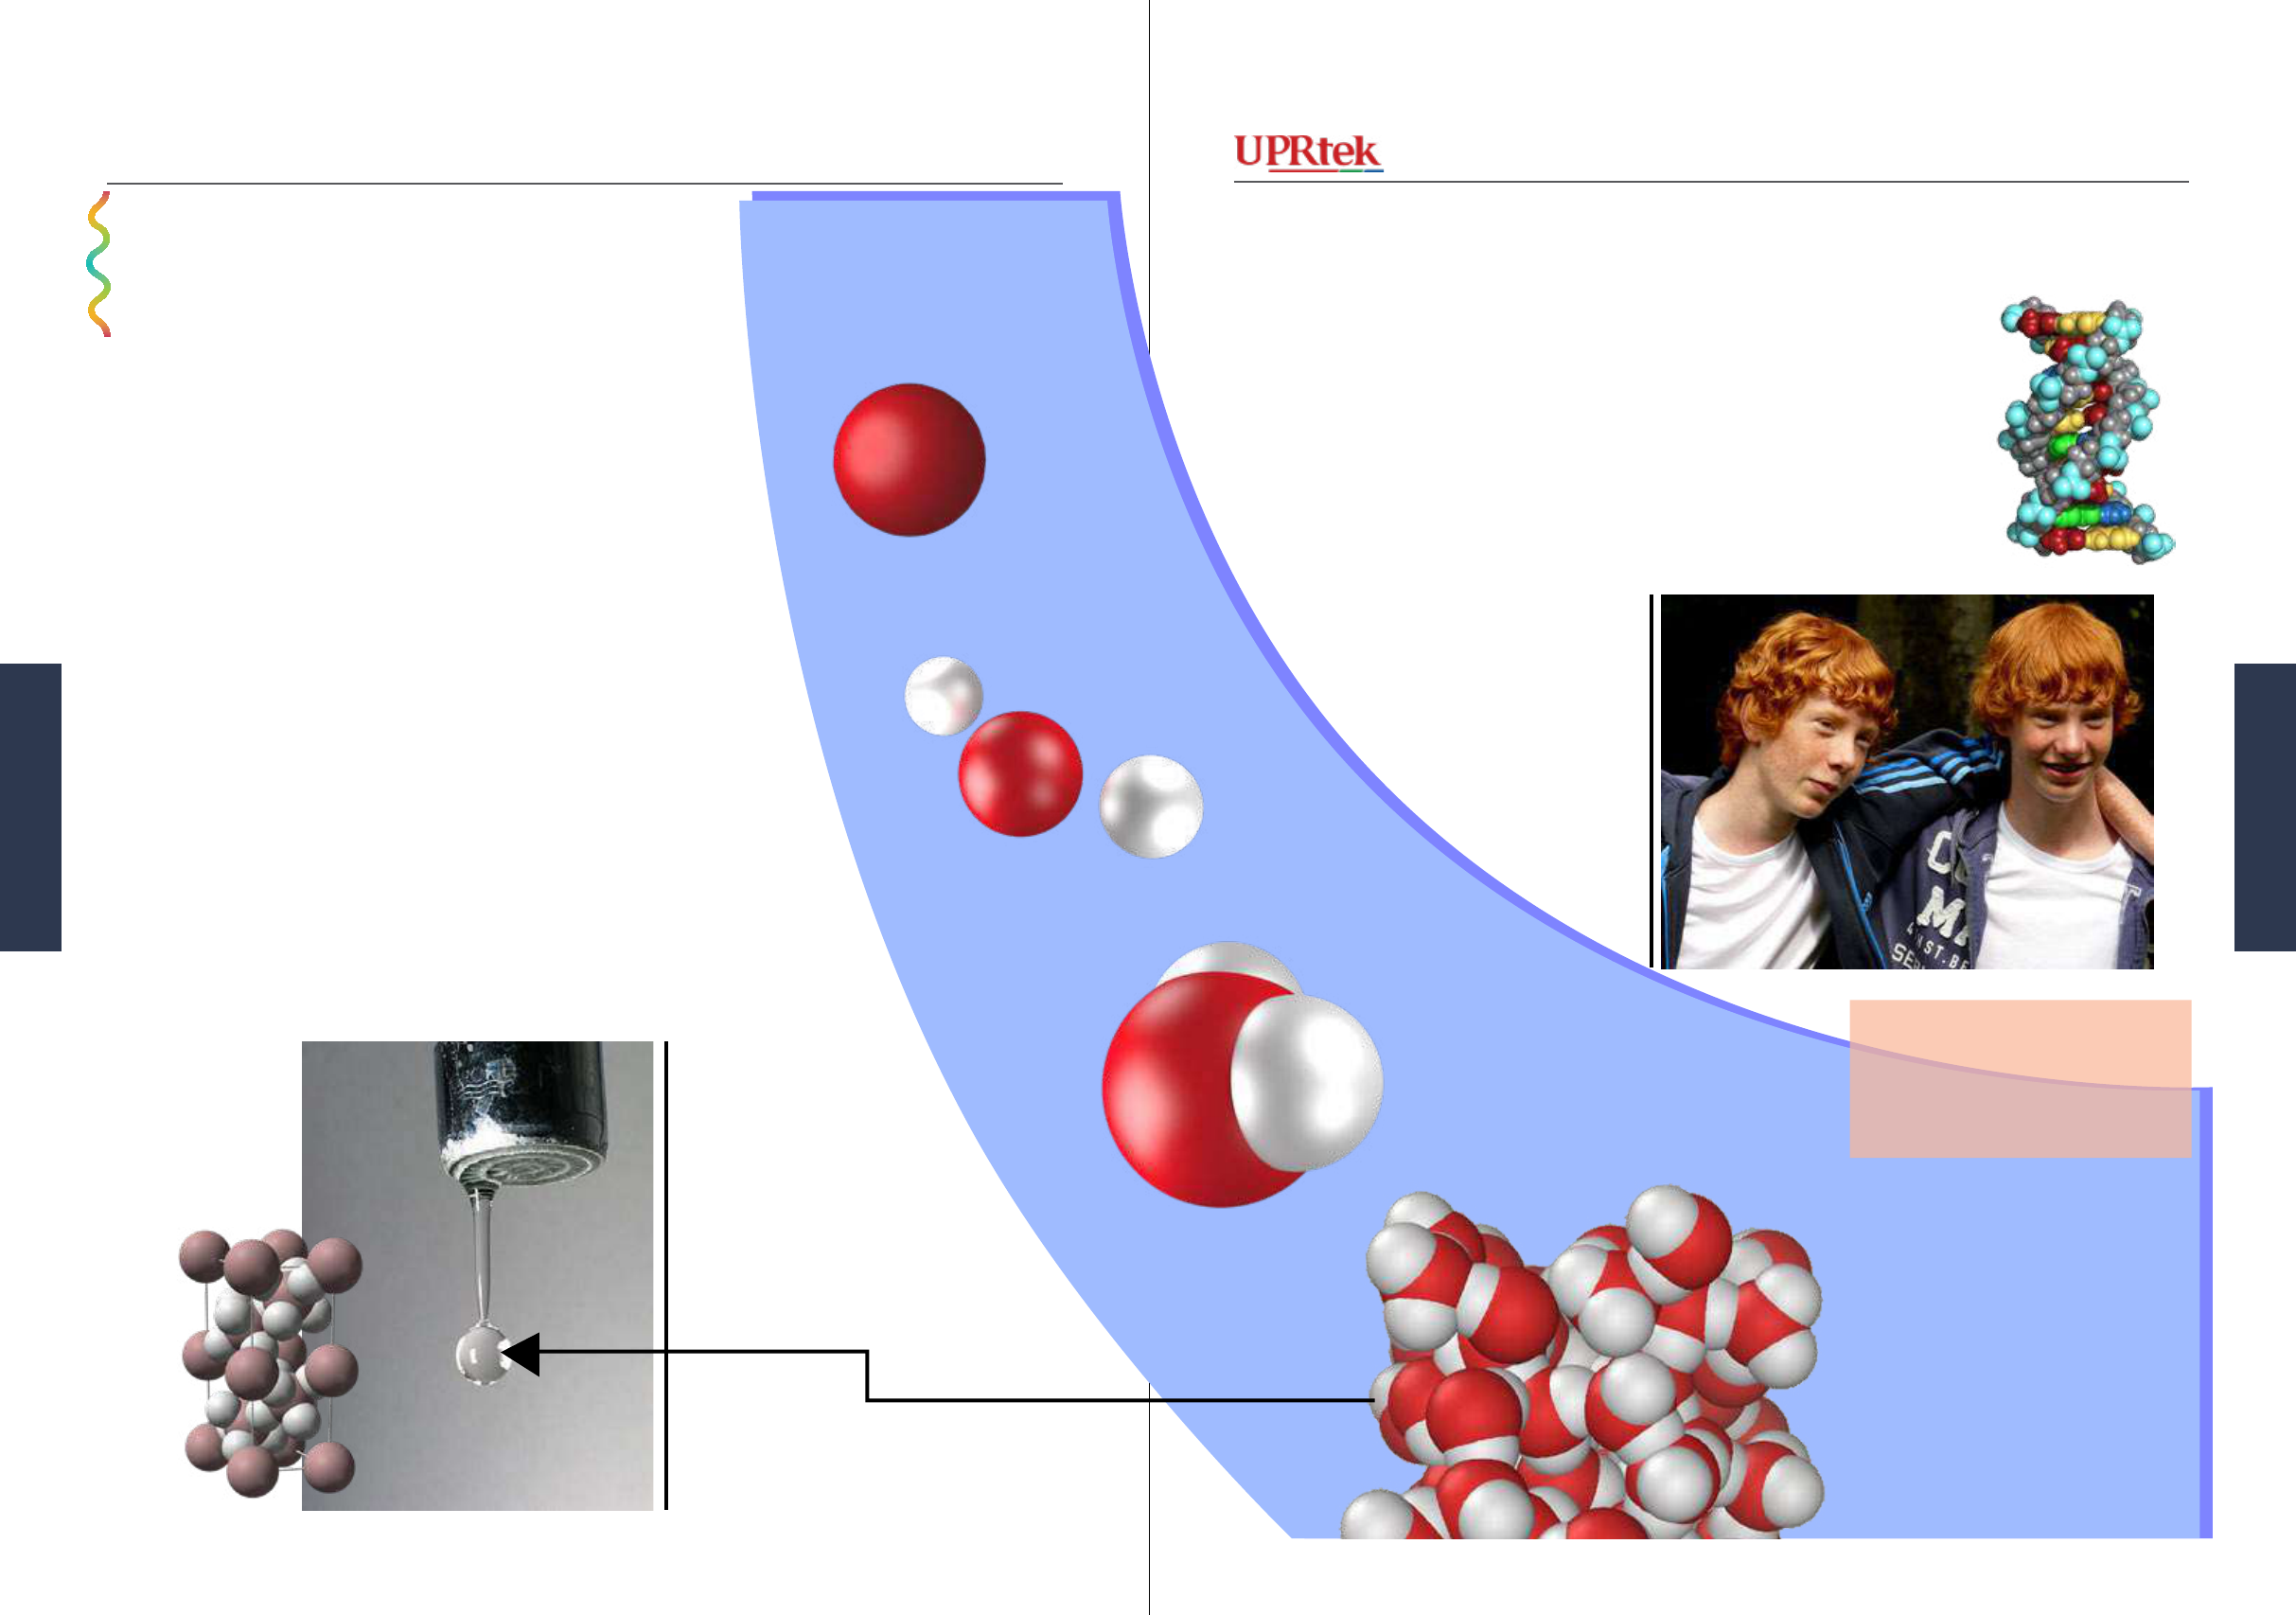
What is a molecule?
Atoms in an object are usually arranged into groups
of atoms called molecules. For example, if I take one
Oxygen (O) atom and add two Hydrogen (O) atoms, I
get an H
2
O molecule. These atoms are attracted together
by forces (electrostatic forces). Many molecules form
an object - sometimes these molecules are loosely held
together like water, or sometimes they are tightly held
together like metals. It all depends on the molecular
structure.
Oxygen Atom
Molecules determines, like DNA determines
Your DNA determines your physical characteristics; your gender; how tall,
how heavy, the color of your hair. In a similar way, Molecular structure
determines an object’s characteristics; its color, its texture, its smell , its
weight, ability to conduct electricity, melting temperature etc. Metal is sol-
id, water is liquid - it’s all because their molecular structures are different.
Dschwen - CC-BY-SA-2.5 Generic Wikimedia Commons
Eddy Van 3000 - Creative Commons Attribution-Share Alike 2.0 Generic - Wikime-
dia Commons
One Oxygen Atom and
Two Hydrogen Atoms
H
2
O Molecule
Many H
2
O molecules
become water
P99am - Creative Commons Attribution-Share Alike 3.0 Unported
Molecular Structure of
Aluminum
It’s Like
Atoms Make Light
Atoms Make Light
2120 MK350 Series Survival Handbook
Light
Light
Version 20140410b - Not for distribution - © Copyright 2014 UPRtek All rights reserved
Versio 20140410b - Not for distribution - © Copyright 2014 UPRtek All rights reserved
Electrons are the Key
It’s Like
Let’s take a closer look ...
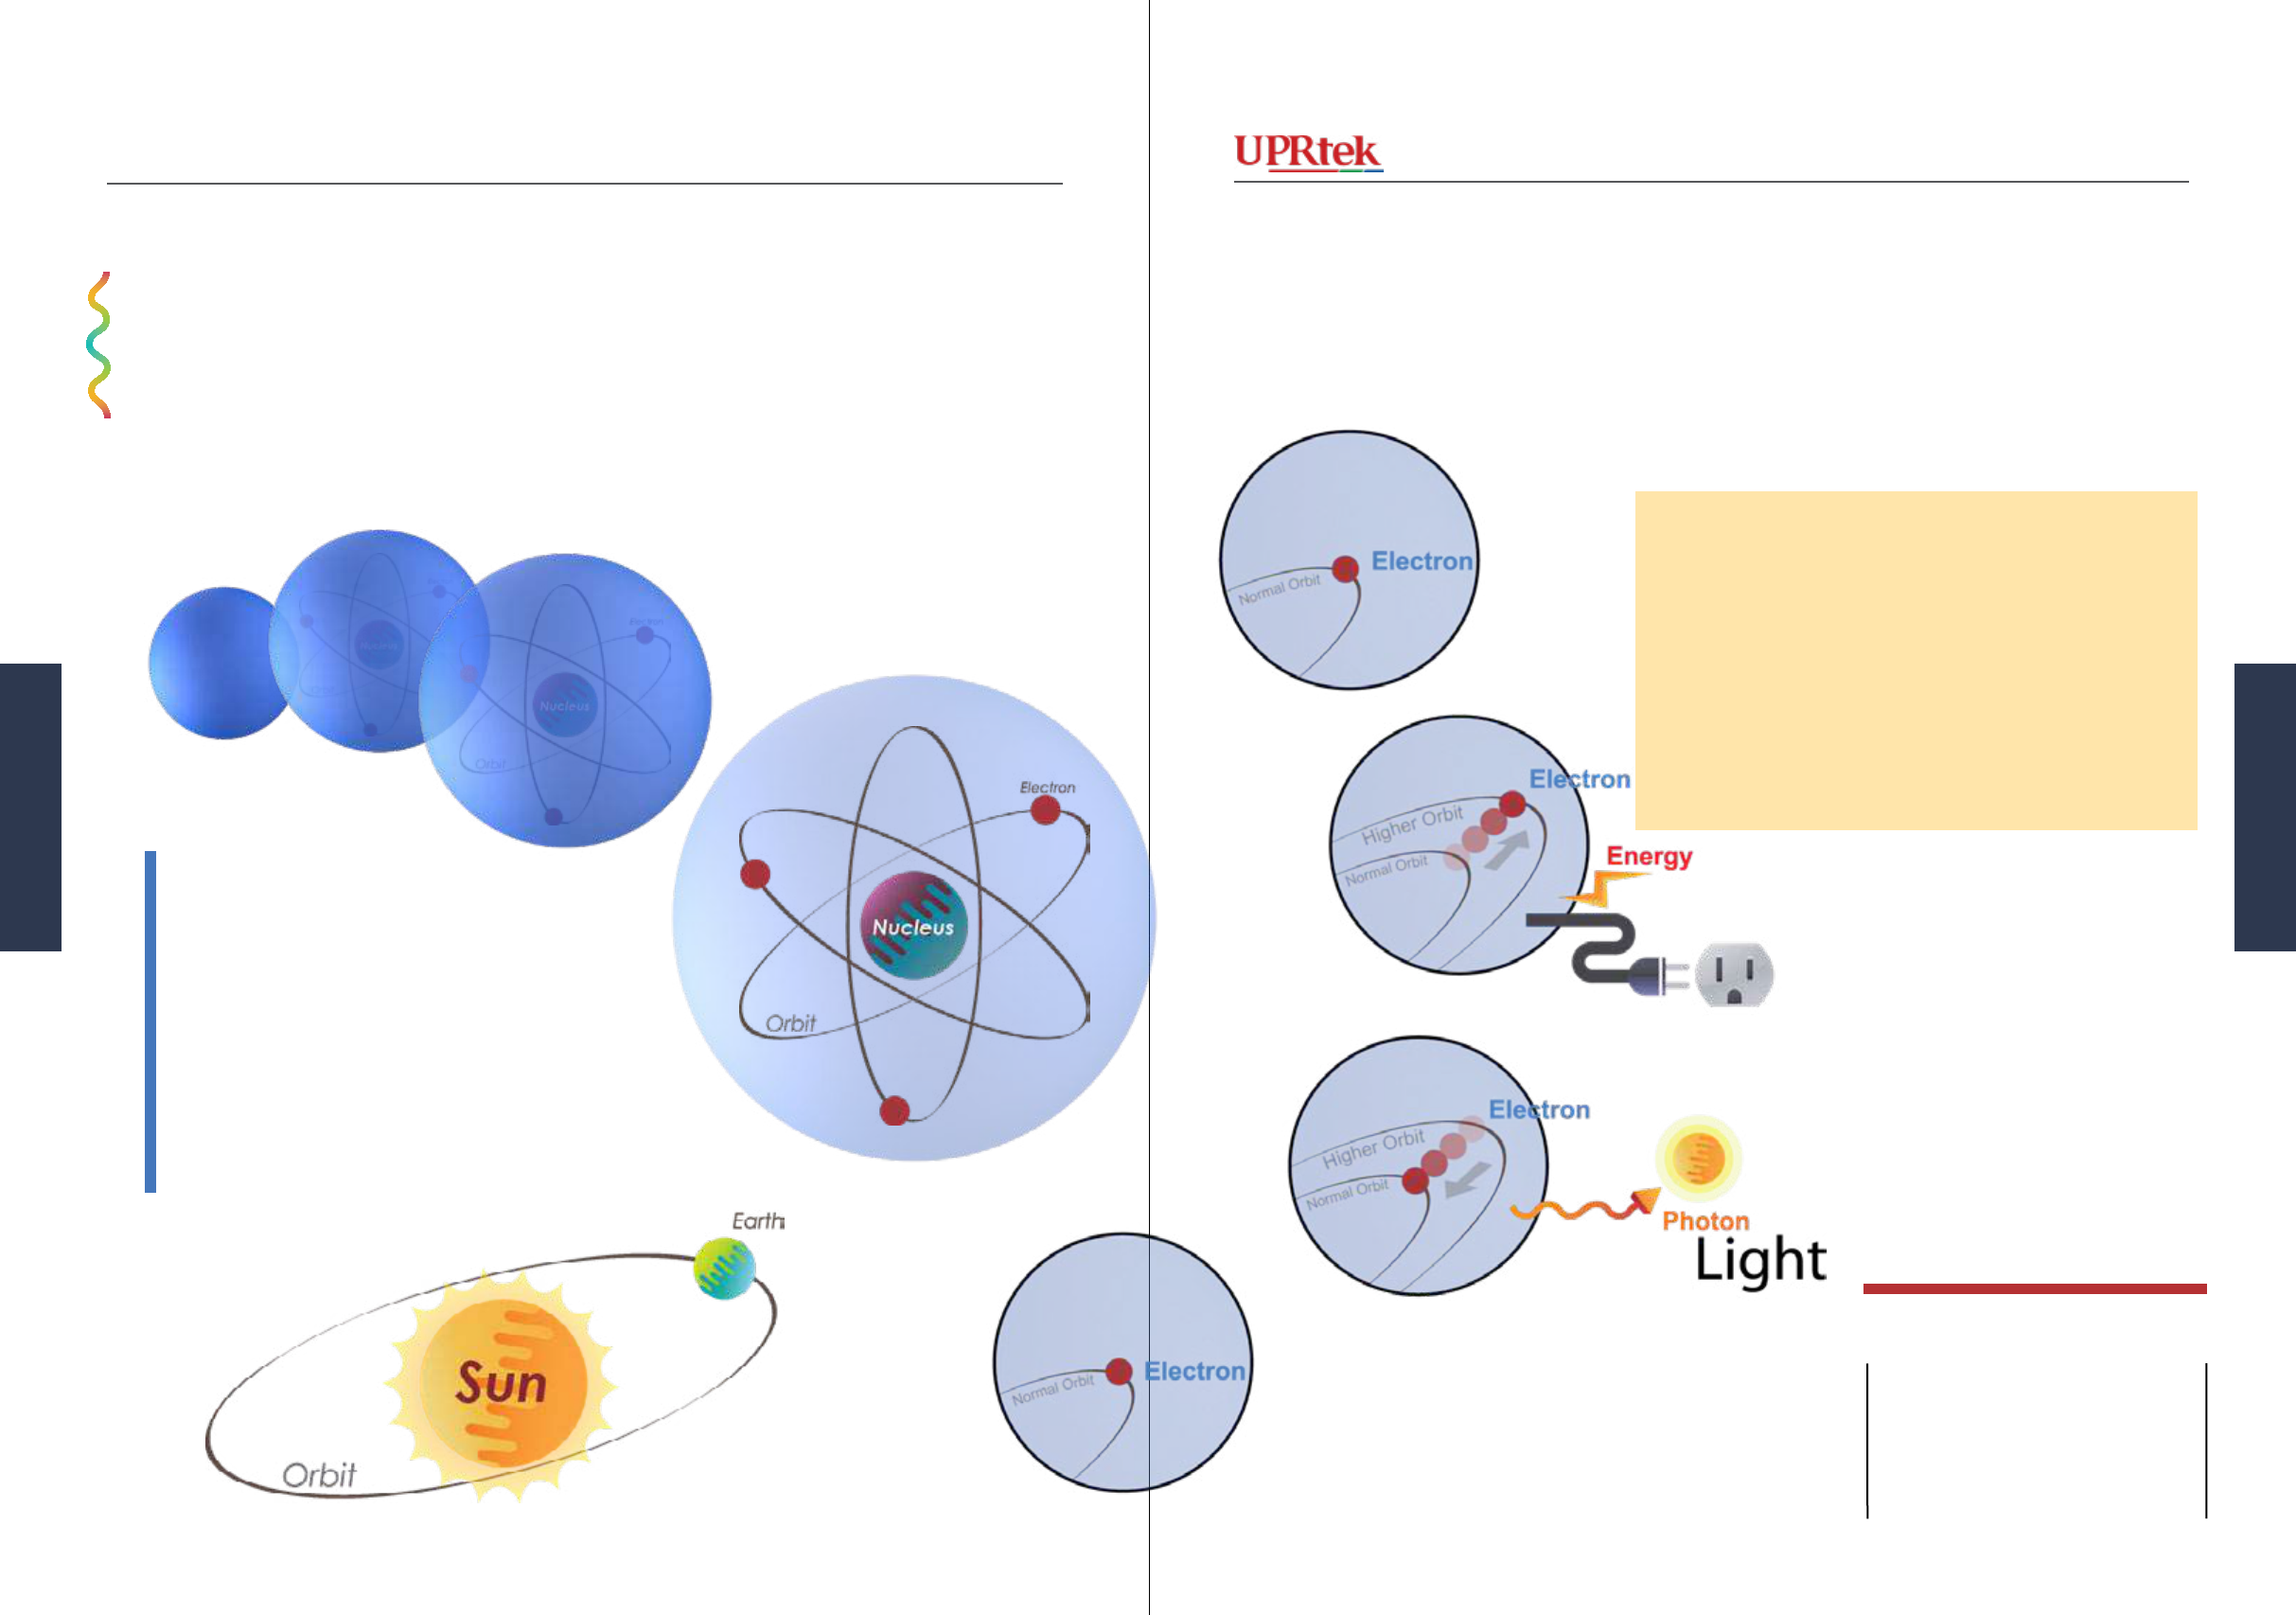
Making light from an atom is an easy
process. You just need a little imagination.
Inside an atom, there is a large nucleus -
then there is a small electron (s) that ies
around the nucleus in a xed orbit - you
can think of it as the Sun (nucleus) with the
smaller Earth (electron) orbiting it. When
energy is thrust upon the atom, the electron
ies out to a higher orbit. When it returns
to its original (natural) orbit, light is emit-
ted.
1
2
3
4
1. The electron ies around in its natural orbit.
2. Energy can be added which causes the electron to
move to a higher energy orbit for a short time.
3. The electron returns to its lower natural orbit and
light (photons) is released (energy released).
4. The electron remains in its natural orbit, until it is
excited again into a higher orbit and the process
repeats itself.
Making Light of Things
Nucleus -The Nucleus of an
atom contains neutrons and
protons. Protons are positively
charged, Electrons are nega-
tively charged and Neutrons are
neutral (no charge).
TELL ME MORE
Atoms make Light
2322 MK350 Series Survival Handbook
Light
Light
Version 20140410b - Not for distribution - © Copyright 2014 UPRtek All rights reserved
Versio 20140410b - Not for distribution - © Copyright 2014 UPRtek All rights reserved
How does an
Incandescent bulb make light?
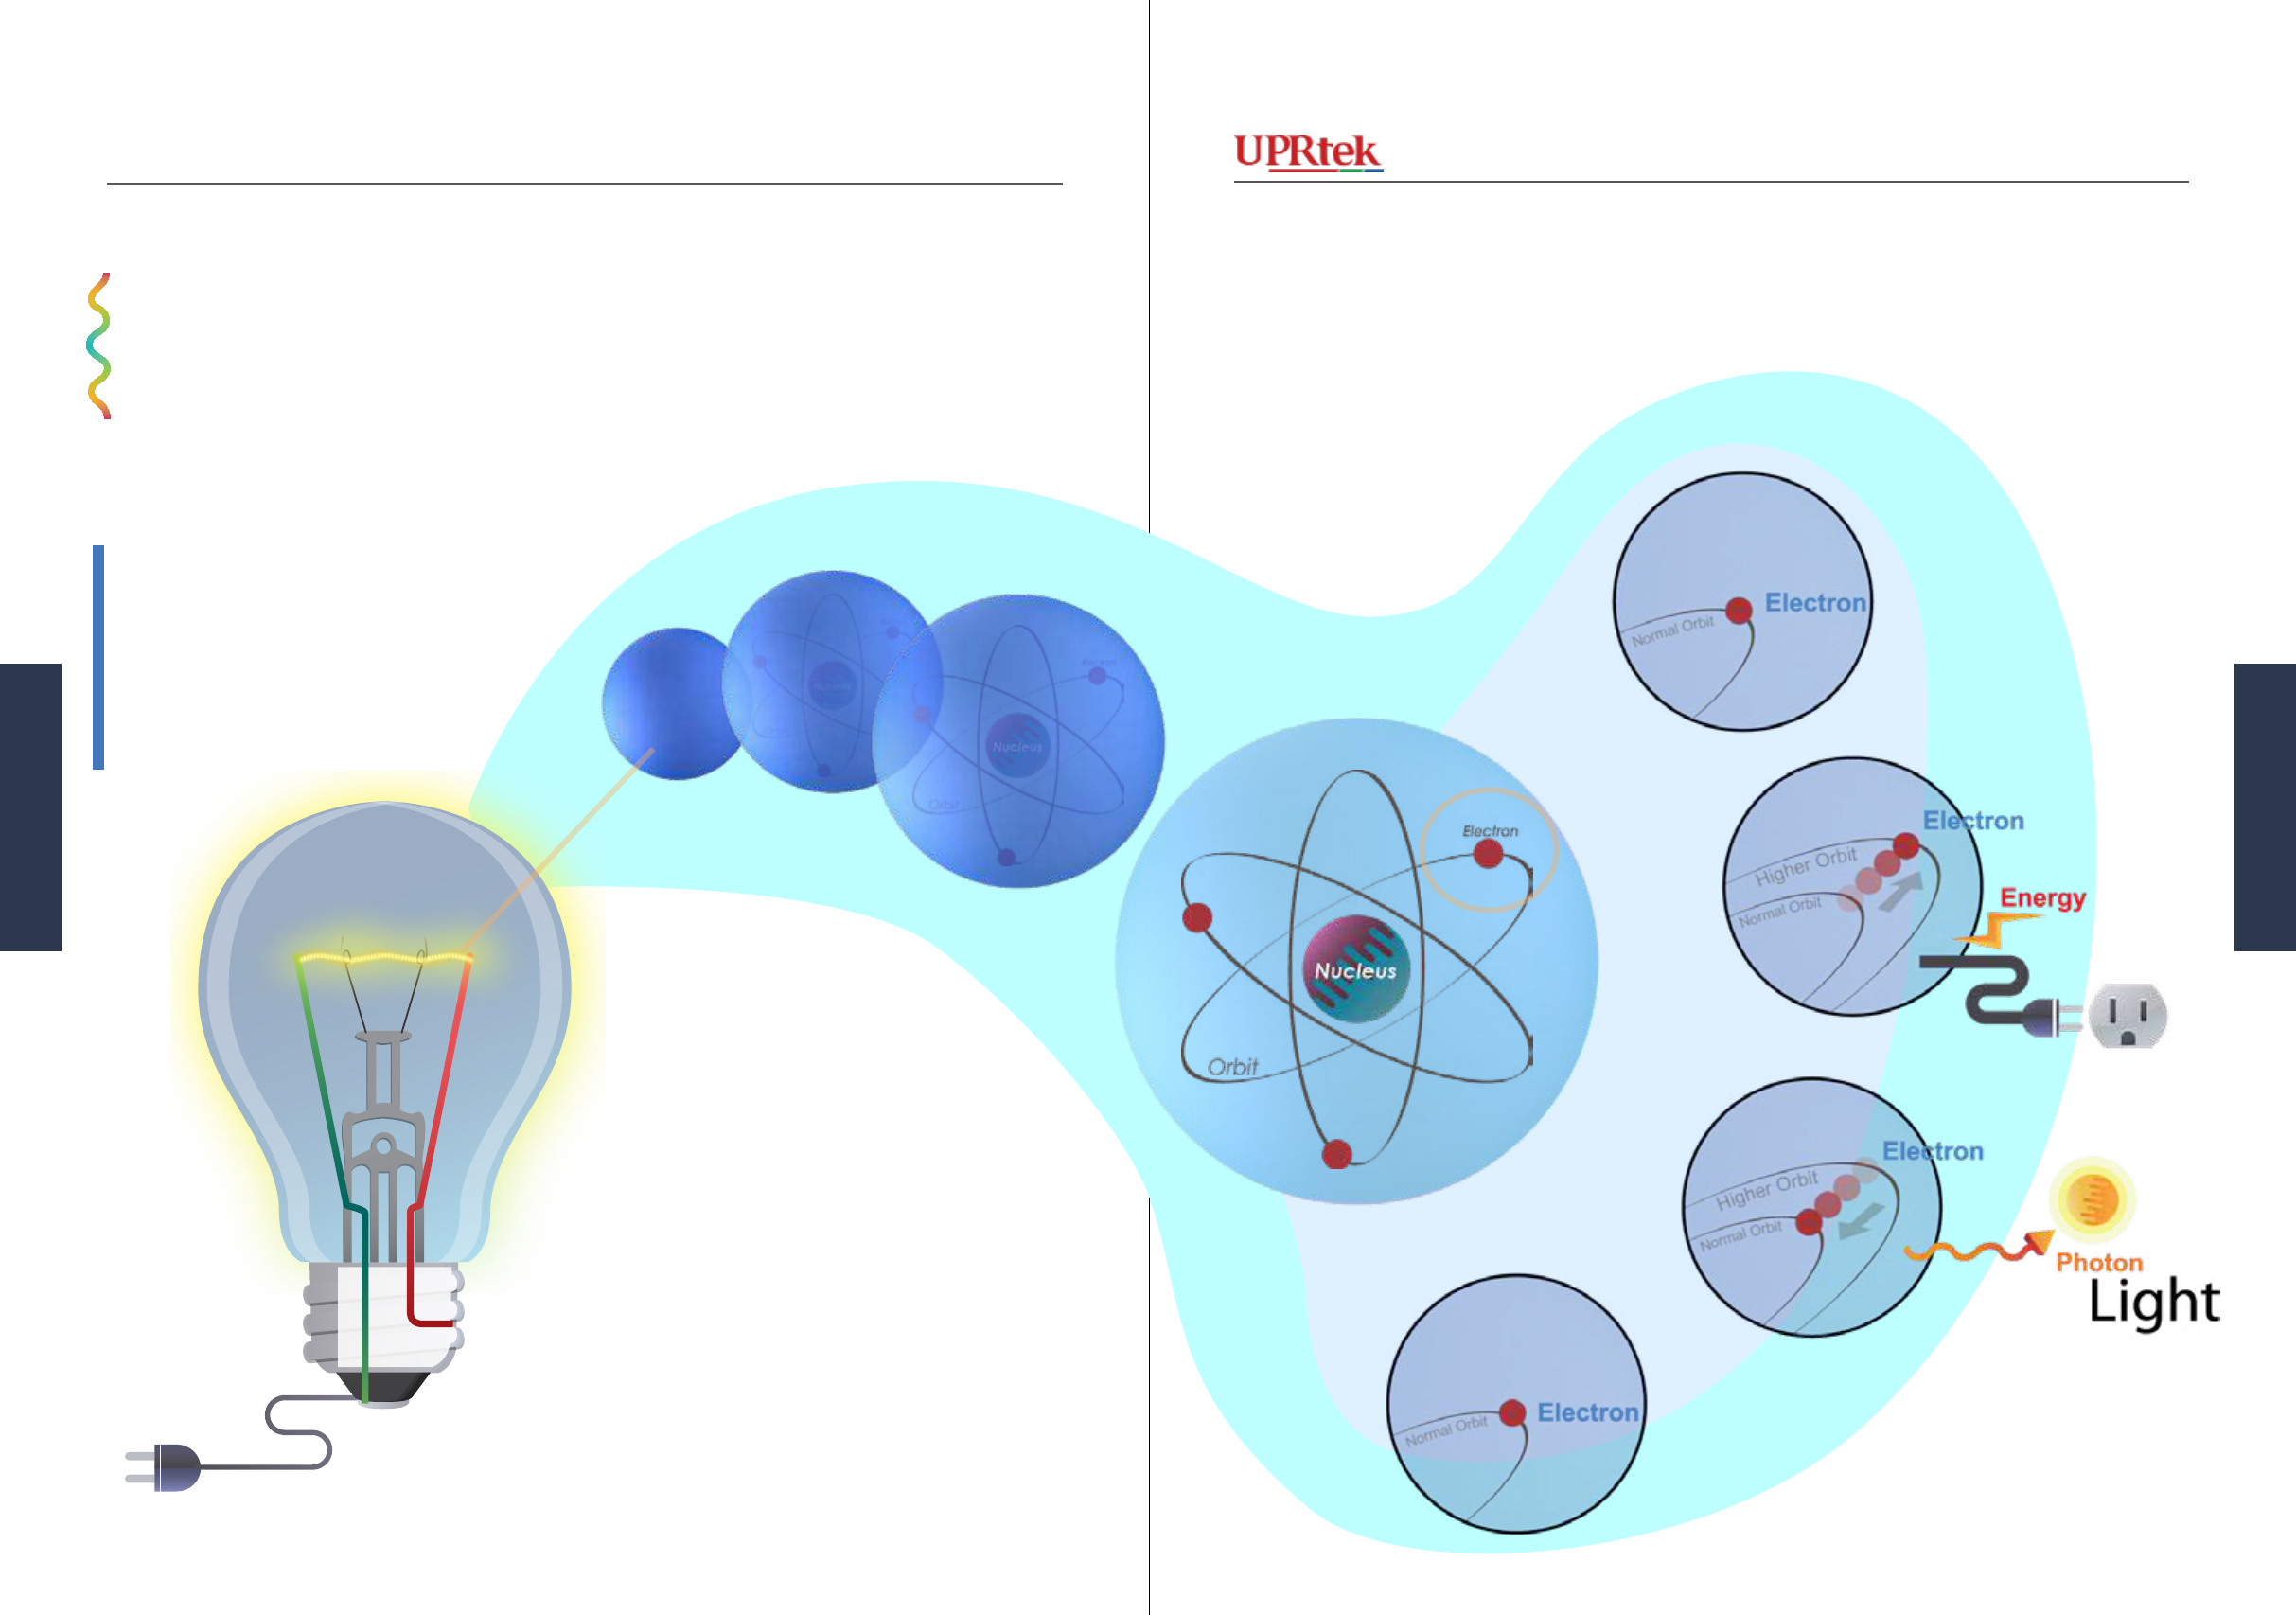
Inside an Incandescent bulb, electricity
is used to heat up the Tungsten Filament.
The electrons in the Tungsten Filament
begin to jump out to a higher energy orbit
for an instance and then drop back to its
natural orbit, releasing light.
Electrons are the Key
How does an Incandescent Bulb make light?
Tungsten Molecule
2524 MK350 Series Survival Handbook
Light
Light
Version 20140410b - Not for distribution - © Copyright 2014 UPRtek All rights reserved
Versio 20140410b - Not for distribution - © Copyright 2014 UPRtek All rights reserved
How a Fluorescent Light makes Light
1.Electricity warms the tube.
2.Mercury turns to vapor.
3.Vapor excited by further electric-
ity and UV light is emitted.
4.UV light hits the inside surface
of tube, which is coated with Phos-
phor material, which then glows
(emits light) - Using light (UV
light) to make light (visible light).
How does a Fluorescent Light makes light?
UV Light
H
i
g
h
e
r
O
r
b
i
t
Electron
Electron
N
o
r
m
a
l
O
r
b
i
t
H
i
g
h
e
r
O
r
b
i
t
N
o
r
m
a
l
O
r
b
i
t
Visible Light
H
i
g
h
e
r
O
r
b
i
t
Electron
Electron
N
o
r
m
a
l
O
r
b
i
t
H
i
g
h
e
r
O
r
b
i
t
N
o
r
m
a
l
O
r
b
i
t
Mercury Vapor Atoms
Phospor Atoms
UV Light
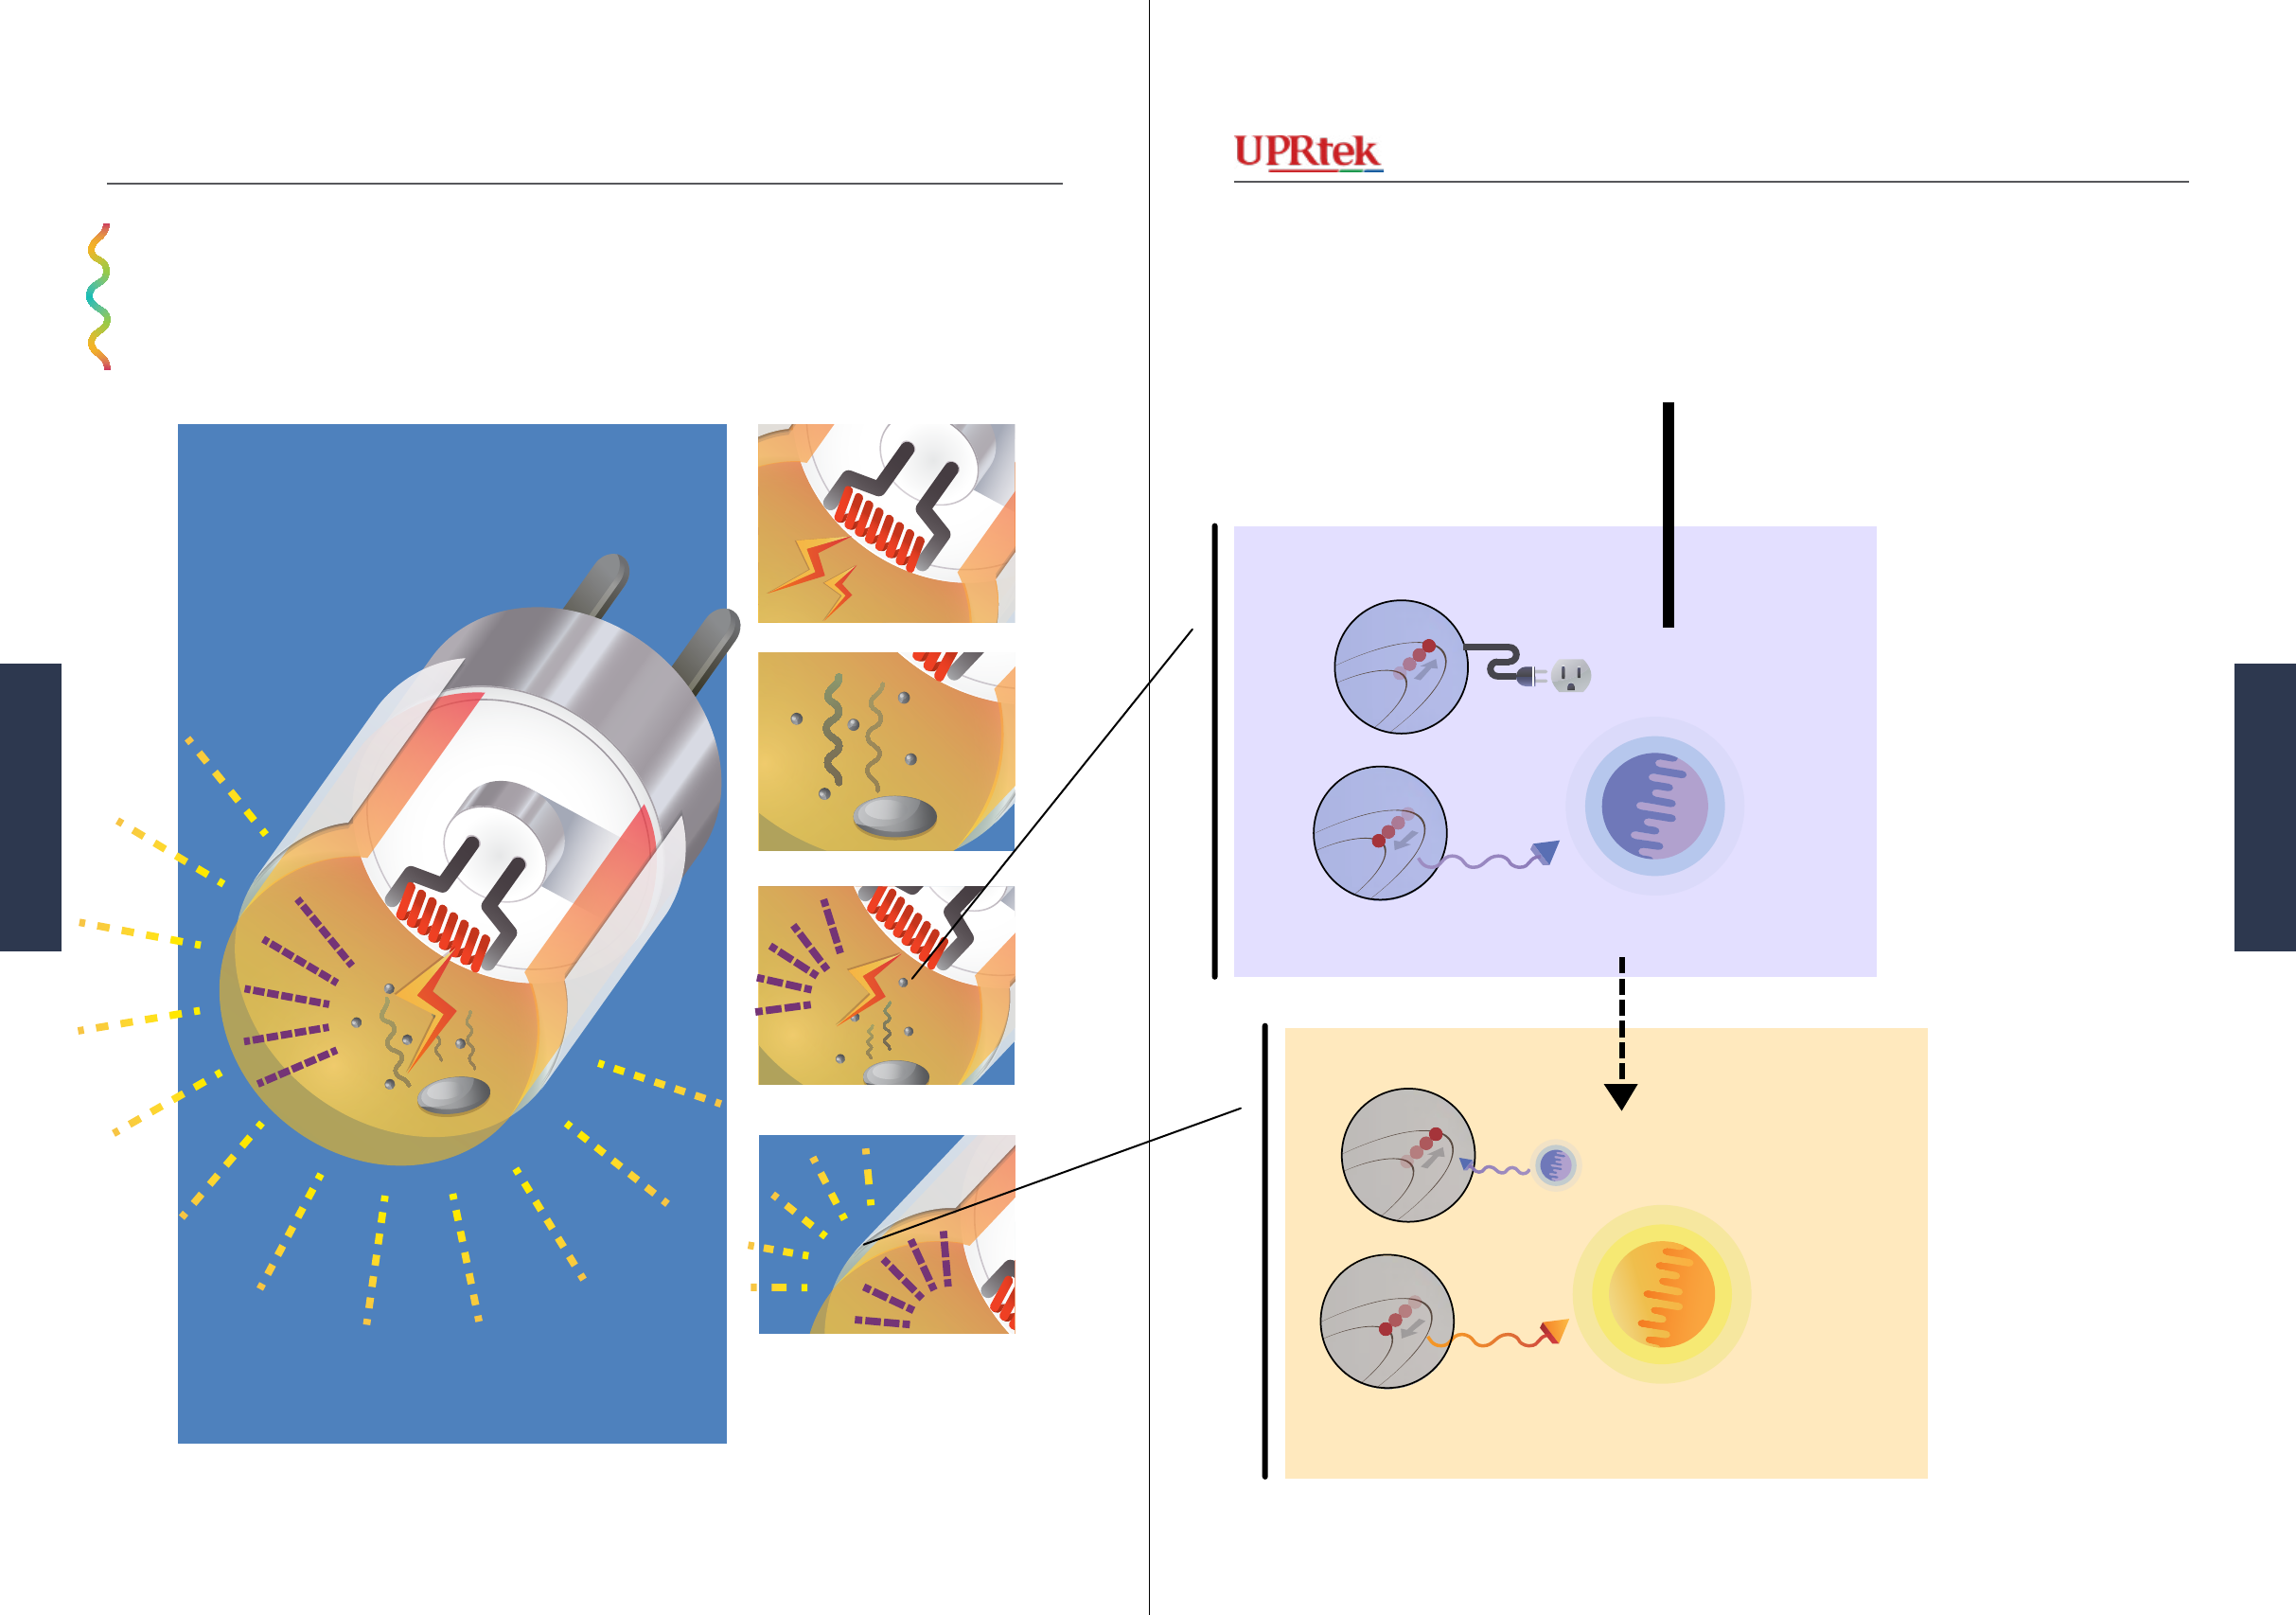
As we mentioned, a Fluorescent Light makes light in
two separate steps; electricity causes mercury vapor
to emit UV light, the UV light strikes the Phosphor
inner lining and causes the Phosphor to emit visible
light. In both cases, the same mechanisms of Ener-
gy-Atom-Electron-Photon are in effect.
2726 MK350 Series Survival Handbook
Light
Light
Version 20140410b - Not for distribution - © Copyright 2014 UPRtek All rights reserved
Versio 20140410b - Not for distribution - © Copyright 2014 UPRtek All rights reserved
2
1
3
Energy
How does
an LED make light?
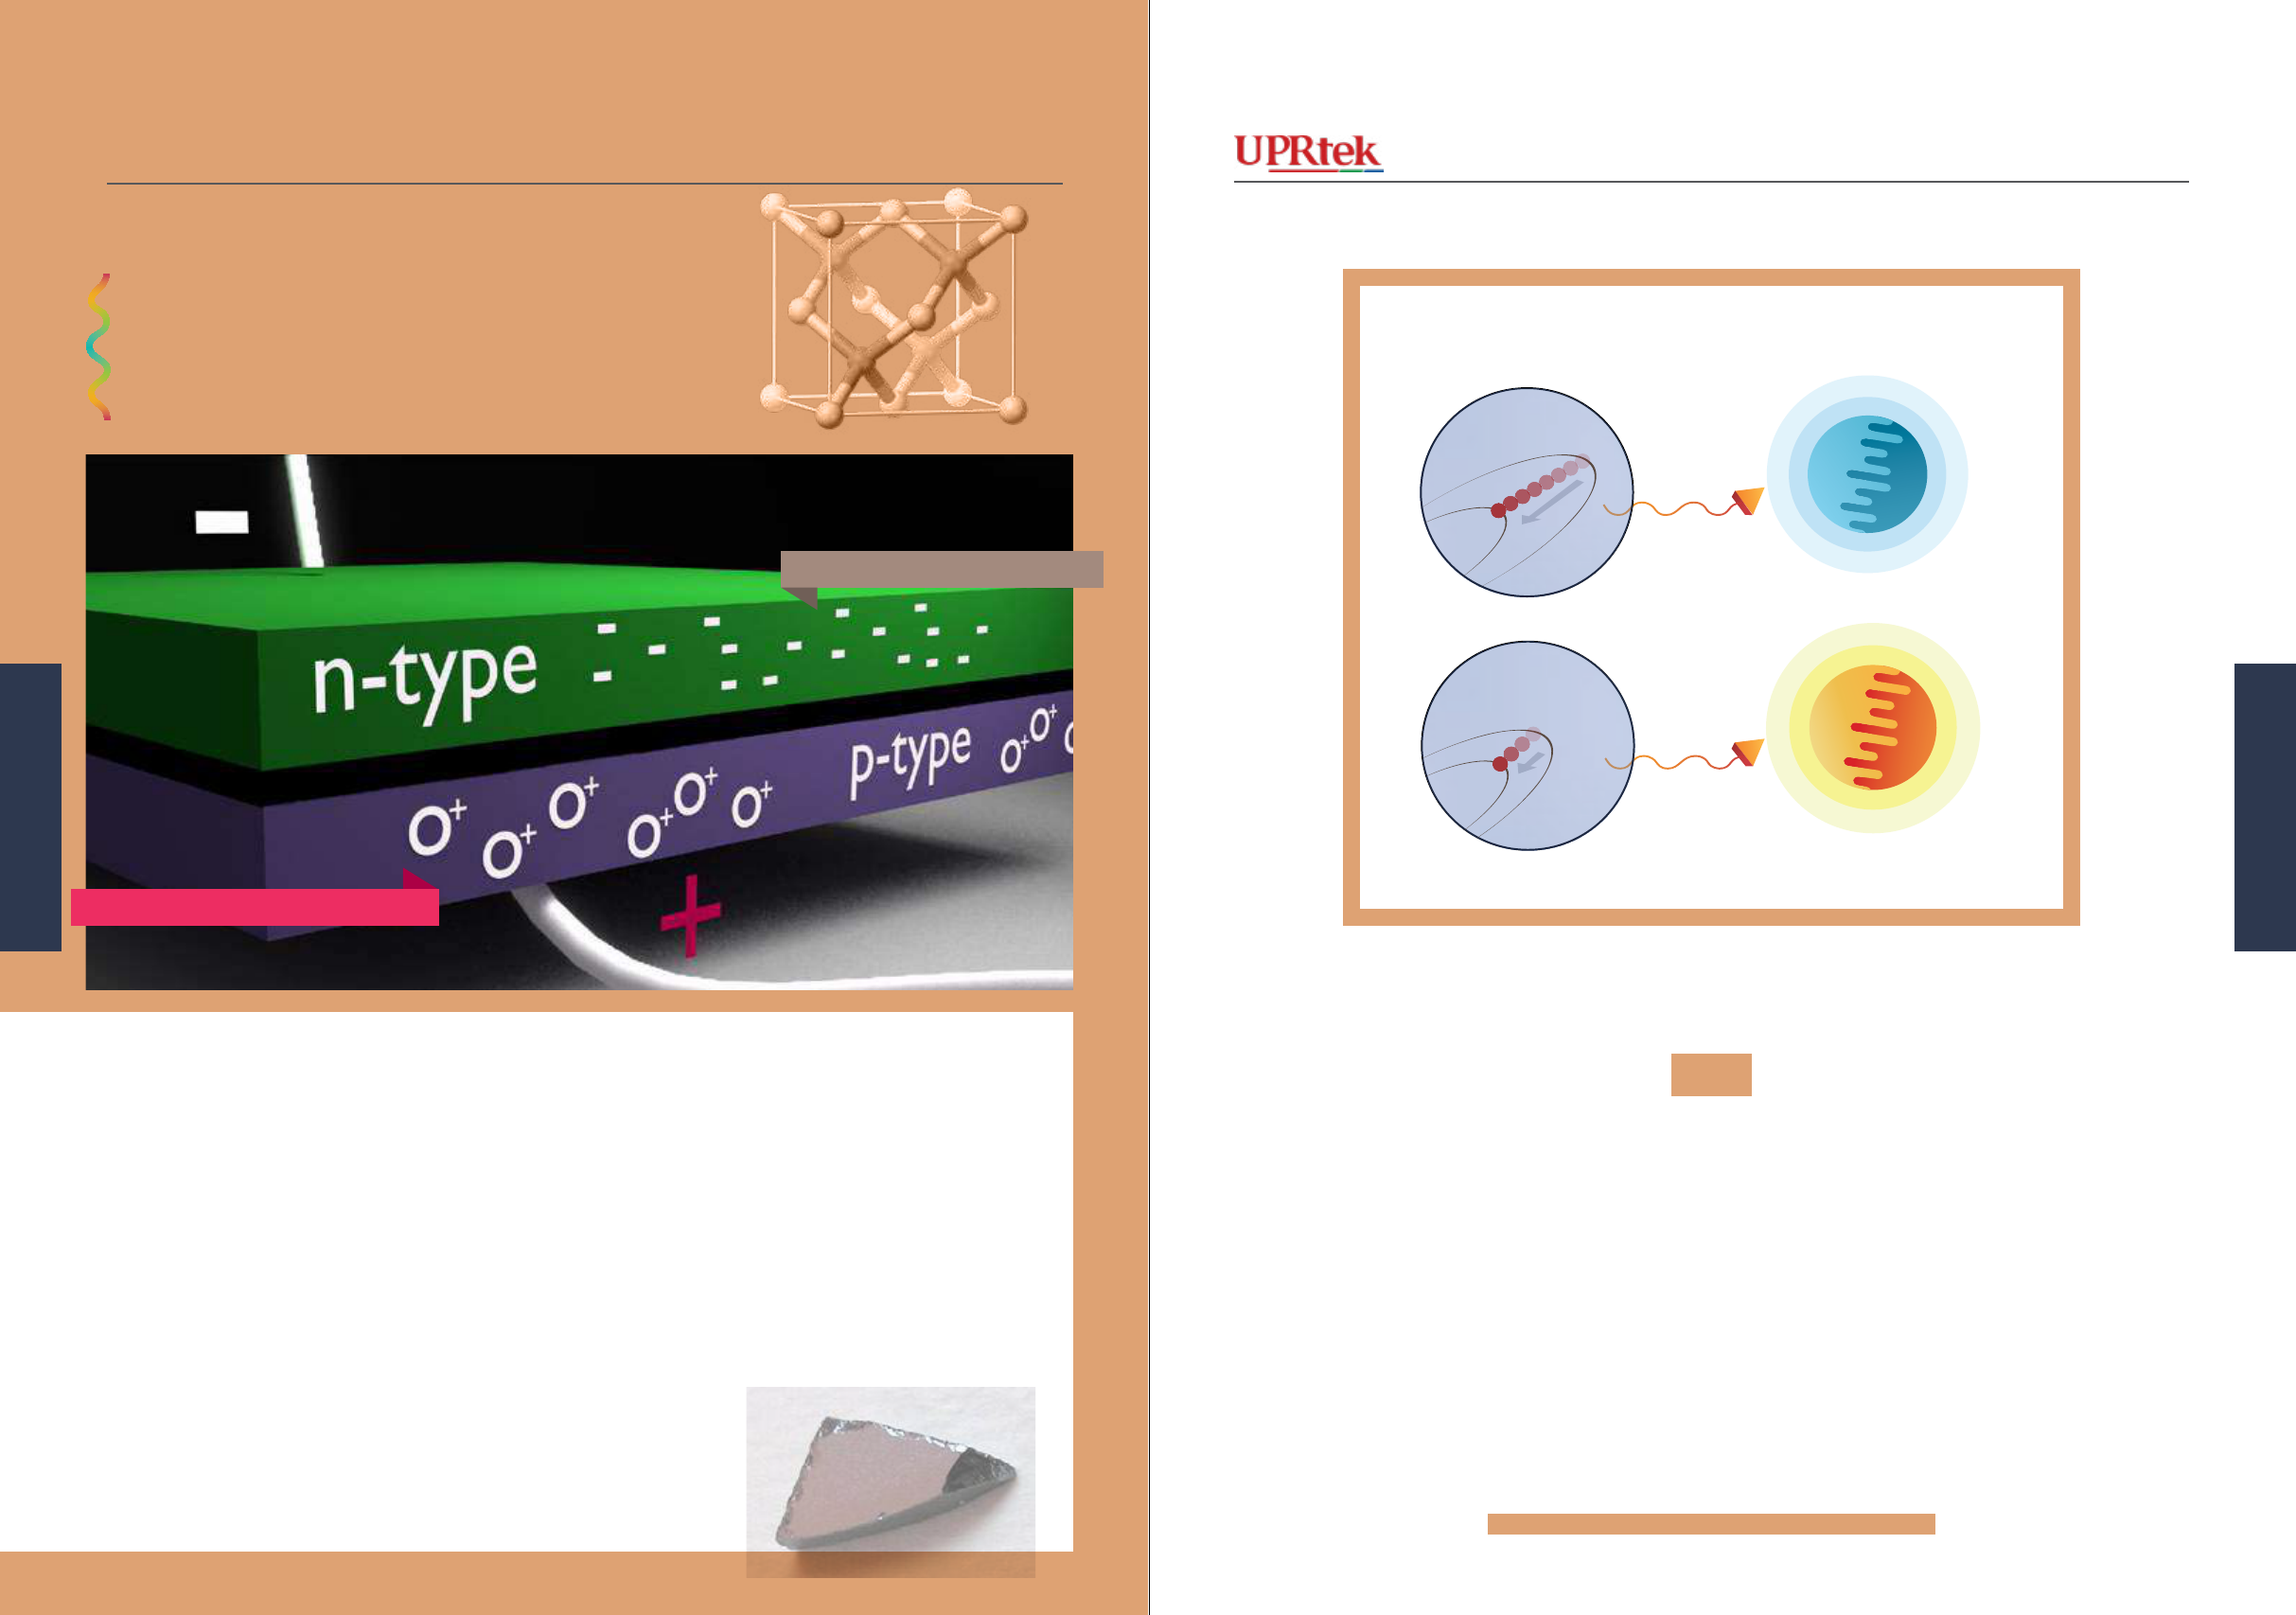
Electron movement in Semiconductors
As we saw on the previous page, electrons at higher orbits
that drop back to lower orbits, release photons of light. In
LED semiconductors, a similar strategy is at work.
Electrons jump from higher energy states to lower energy
states.
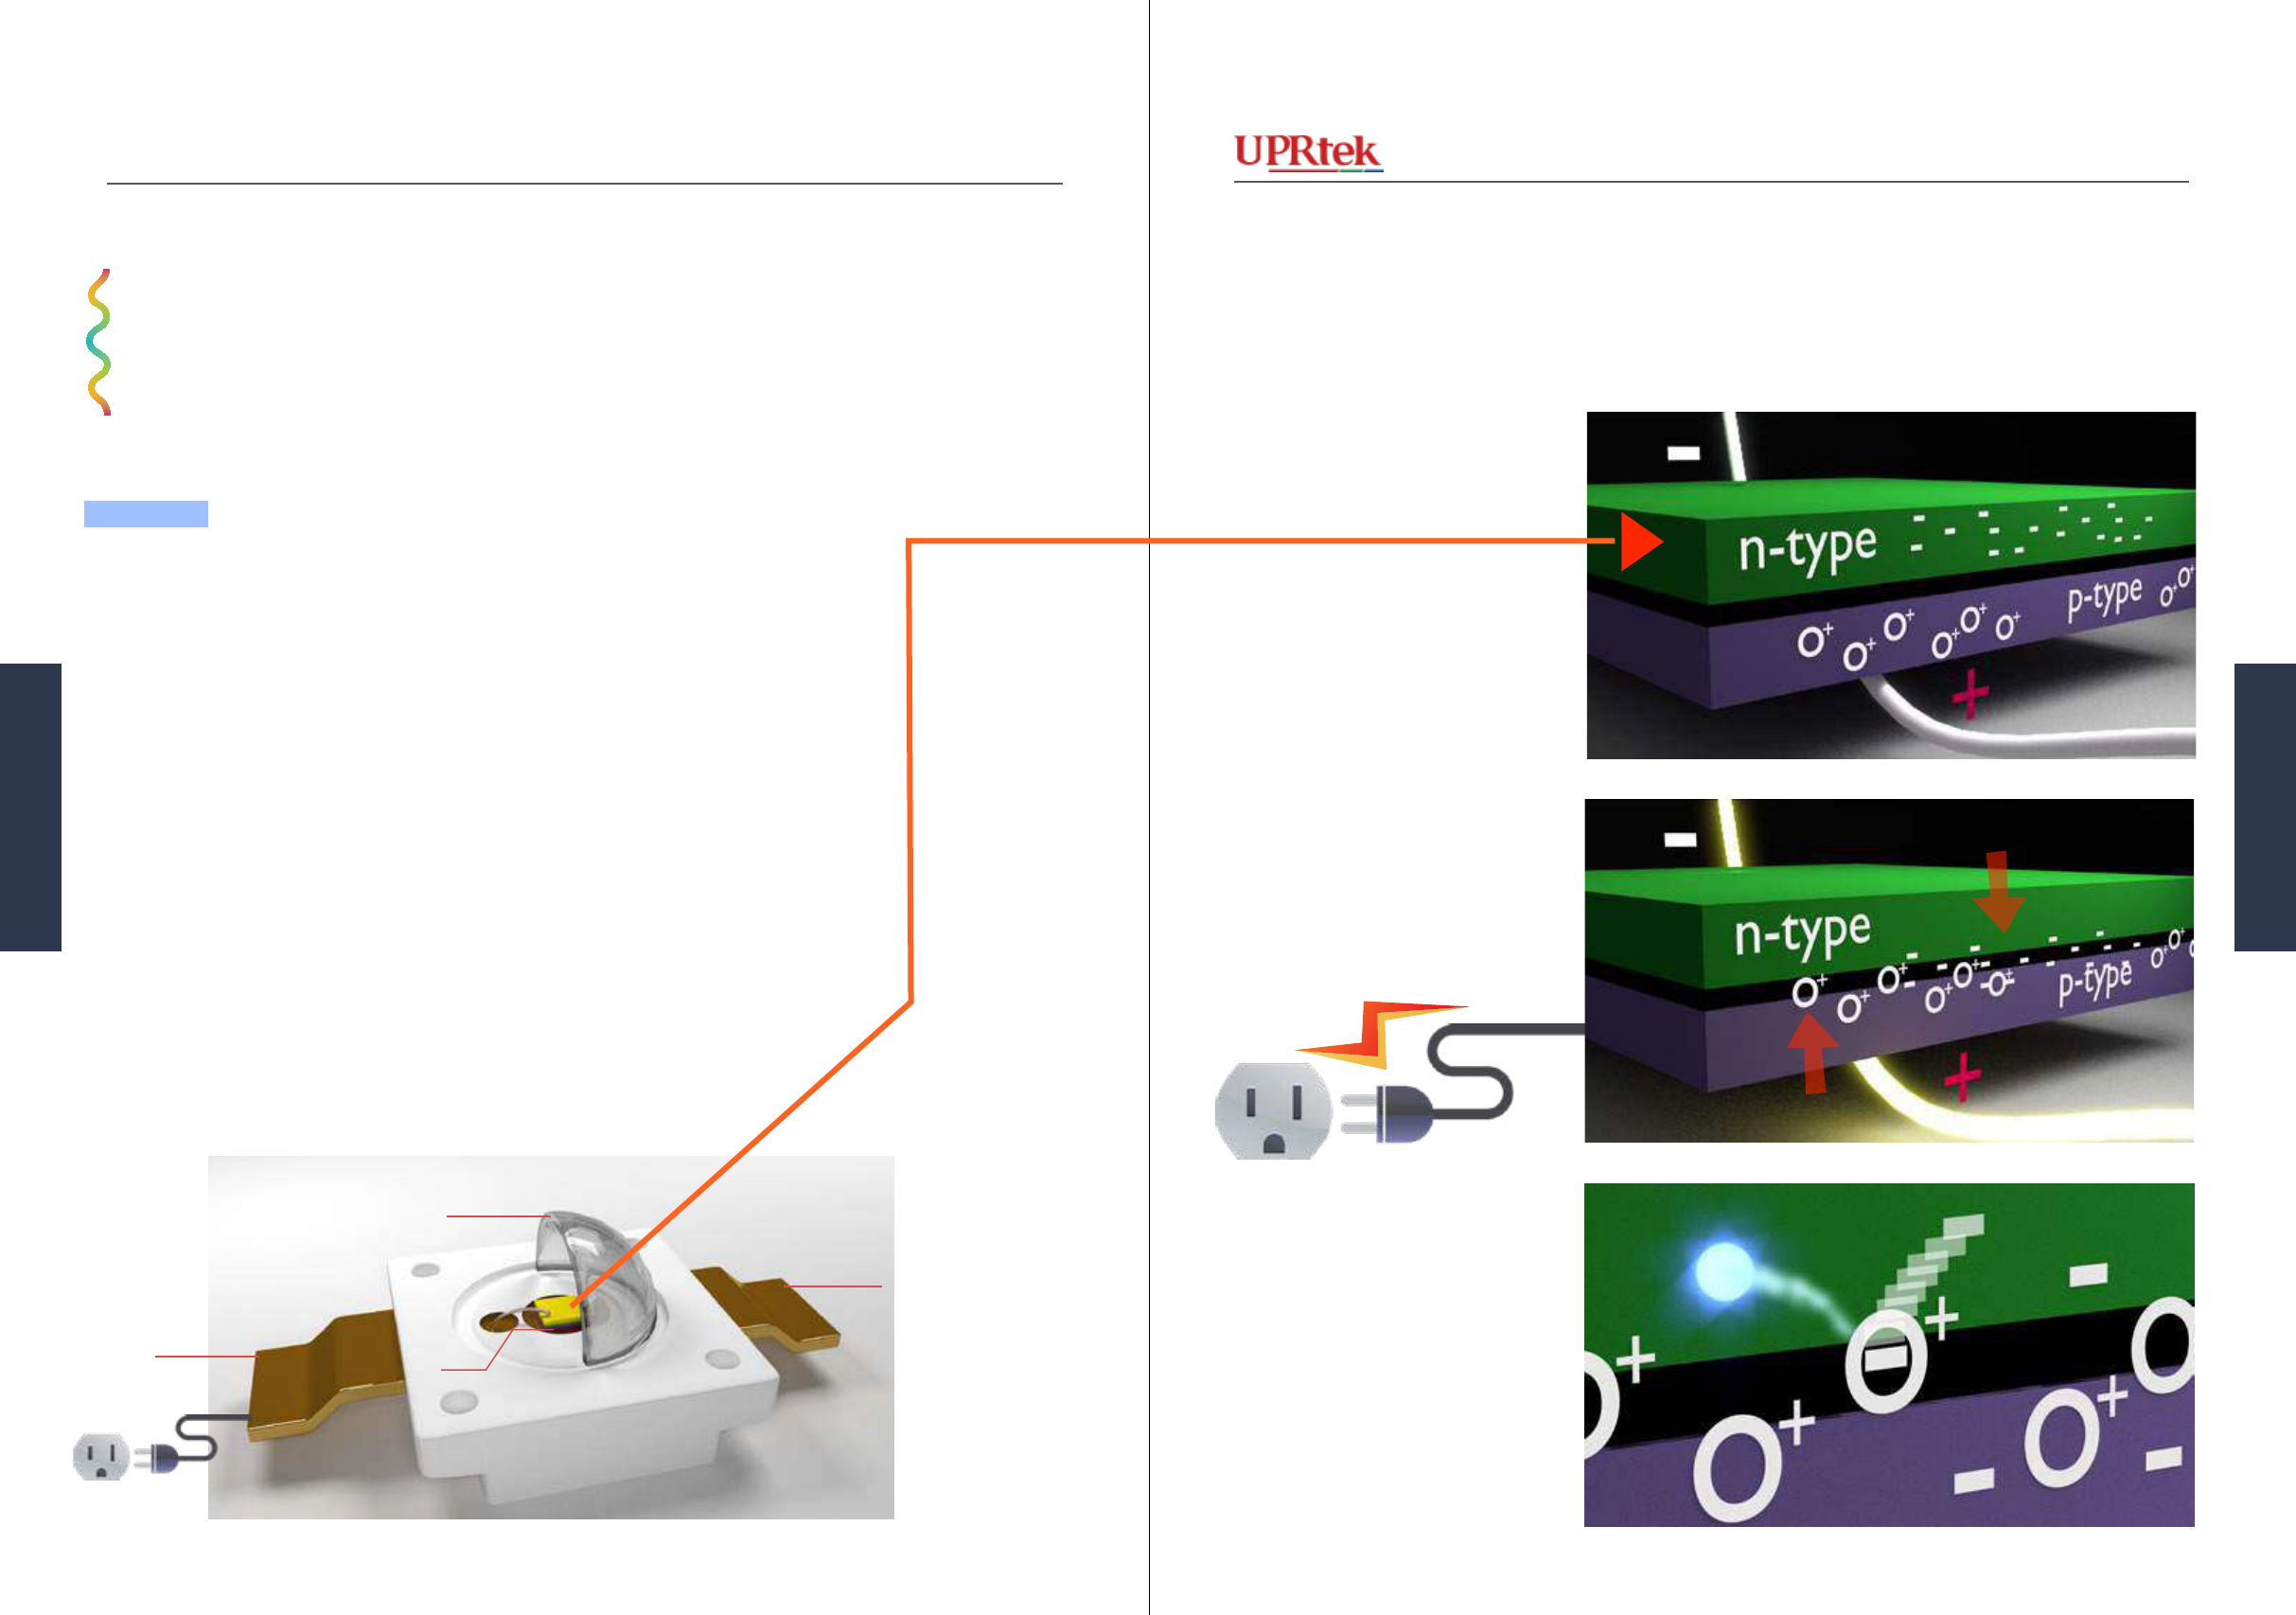
LED semiconductors have two layers. The top semiconductor
layer, called n-type, is modied to have extra free electrons.
The bottom layer, called p-type, is also modied, but to have
positively charged “electron holes” (but not really “holes”,
more like pockets), which can attract free electrons.
When current is passed through these two layers, the elec-
trons and holes move toward each other - when an electron
is close enough to a hole, it falls into it, going from a high
energy state to a low state (hole) and as we already know,
this releases a photon.
Negative free electrons in n-type layer
and positive holes in p-type layer are in a
steady state.
Current is applied from top to bottom - the
positive holes moves toward the negative
pole of current, electrons move toward the
positive pole.
As an electron (at a higher energy state)
passes a hole, it falls into it (lower energy
state). The release of energy emits a pho-
ton of bluish color.
Electrons are the Key
Cathode
Die
Lens
Anode
How does an LED make light?
www.youtube.com/watch?v=BH9LI973H8w
Watch a Video
2928 MK350 Series Survival Handbook
Light
Light
Version 20140410b - Not for distribution - © Copyright 2014 UPRtek All rights reserved
Versio 20140410b - Not for distribution - © Copyright 2014 UPRtek All rights reserved
Fluorescent Yellow
Fluorescent Yellow
Different materials used for the semiconductor will produce different wavelengths of light -
however, if LEDs use AsGaAl, the resulting light will be bluish, which would not fare well as
a white light. So, on top of this type of semiconductor you will nd a yellow lm. This lm is
made from a Yellow Fluorescent Powder - but don’t think of it as just a lter - it makes light by
itself. If you remember how Fluorescent Lights work - they use UV light to make light. It’s the
similar process with LEDs.
1
2
This blue light causes the electrons in the Fluorescent Layer to move to
a higher orbit. When the Fluorescent electrons return to a normal orbit,
a yellow photon (light) is emitted. The blue light is still transmitted
through the lm, but mixes with the yellow light to produce a white
light (we’ll talk more about mixing lights later).
Fluorescent Layer
LED chip
Lens
Fluorescent Layer
Resulng White Light
Semiconductor
Fluorescent Film
Energy causes the semiconductor electrons to emit blue light.
1. The blue light, emitted from the semiconductor, excites the electrons in the Fluorescent
lm to a higher orbit. The electrons then return to their natural orbit, emitting a yellow
light.
2. This yellow light mixes with the blue light (which still is coming from the semiconduc-
tor) to make white light - this process is called “color mixing”, which we will talk about
later.
Blue + Yellow = White
Fluorescent Yellow
3130 MK350 Series Survival Handbook
Light
Light
Version 20140410b - Not for distribution - © Copyright 2014 UPRtek All rights reserved
Versio 20140410b - Not for distribution - © Copyright 2014 UPRtek All rights reserved
Why LEDs
A suitable material
for LEDs
Early experiments (around
1955) found that low levels of
infrared light could be detect-
ed when running an electrical
current through Gallium Arse-
nide, a semiconductor material.
Throughout the years, other
materials have also been added
(e.g. Nitrides, Aluminum) to
further upgrade the viability of
semiconductors as a practical
LED light source
Doping can add free electrons
Doping can add more Electron Holes
Why is the Semiconductor light blue?
LED semiconductors are known to produce a blu-
ish light. The color of light from any atom de-
pends on how far the electron falls from its higher
energy state - the farther the fall, the more ener-
gy released and the higher the frequency of light
(low frequency = more reds, higher frequencies =
more blue). Aside from AlGaAs, other materials
such as Indium, Phosphide, Nitrides, Silicon, are
used because their molecular structure can pro-
duce other colors of light.
More Red
Electron
More Blue
Electron
H
i
g
h
e
r
O
r
b
i
t
N
o
r
m
a
l
O
r
b
i
t
H
i
g
h
e
r
O
r
b
i
t
N
o
r
m
a
l
O
r
b
i
t
The Rubber Band Experiment - Pull a rubber band apart and let go of one
end - notice the sound of the snap. Now pull a rubber band farther apart and let go,
and notice the louder sound (ouch!). The farther apart means more energy released.
use Semiconductors?
Perfecting LEDs
Actually, pure AlGaAs is a poor
conductor of electricity - how-
ever, you can add impurities, a
process called “Doping”. Dop-
ing adds more free electrons
to the semiconductor material
(n-type). You can also use
Doping to create more electron
holes in the material (p-type).
This entire process of making
semiconductors is not always
an exact science, and the nal
product is not always predict-
able.
Why not use plastic?
Why not use wood, glass, cot-
ton or plastic? It’s because of
the molecular structure. In some
materials it is difcult to ma-
nipulate the electron because of
the electron’s attachment to its
nucleus - if you can’t move an
electron, you can’t create light
from it.
Molecular Structure Determines
Why LEDs use Semiconductors?
W. Oelen - CC-BY-SA 3.0 Unported Wikimedia
Commons
3332 MK350 Series Survival Handbook
Light
Light
Version 20140410b - Not for distribution - © Copyright 2014 UPRtek All rights reserved
Versio 20140410b - Not for distribution - © Copyright 2014 UPRtek All rights reserved
How does light work?
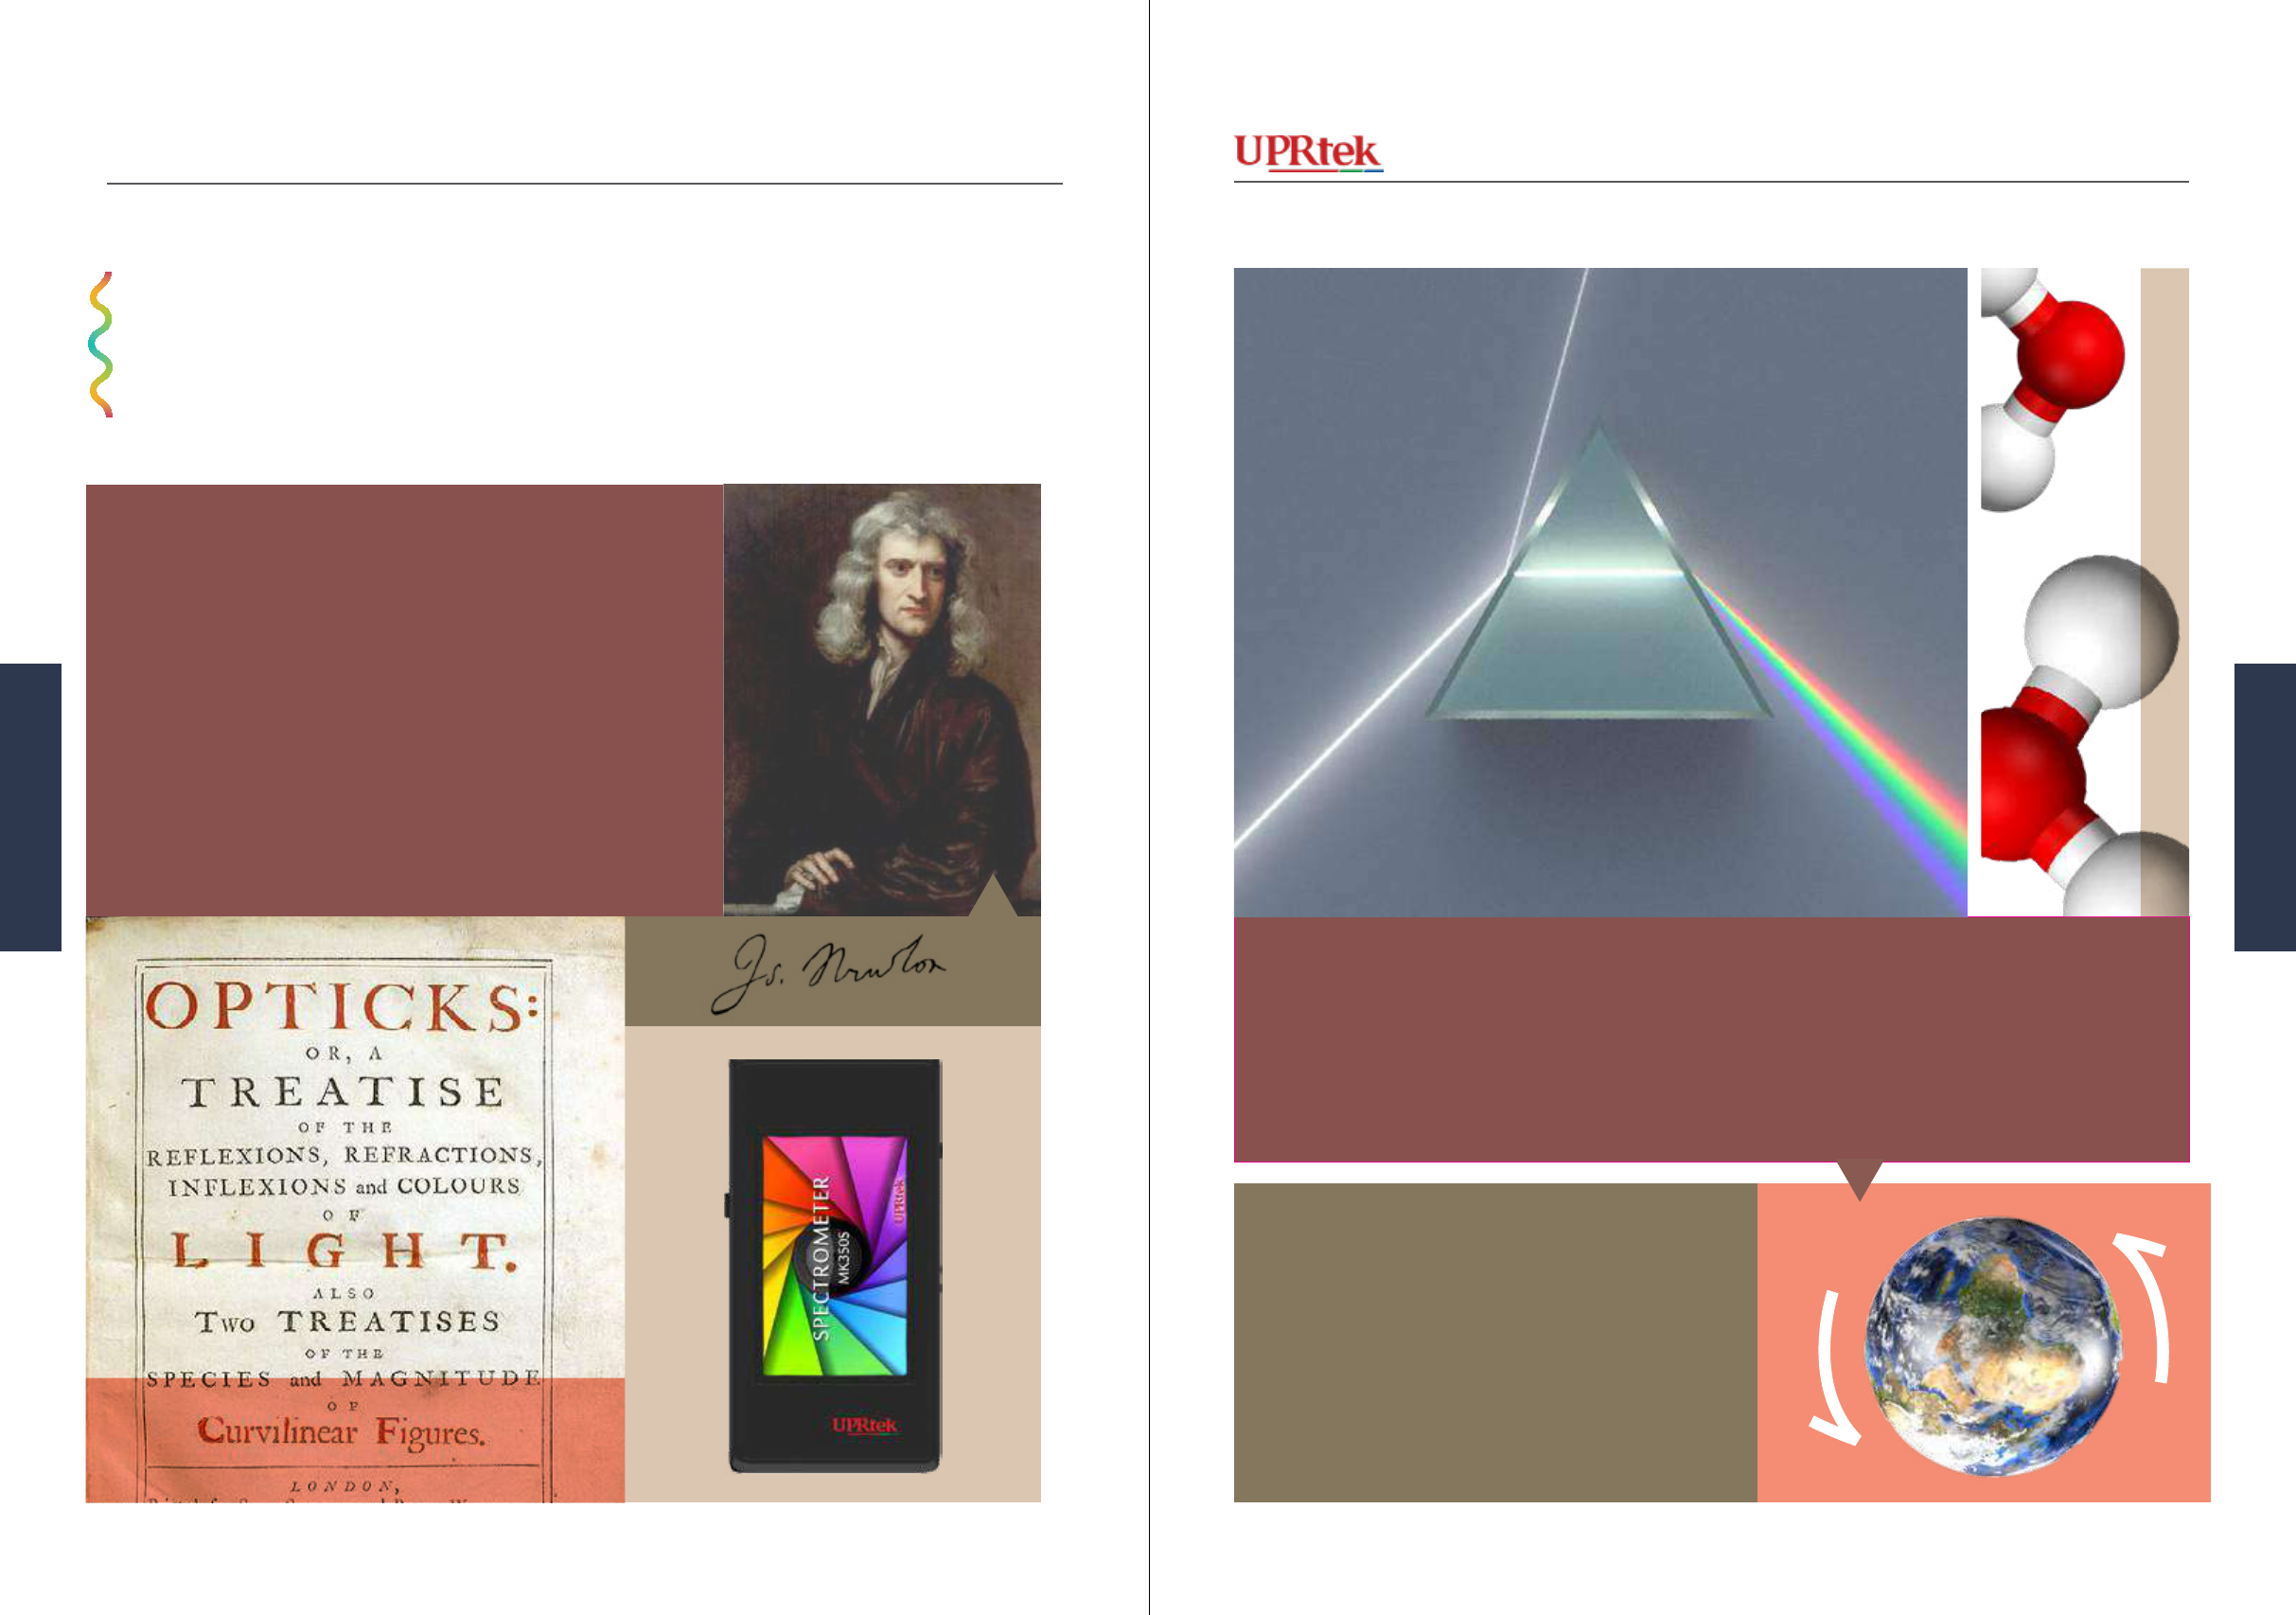
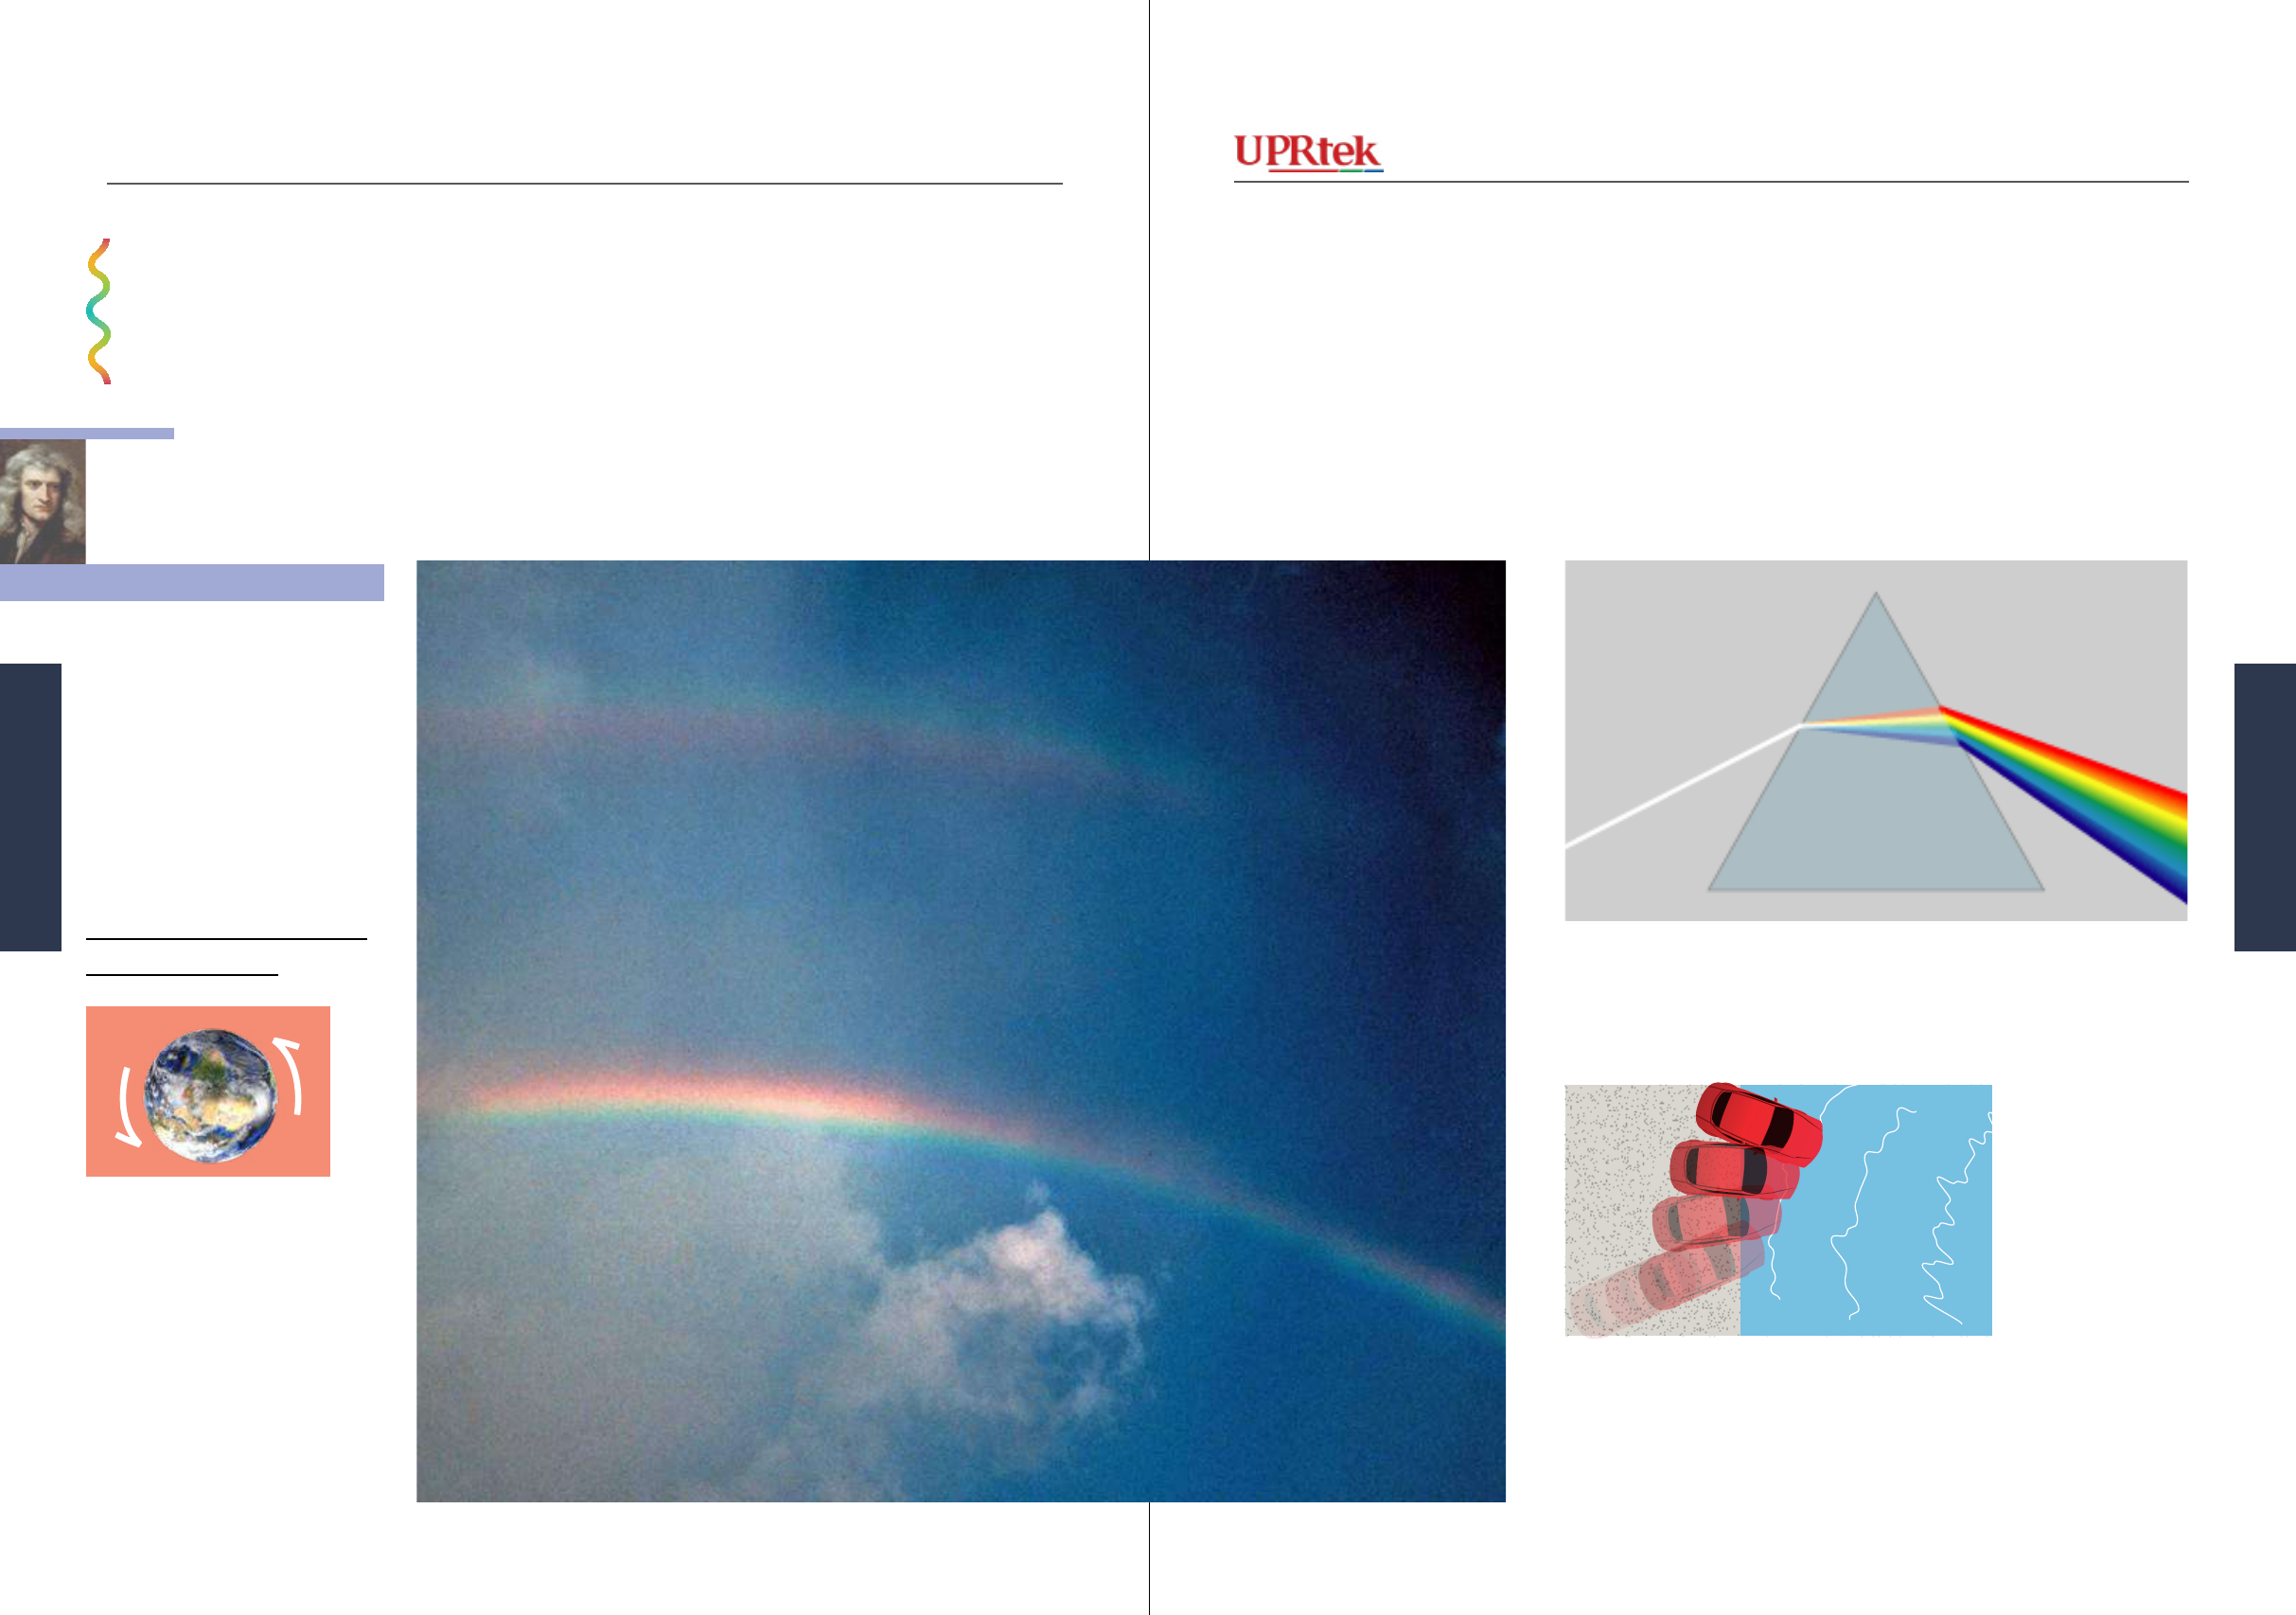
What is a Rainbow?
The rst famous experiment
was performed by Isaac New-
ton . Basically, he was able to
simulate the phenomenon of
rainbows and in doing so he
made an important discovery.
Light is made of many
different colors.
Newton pointed a light beam at
a prism. The light, as it went
through it, bent or refracted and
separated the light into different
colors. It basically proved that
light is made up of many colors.
In a rainbow, the clear rain
droplets act as small prisms,
also dispersing light into differ-
ent colors.
Refra
ction
Refraction or bending of light
occurs when light enters an-
other medium and slows down.
The light disperses (separates)
Why does light bend, as it passes
through a prism? Think of refrac-
tion as a car entering water at an
angle.
Weblars - Creative Commons Attribution-Share Alike 3.0 Unported - Wikimedia Commons
Two famous experiments ...
The right tire hits the water rst
while the left keeps going at the
same speed. The angle of the car
begins to turn or “bend”.
because of the different wave
frequencies of color bend at dif-
ferent angles (we will talk about
light waves later).
It’s Like
Famous
Experiment 1
Famous Experiment 1
How does light work?
3534 MK350 Series Survival Handbook
Light
Light

Agustin Ruiz CC-BY-2.0 Generic - Wikimedia Commons
Version 20140410b - Not for distribution - © Copyright 2014 UPRtek All rights reserved
Versio 20140410b - Not for distribution - © Copyright 2014 UPRtek All rights reserved
When you drop two stones (at a
distance) in a pond of water, two
rings of waves emanate from the
center of both drop-points. When
two wave peaks meet (red circles),
the resulting wave peak is a bigger
wave equal to the two wave peaks
added together. The interesting
part is that when the 2 waves pass
each other, they go back to their
original form.
In a more controlled two-slit exper-
iment, Young sent an initial water
wave through 2 slits on a front wall.
Two separate waves were created at
each slit opening. They interacted
with each other and eventually hit
another back wall. When the waves
interacted they created super-sized
wave peaks where they intersected -
these high wave peaks impacted the
back wall at the same place creating
bands of force with each band rep-
resenting the intersection of the two
waves. This is how water waves
work.
Back Wall
Two slits
Front Wall
Initial wave
Maximum Force Bands
Famous
Experiment 2
?
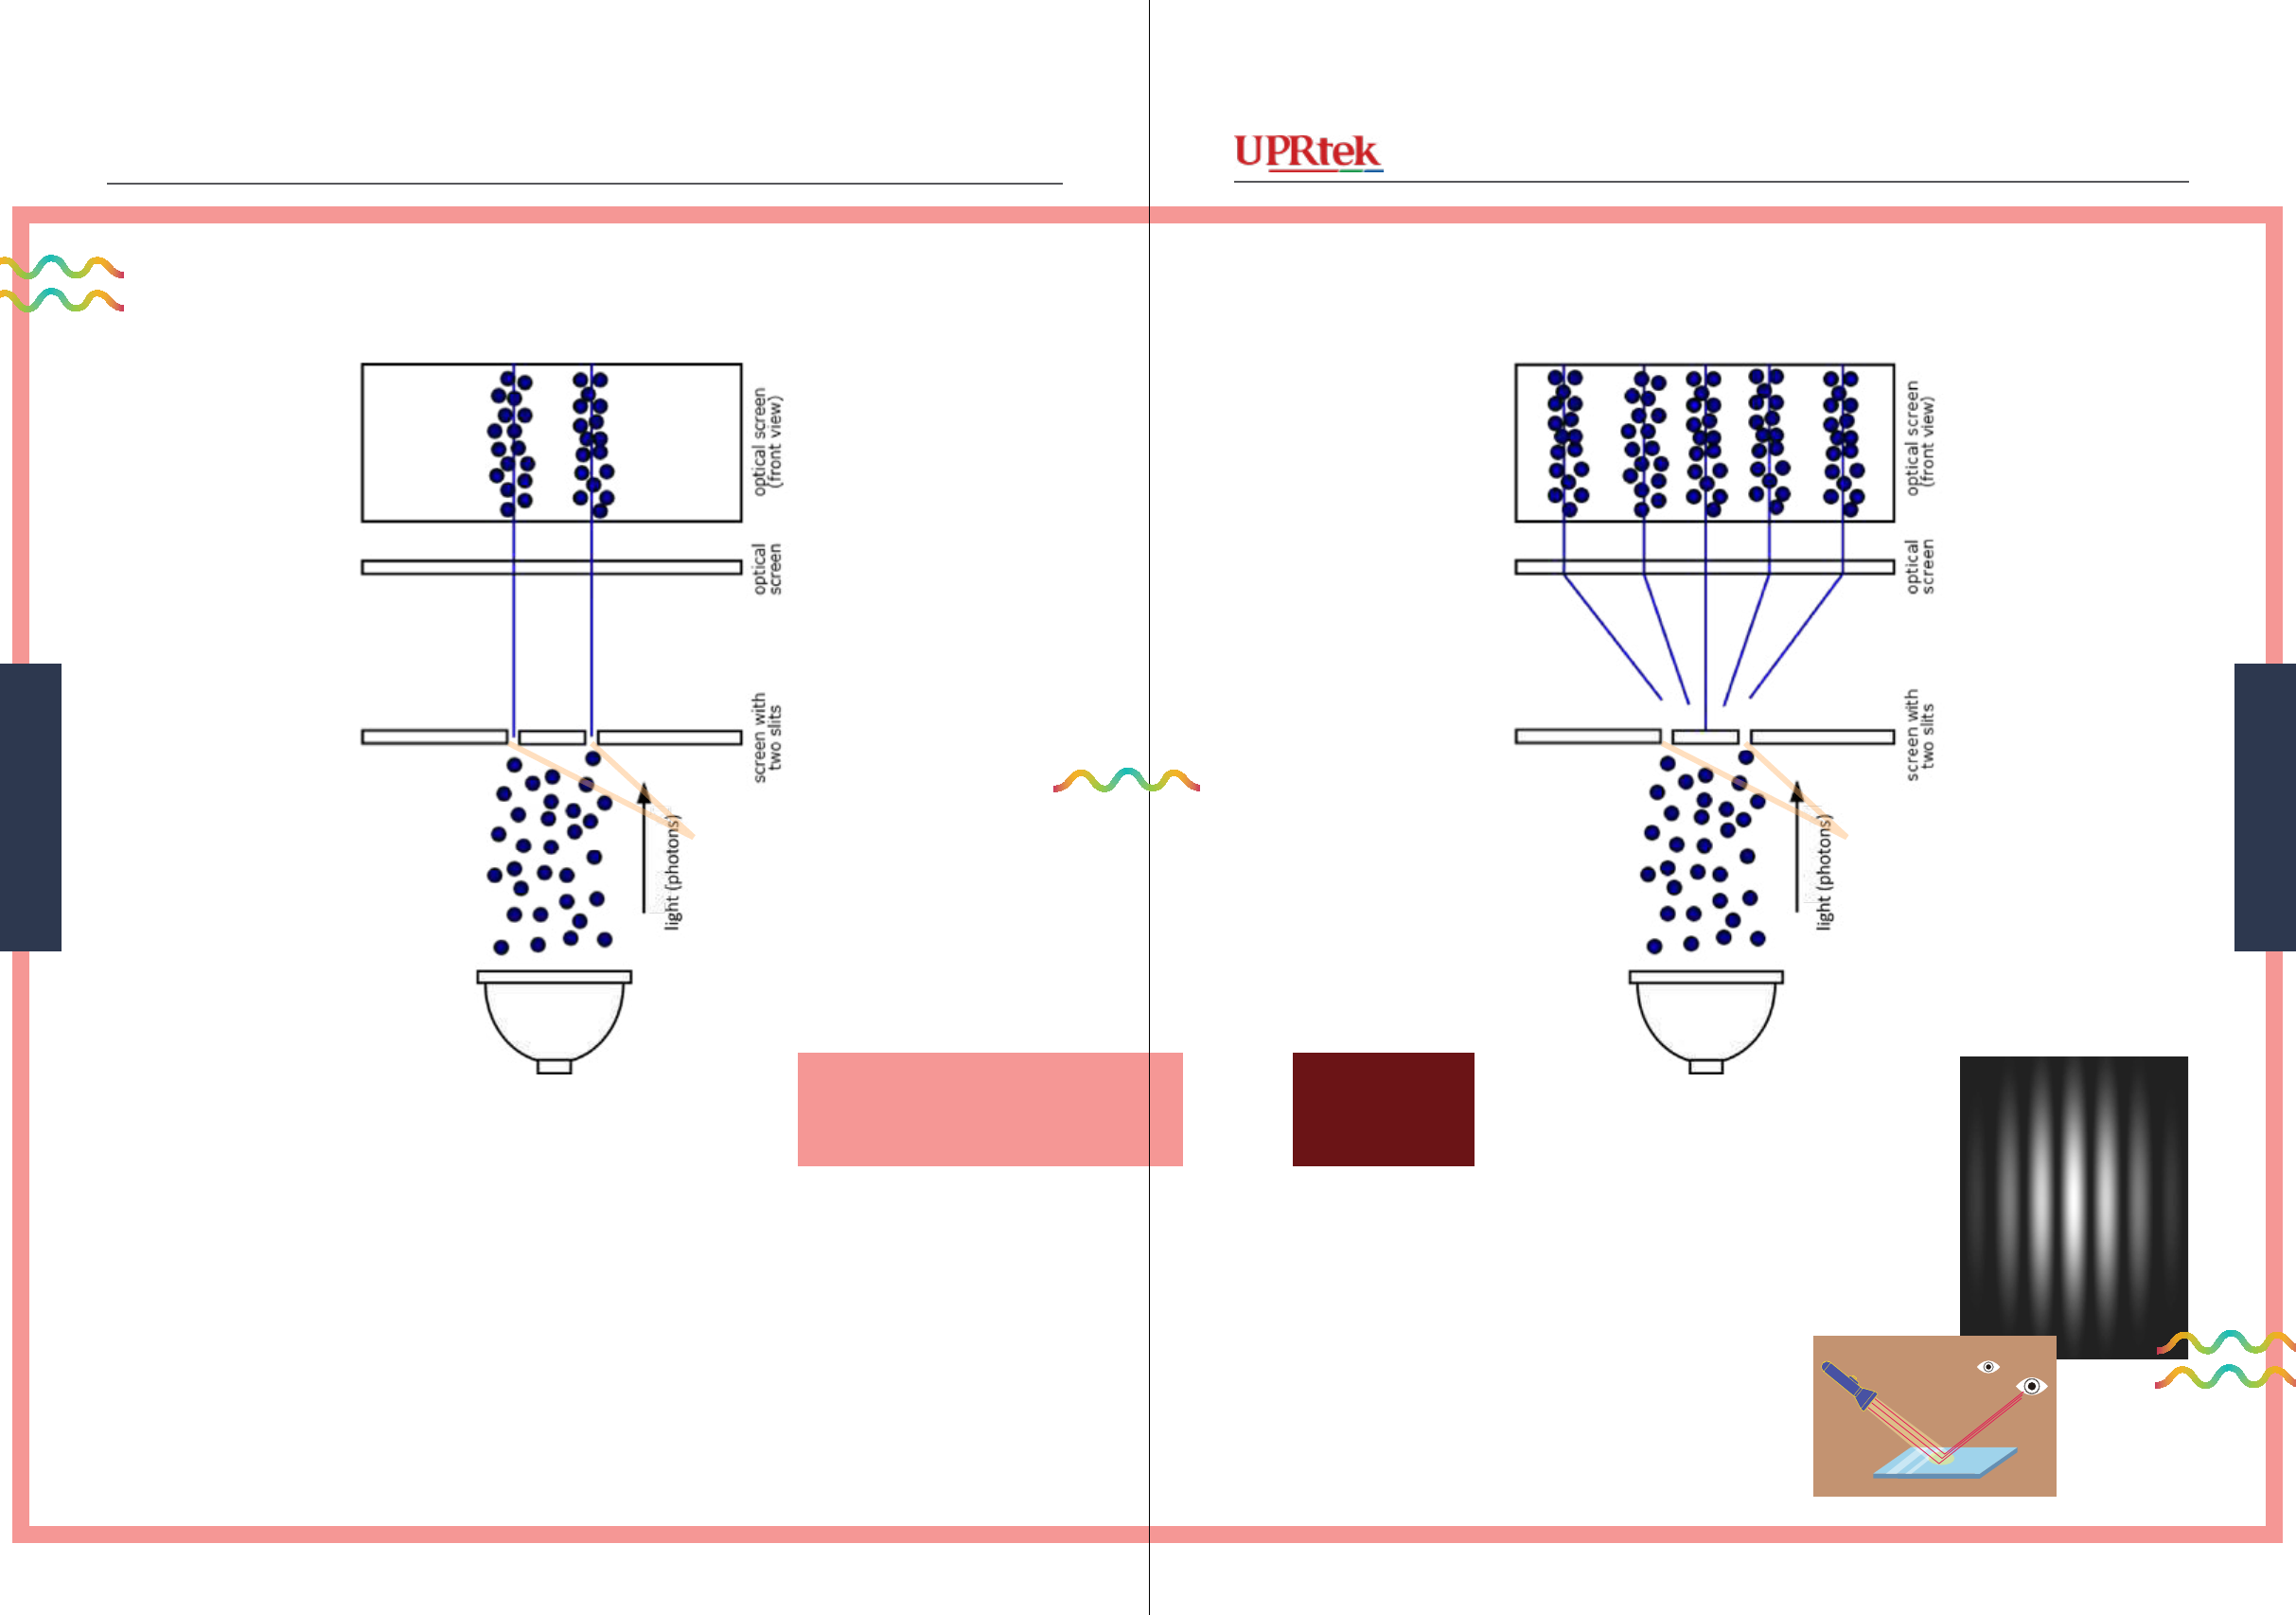
Early researchers were fairly
certain that light was made of
particles, because of the way
that light bounces off of things
like walls or even mirrors - like
a ball.
However, a famous experiment
called the Double-Slit Experi-
ment was performed by Thomas
Young in the early 1800s. It
proved that ...
Light also behaves like
waves.
Young understood how water
waves worked. Let’s look at the
stones-in-a-pond example.
Is Light particles or waves?
Famous Experiment 2
3736 MK350 Series Survival Handbook
Light
Light
Version 20140410b - Not for distribution - © Copyright 2014 UPRtek All rights reserved
Versio 20140410b - Not for distribution - © Copyright 2014 UPRtek All rights reserved
Let’s try the same idea using light.
Since we think that light is particles, we
can expect the photon particles to hit
the back wall with only two bands (as
shown above).
Back Wall
Two slits
Front Wall
Light Source
Maximum Force Bands
However, when Young tried this exper-
iment, to his surprise, he saw the same
wave banding against the wall - light
behaves like water waves too! He
couldn’t actually see “waves” of light,
however it was the result
that was convincing. So light
behaves both as particles and
waves!
Back Wall
Two slits
Front Wall
Light Source
Maximum Force Bands
What
We
Expected & Got
http://www.youtube.com/watch?v=DfPeprQ7oGc
Watch a Video
?
3938 MK350 Series Survival Handbook
Light
Light
Version 20140410b - Not for distribution - © Copyright 2014 UPRtek All rights reserved
Versio 20140410b - Not for distribution - © Copyright 2014 UPRtek All rights reserved
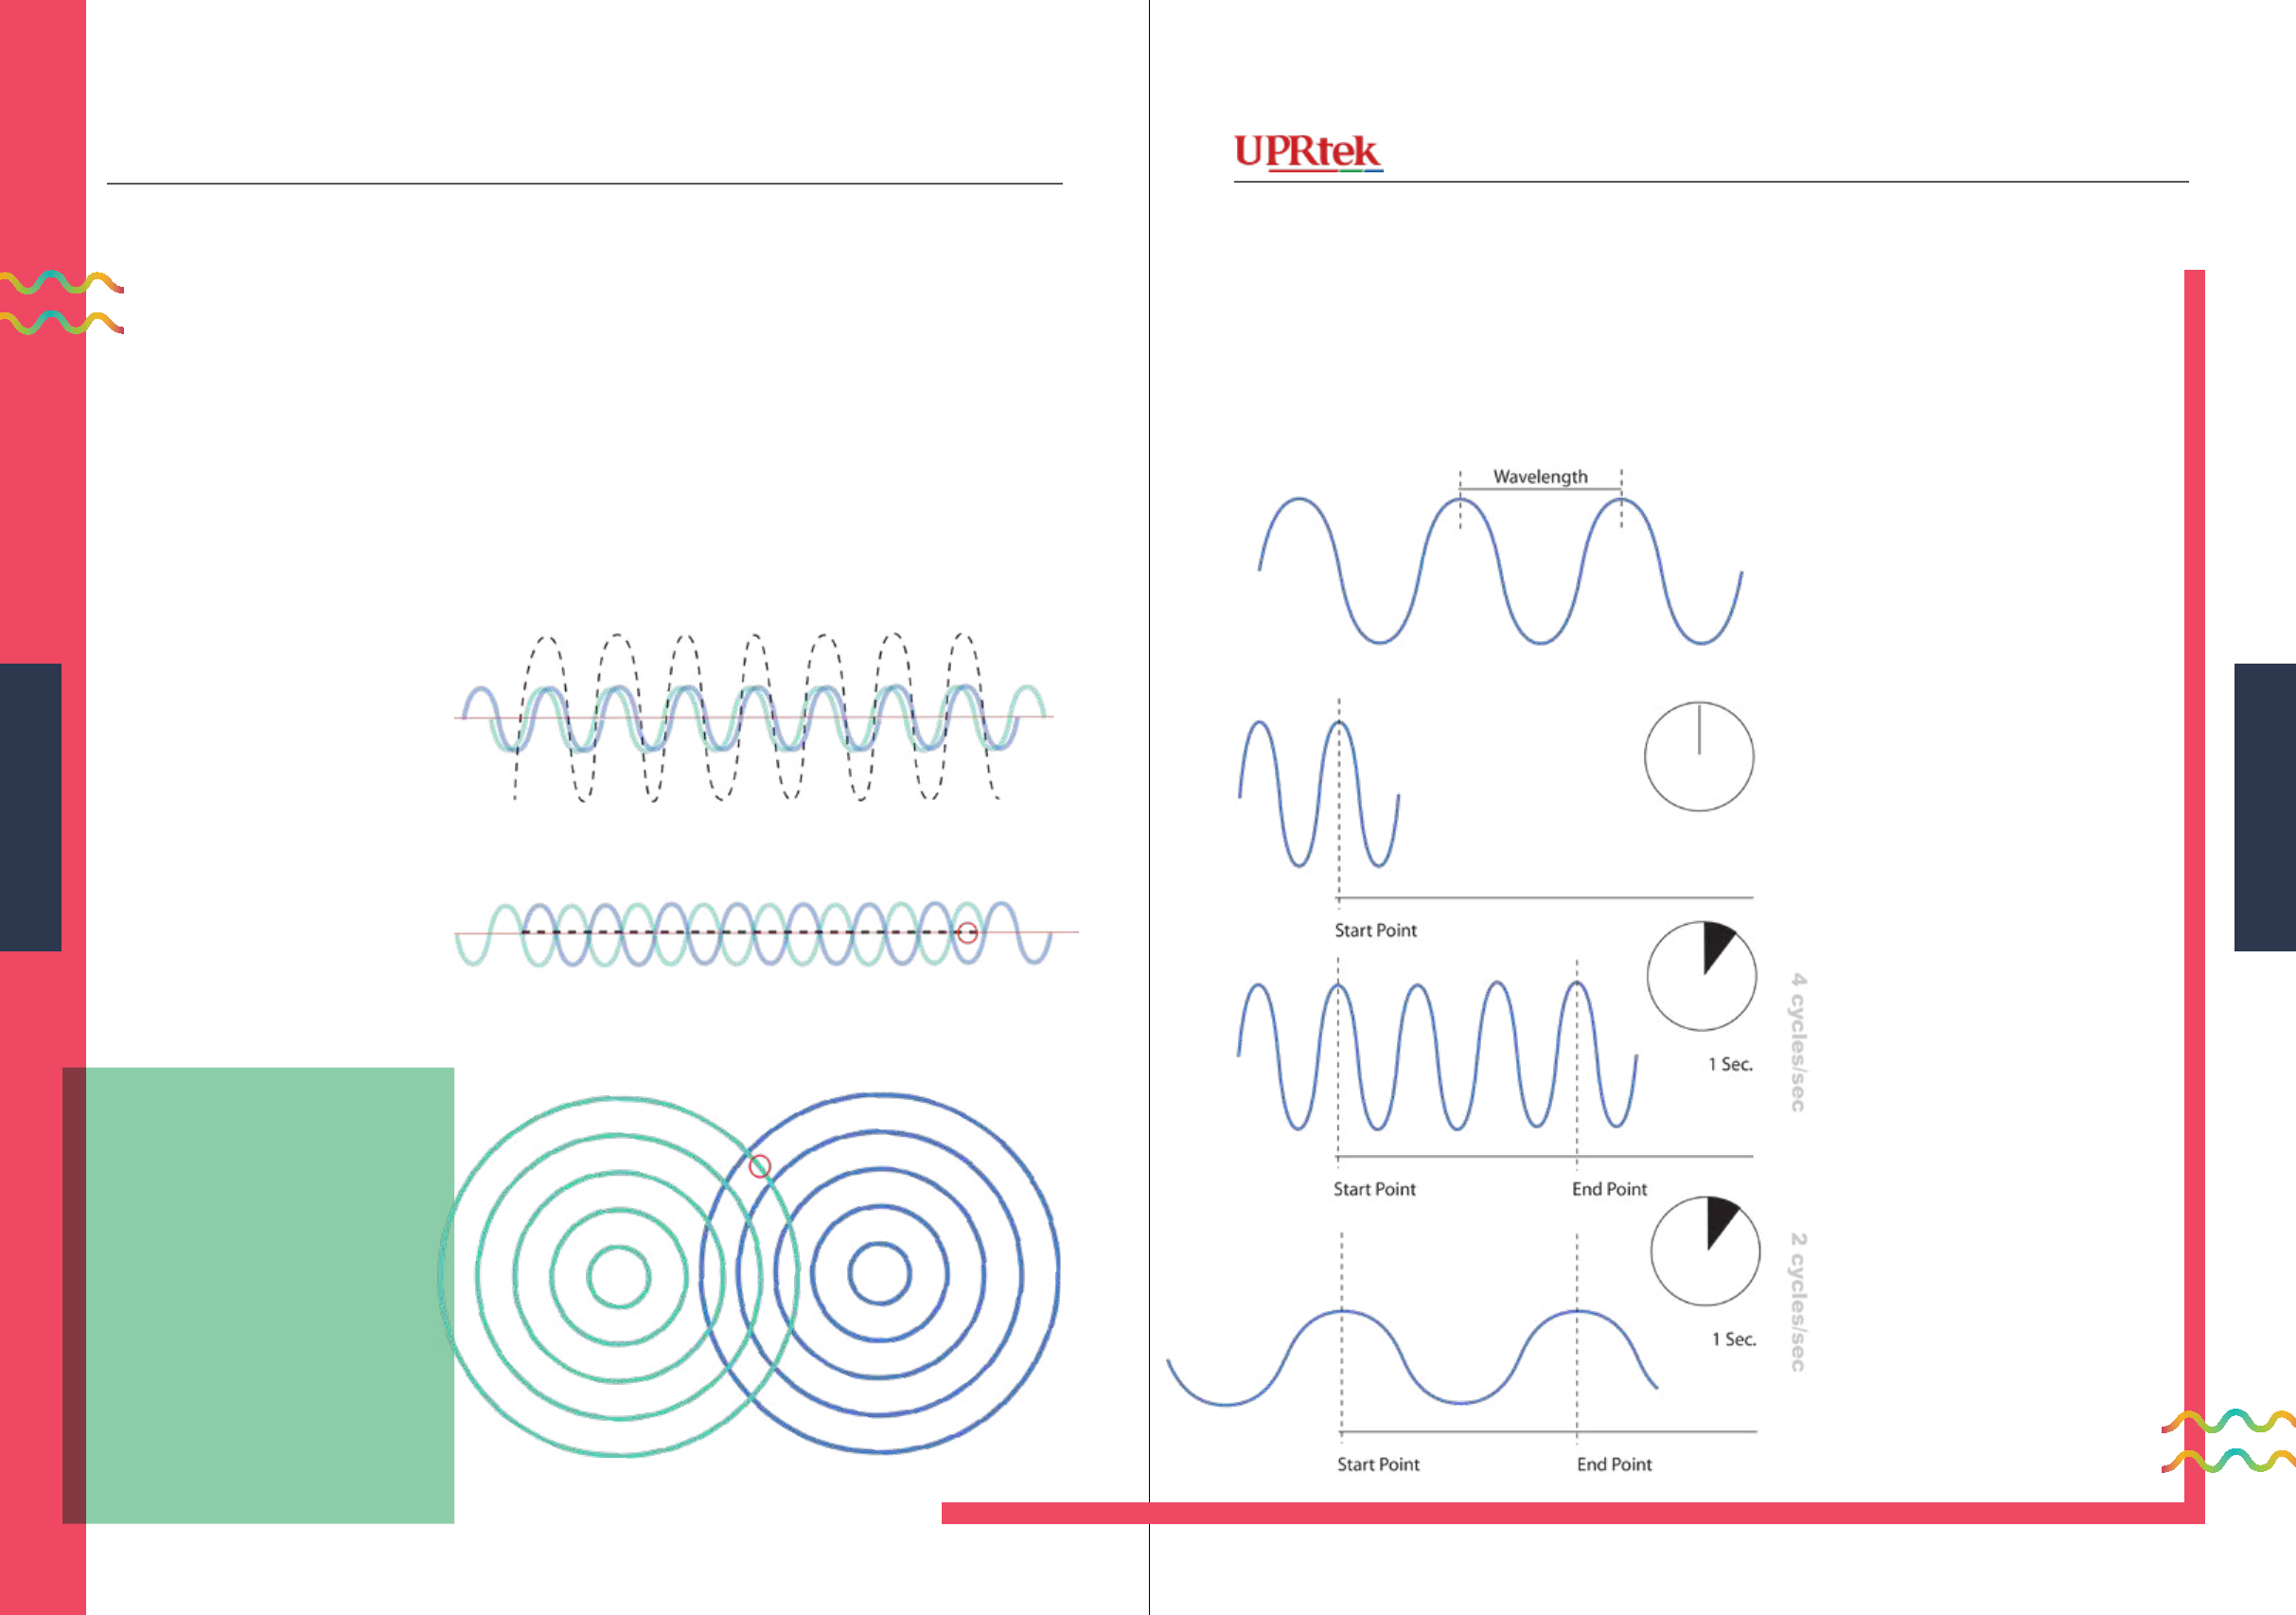
Wave behavior
Remember that when two wave
peaks meet, they make a su-
per-sized wave? Another phe-
nomena occurs when a peak
passes over a trough - they cancel
each other out - and when they
pass each other, they revert back
to their original forms.
The basic idea is that several
waves can exist at the same time
and place, change each other,
while still being distinct.
Super-sized waves - 2 peaks meet
Canceling waves - 1 peak meets 1 trough
In our pond wave examples,
both of the two waves were
basically the same size.
However, there are two other
things that also make waves
different, which are frequency
and wavelength. Wavelength is
the distance from one peak to
the next.
Frequency is the number of
peaks that pass a xed point
(Start Point) in a xed amount
of time. In the rst example, 4
peaks travel past a xed point
in one second - the frequency is
4 cycles /sec.
The second example has a fre-
quency of 2 cycles per second.
Which wave travels faster?
Two waves can
exist in the
same place,
same time and
still be distinct
“
“
Wave Behavior
All light, no maer the frequency, travels at the same speed.
4140 MK350 Series Survival Handbook
Light
Light
Version 20140410b - Not for distribution - © Copyright 2014 UPRtek All rights reserved
Versio 20140410b - Not for distribution - © Copyright 2014 UPRtek All rights reserved
Weblars - Creative Commons Attribution-Share Alike 3.0 Unported - Wikimedia Commons
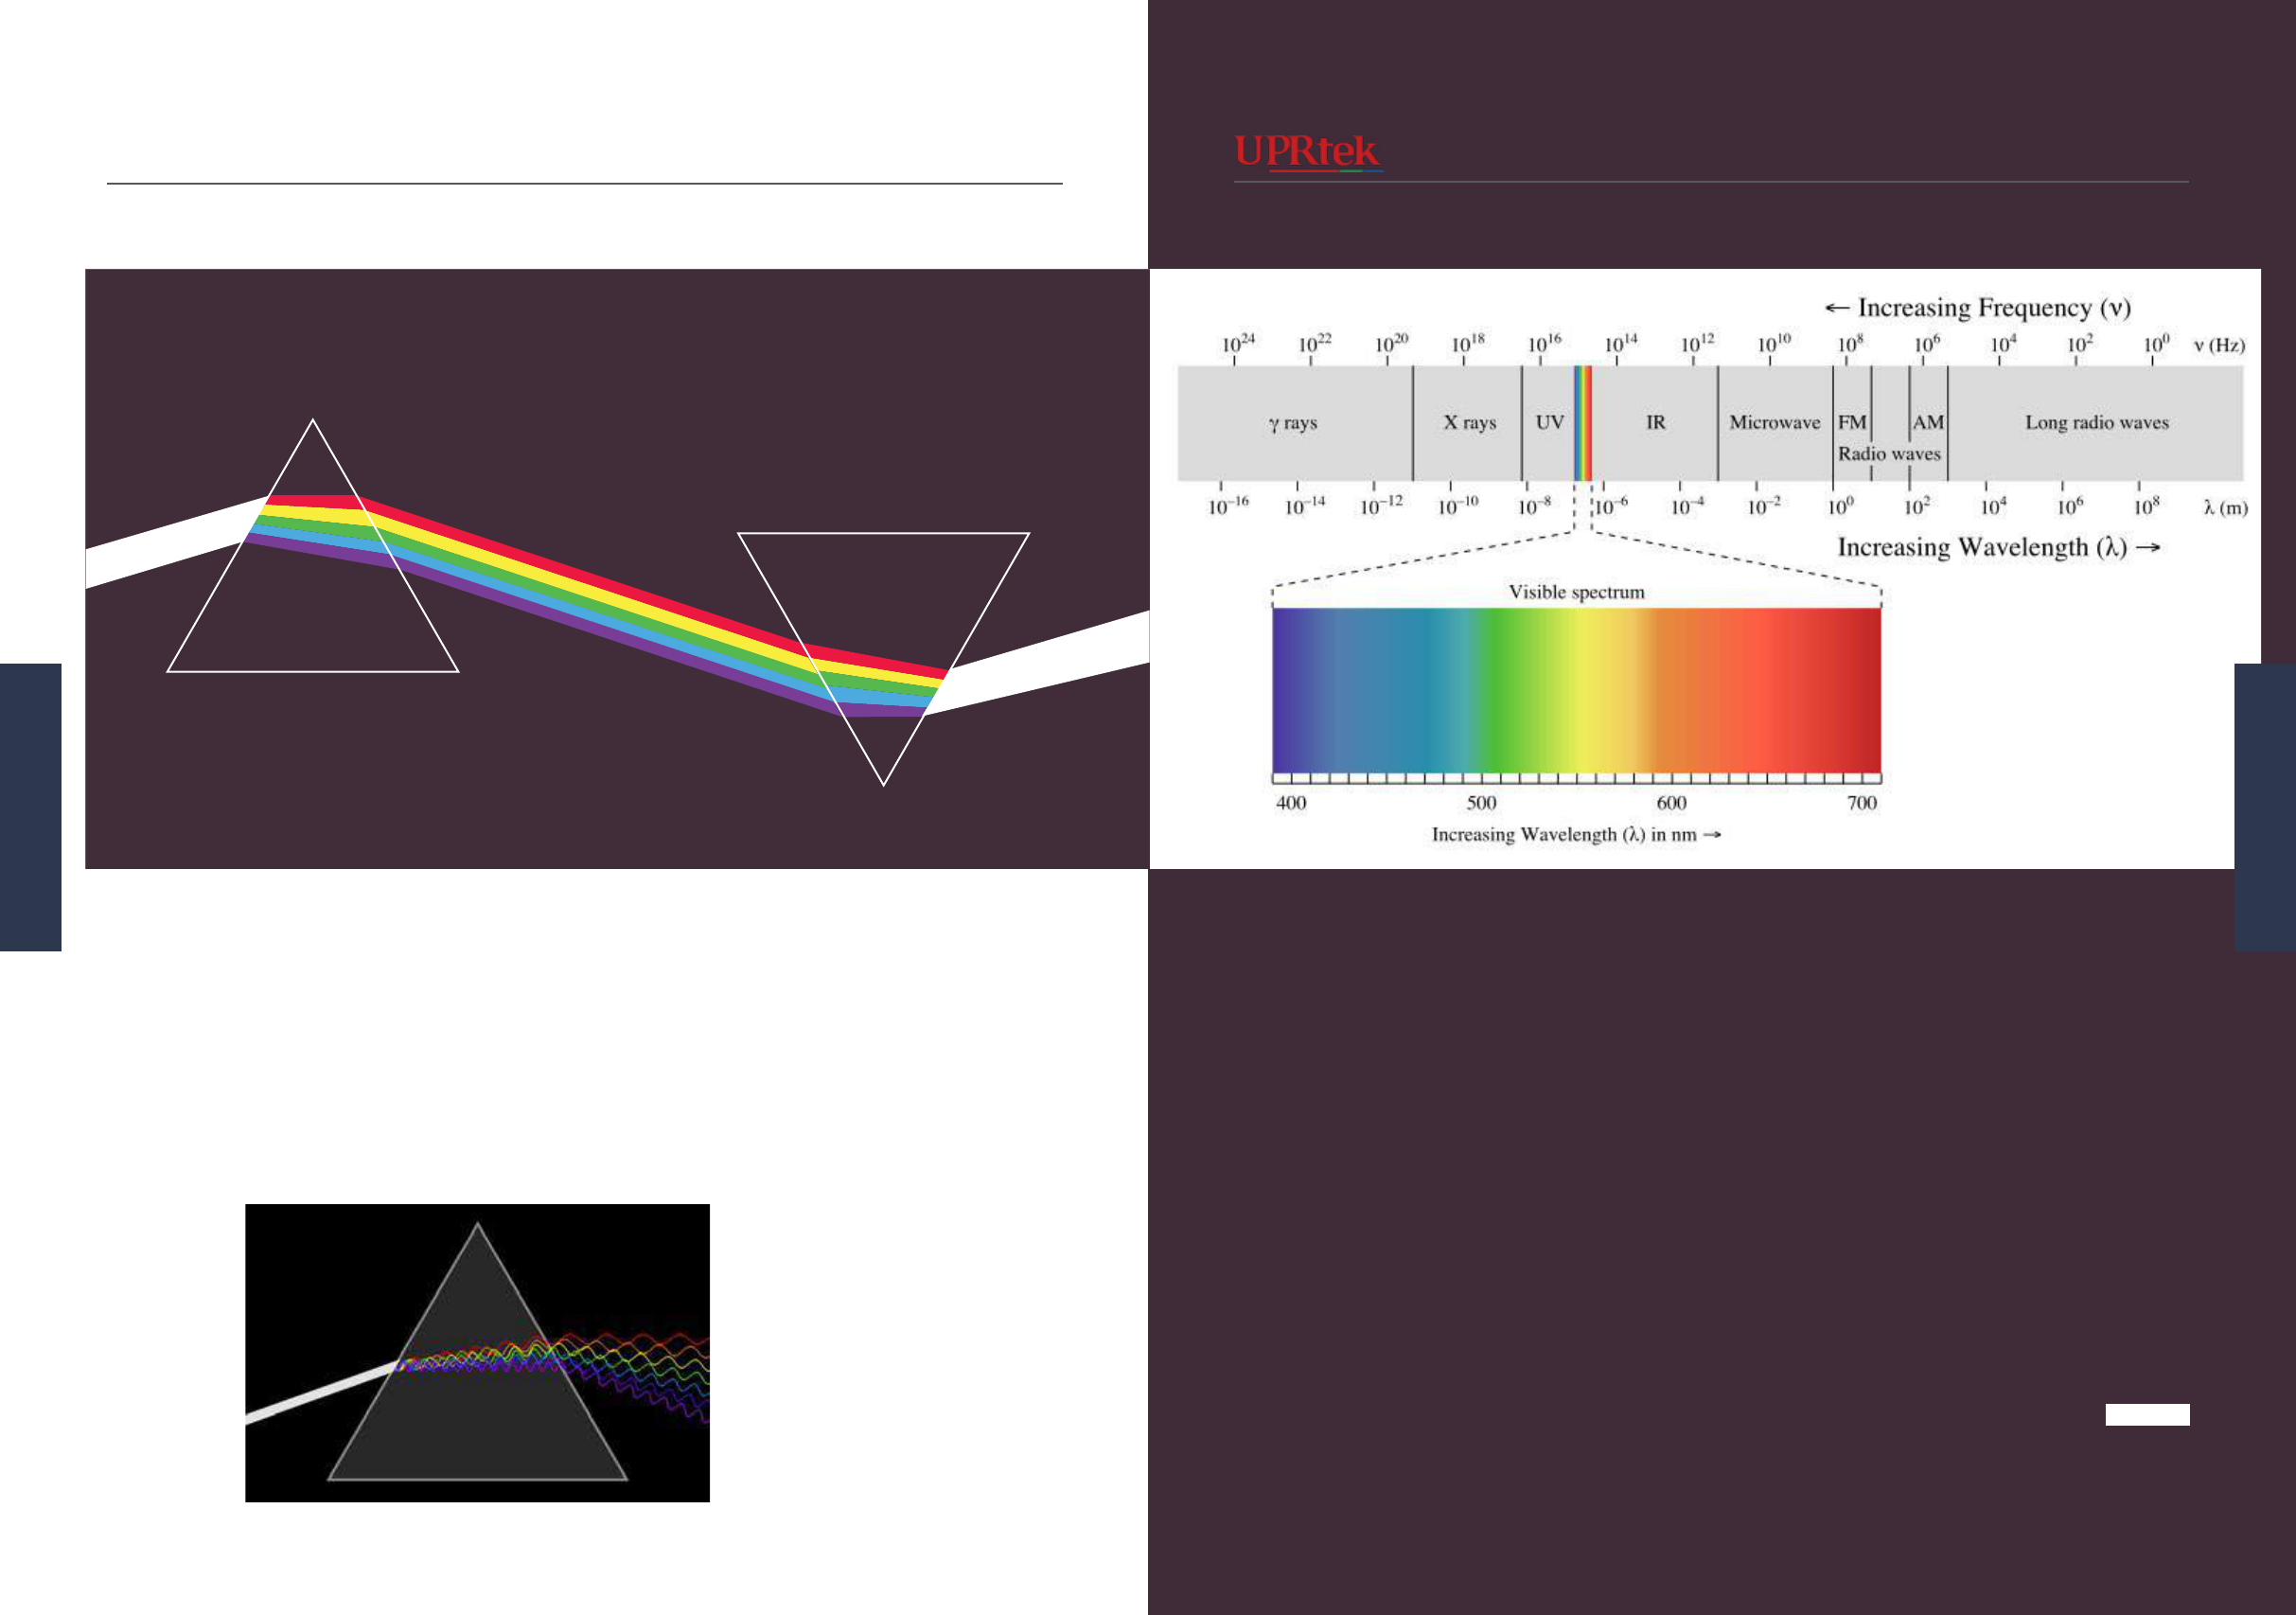
So now we know that light
behaves like waves. Why does
light disperse going through a
prism? There must be some-
thing different for the different
colored waves in white light.
Can you guess?
English Wikipedia (Original author : Philip Ronan)
- GFDL - CC-BY-SA-3.0 Generic
Light is considered electro-
magnetic radiation, which is a
general term that includes all
visible and invisible sources of
electromagnetic waves, ranging
from UV light, x-rays, visible
waves, infrared to radio waves.
As you see above, the Visible
Light is only a very small por-
tion of that.
This much we know - all forms
of electromagnetic radiation
carries energy.
Frequency and wavelength.
Each color inside white light
has a different frequency and
wavelength and this is what
causes each to bend slightly
differently.
Blue light slows down more
than red light and will therefore
bend more than red light.
Since light behaves like waves,
several colors can exist at one
time in one beam of light and
still maintain a distinctive wave
shape.
1st prism
2nd prism
Color Spectrum
white light
white light
... And the really cool thing is that you can
combine the different colors back into white
light, which really convinced authorities that
light is composed of many colors.
4342 MK350 Series Survival Handbook
Light
Light
Version 20140410b - Not for distribution - © Copyright 2014 UPRtek All rights reserved
Versio 20140410b - Not for distribution - © Copyright 2014 UPRtek All rights reserved
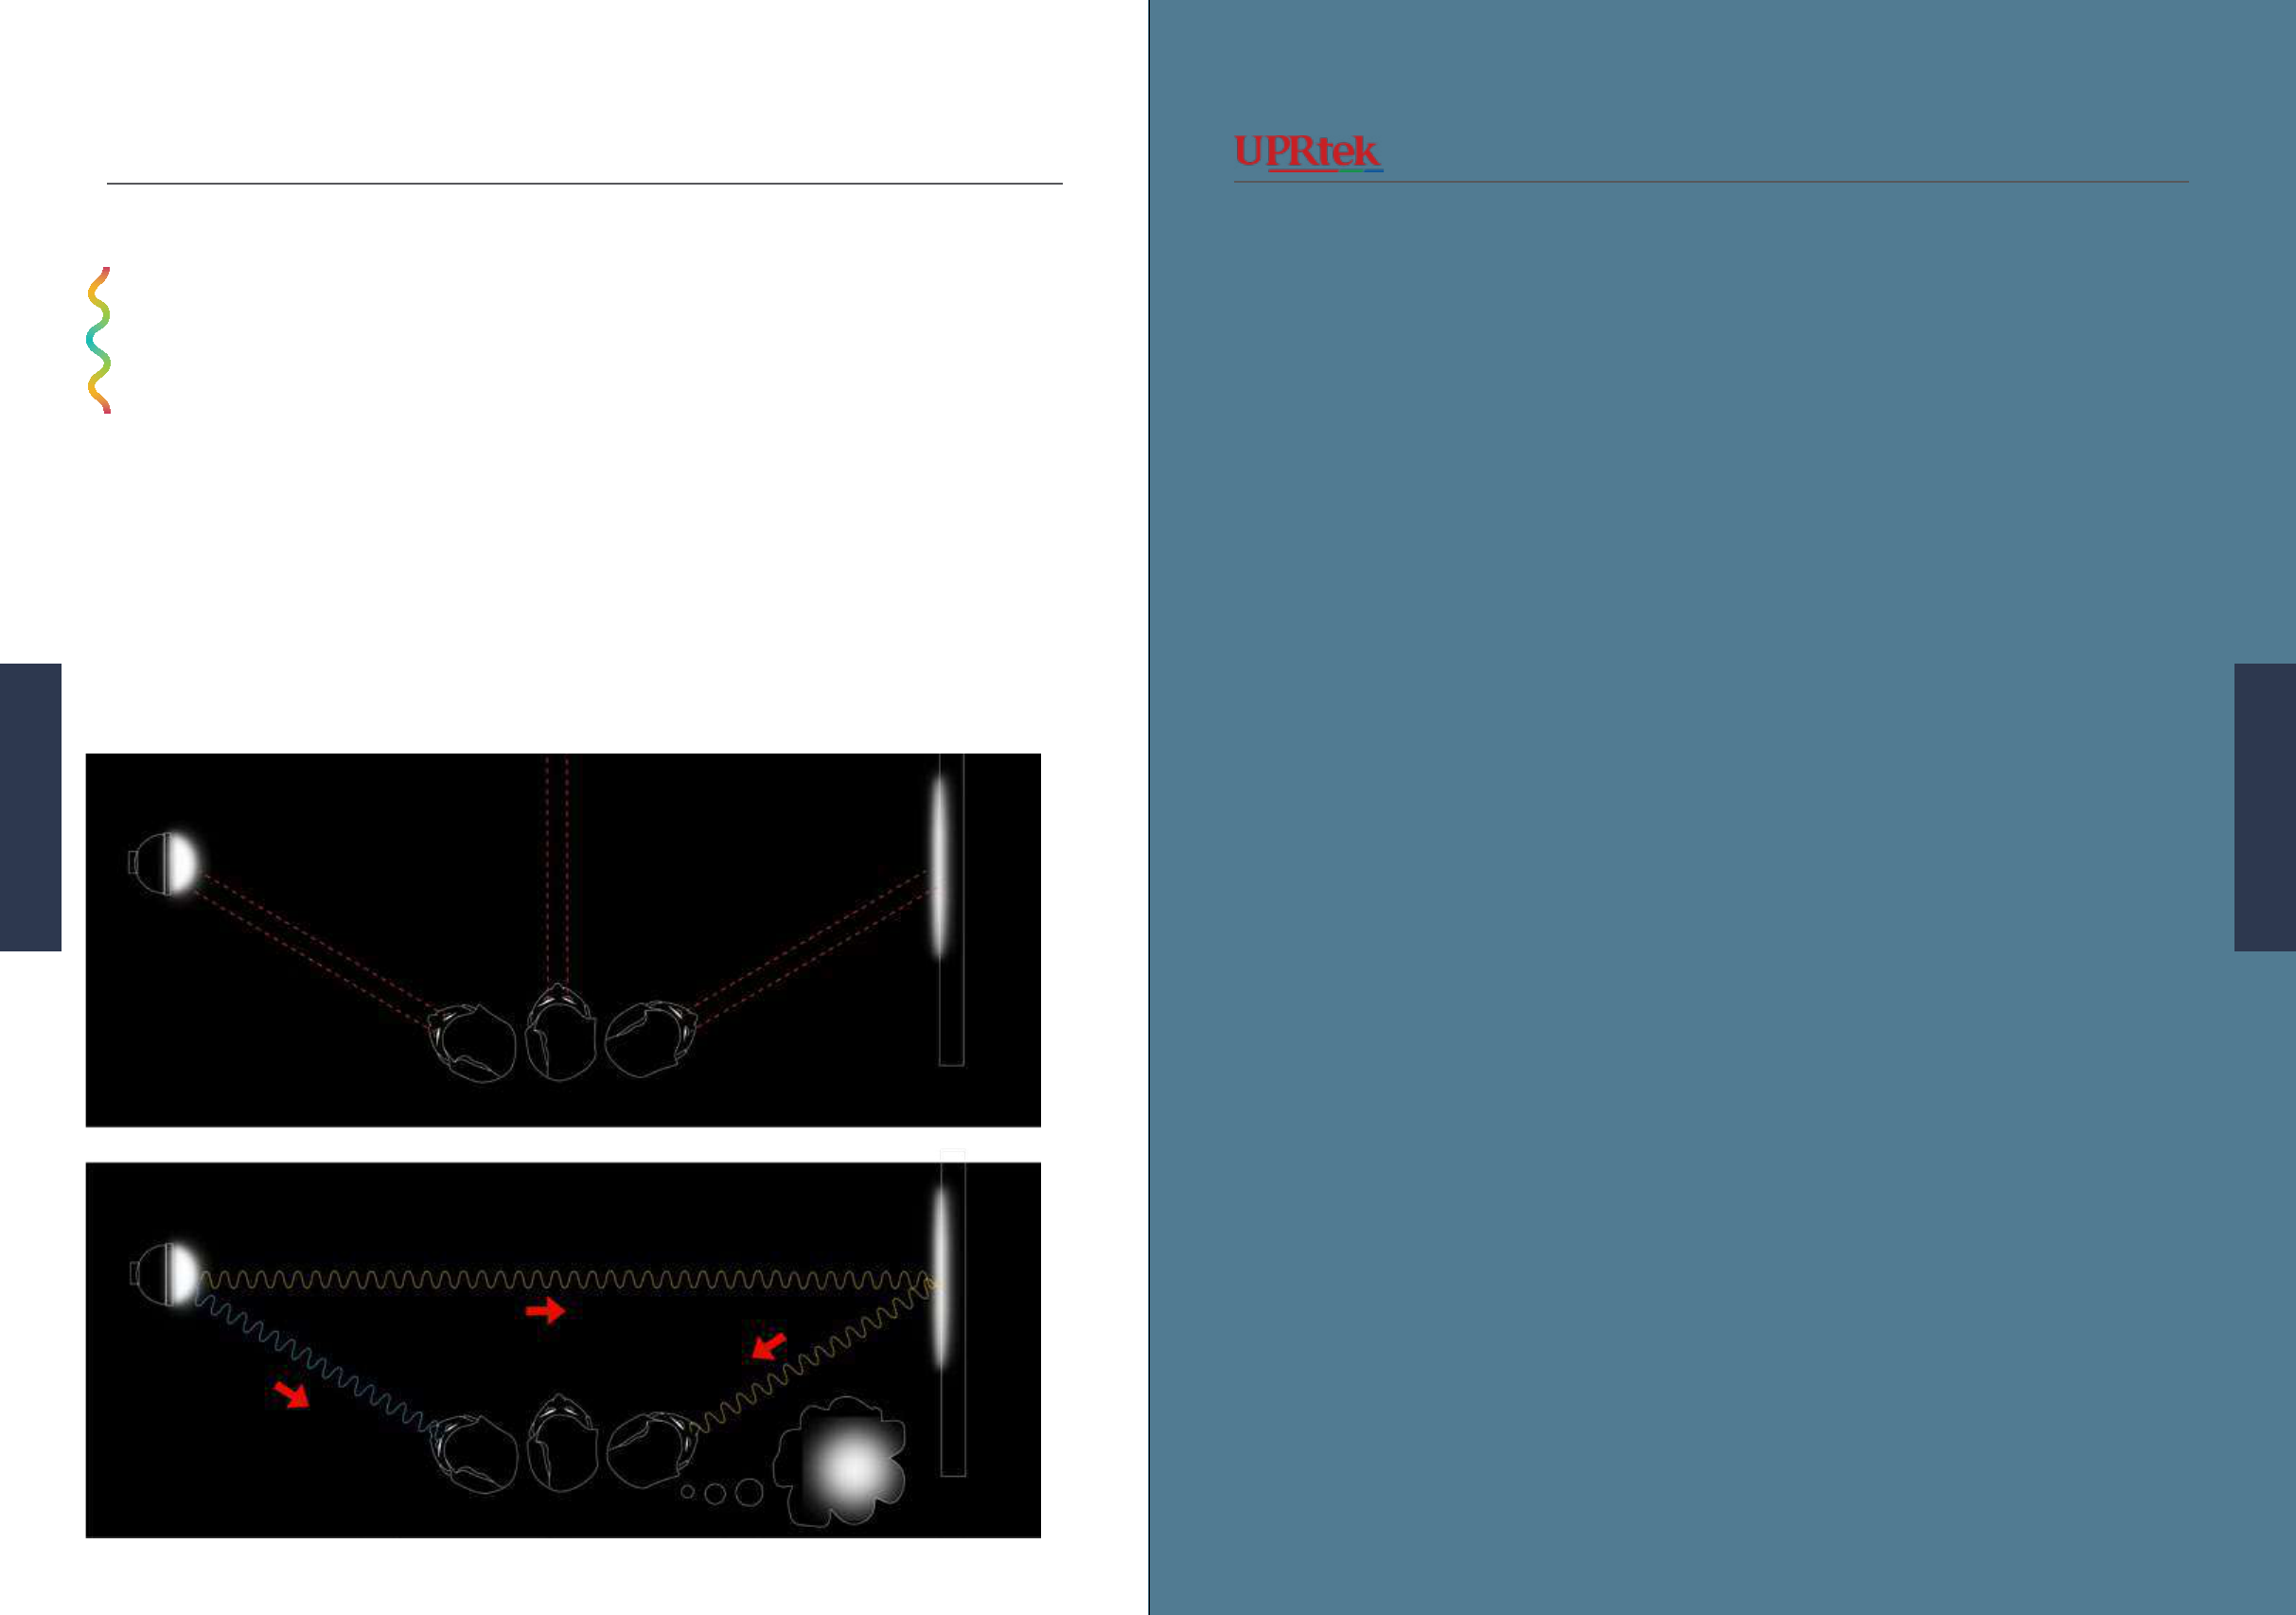
See Light or Sense Light?
You are standing in a dark
room. There is a ashlight on
the left pointing to a wall on
your right.
2
1
3
For Your Eyes Only
You don’t really “see” light -
because light is invisible.
You sense light
when it hits your eye as
waves of energy
and it’s only then that it
stimulates your
brain to make a picture
of what is in front of you,
very much like
a camera.
1. I can see light if I look left, directly into it.
2. I can see light if I look right, directly at the wall.
3. However, if I look straight ahead, I cannot see the light traveling
in front of me. Why not?
See Light or Sense Light?
4544 MK350 Series Survival Handbook
Light
Light
Version 20140410b - Not for distribution - © Copyright 2014 UPRtek All rights reserved
Versio 20140410b - Not for distribution - © Copyright 2014 UPRtek All rights reserved
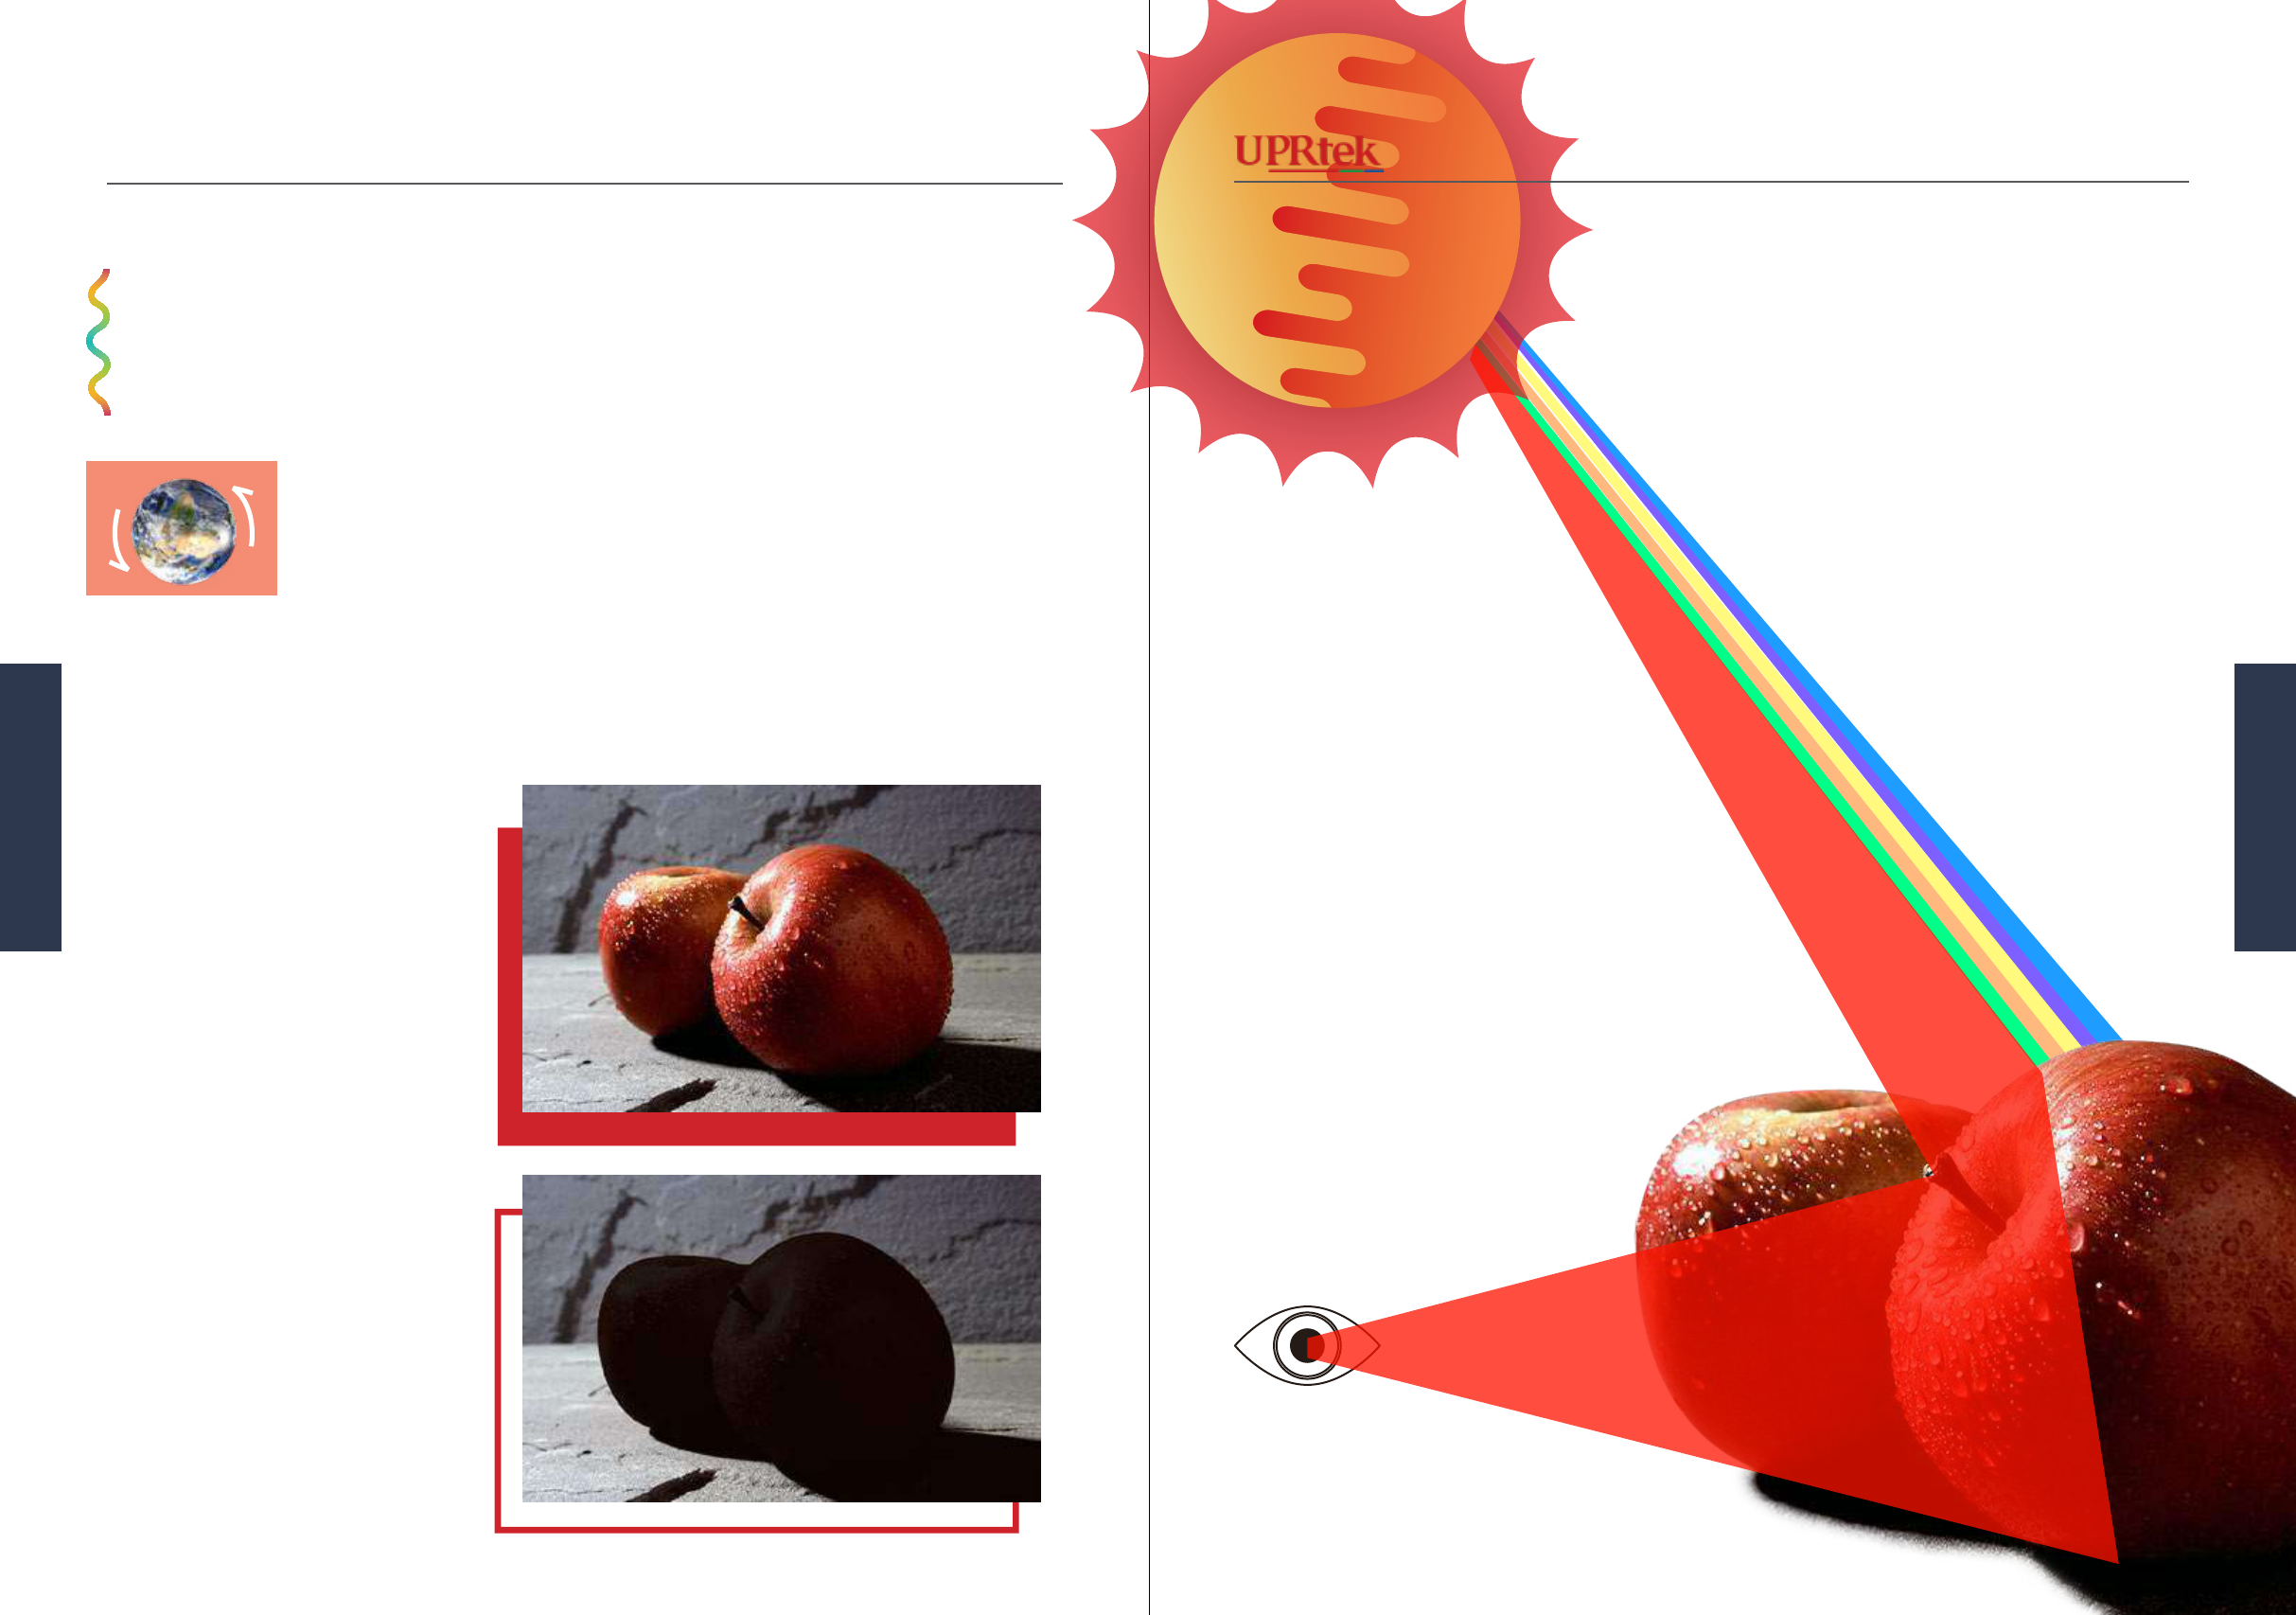
Let’s continue with Sir Isaac
Newton’s exploration into light
and color. As we discovered,
light from the Sun is a compos-
ite of different colors.
Newton also established that
the colors that we see on objects
(e.g. apples) are not attached to
those objects - the colors come
from an original light source.
In other words, nothing inher-
ently has color - just turn off
the light and you will “see”.
Nothing “has” Color
So what is color?
What happened to blues, greens, yellows?
The red that you see in the
apples come from the original
light source, the sun, which re-
ects off the apple and reaches
our eyes.
So what is color?
4746 MK350 Series Survival Handbook
Color
Color
Version 20140410b - Not for distribution - © Copyright 2014 UPRtek All rights reserved
Versio 20140410b - Not for distribution - © Copyright 2014 UPRtek All rights reserved
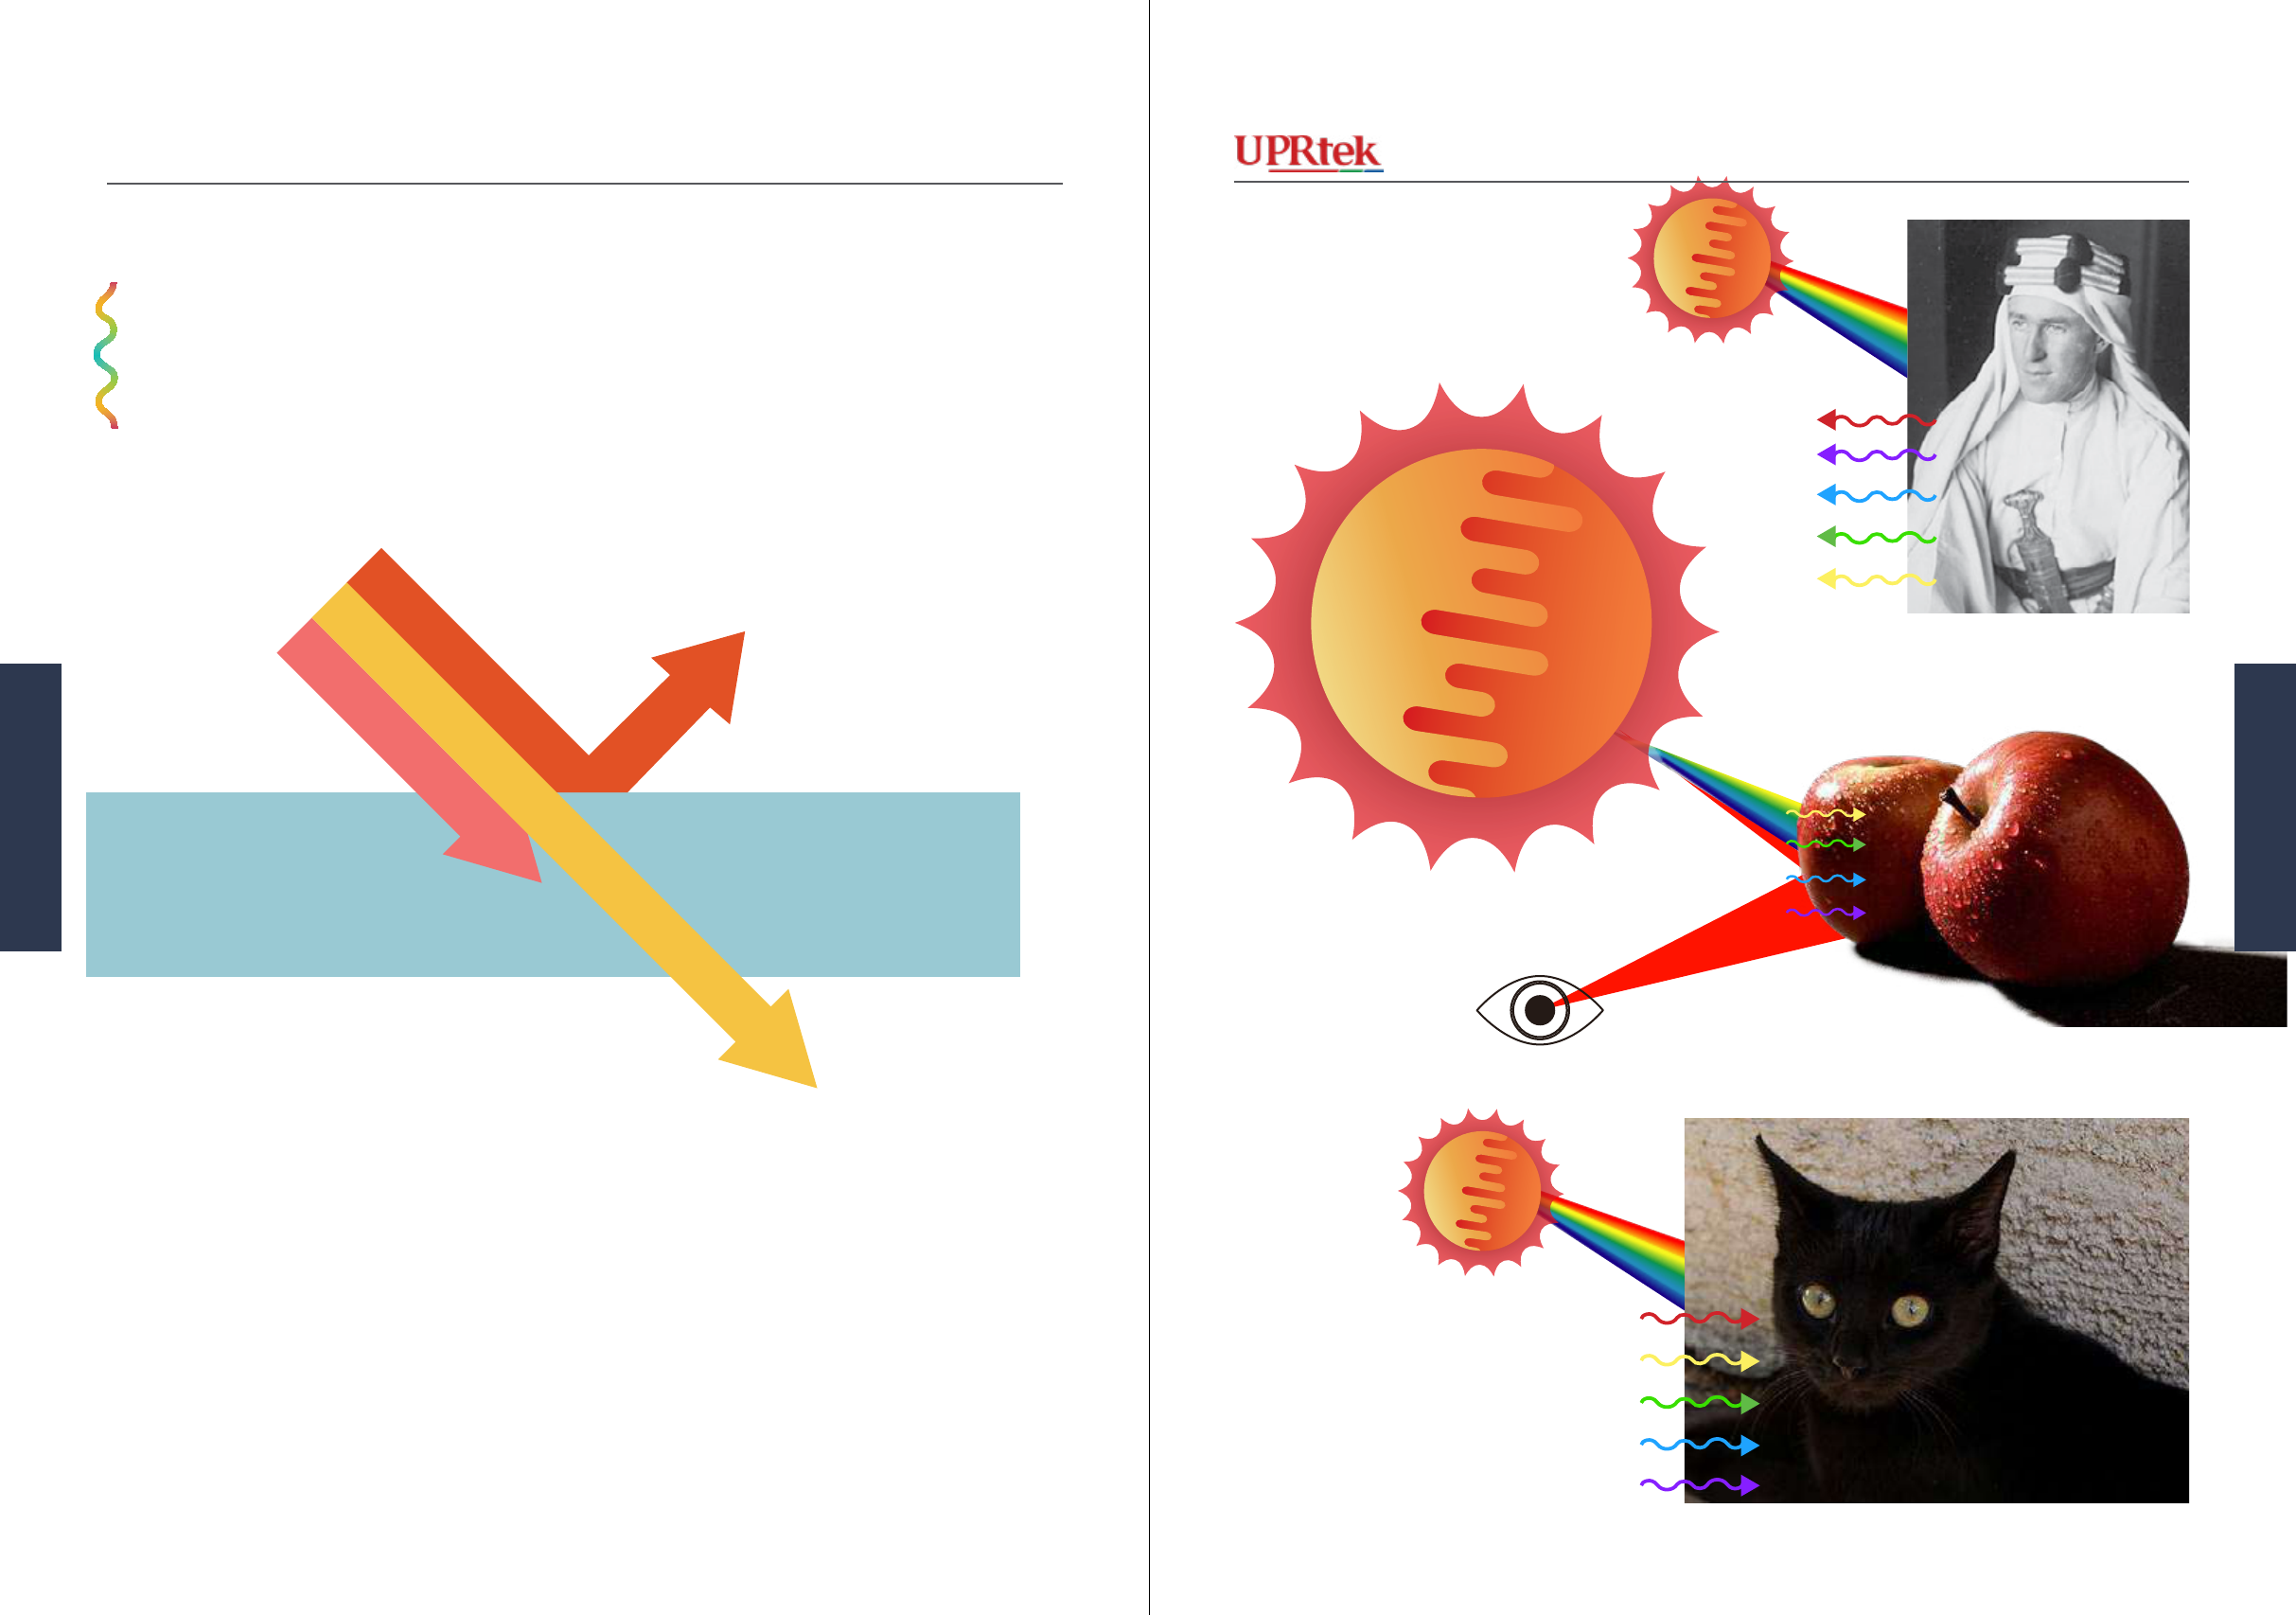
3
When light comes from a source
and hits an object, three things can
happen:
Reection
Absorption
Transmission
It makes sense to wear white in
hot, sunny regions. Why?
TE Lawrence - Lawrence of Arabia
Joergbieszczak - Creative Commons Attribution
Share Alike 3.0 Unported
Black absorbs all light and makes the cat warm.
Reection, Absorption,
Transmission
Absorbed
Ref lected
Transmitted
Incident
Reection is when the light (e.g. red light) reects off a
surface. A white surface reects all light.
Absorption - This is what happened to the other colors in
the apple example on the previous page. The blues, yellows,
greens were absorbed by the apple! The absorbed energy
turned to heat in the apple. A black surface absorbs all light
and this is why black is referred to as the absence of light.
Transmission - This is what a prism does, it lets the light go
through (with a little refraction/bending).
The apple reects red and absorbs the
rest of the colors.
Reection, Absorption, Transmission
Dance of Light
4948 MK350 Series Survival Handbook
Color
Color
Version 20140410b - Not for distribution - © Copyright 2014 UPRtek All rights reserved
Versio 20140410b - Not for distribution - © Copyright 2014 UPRtek All rights reserved
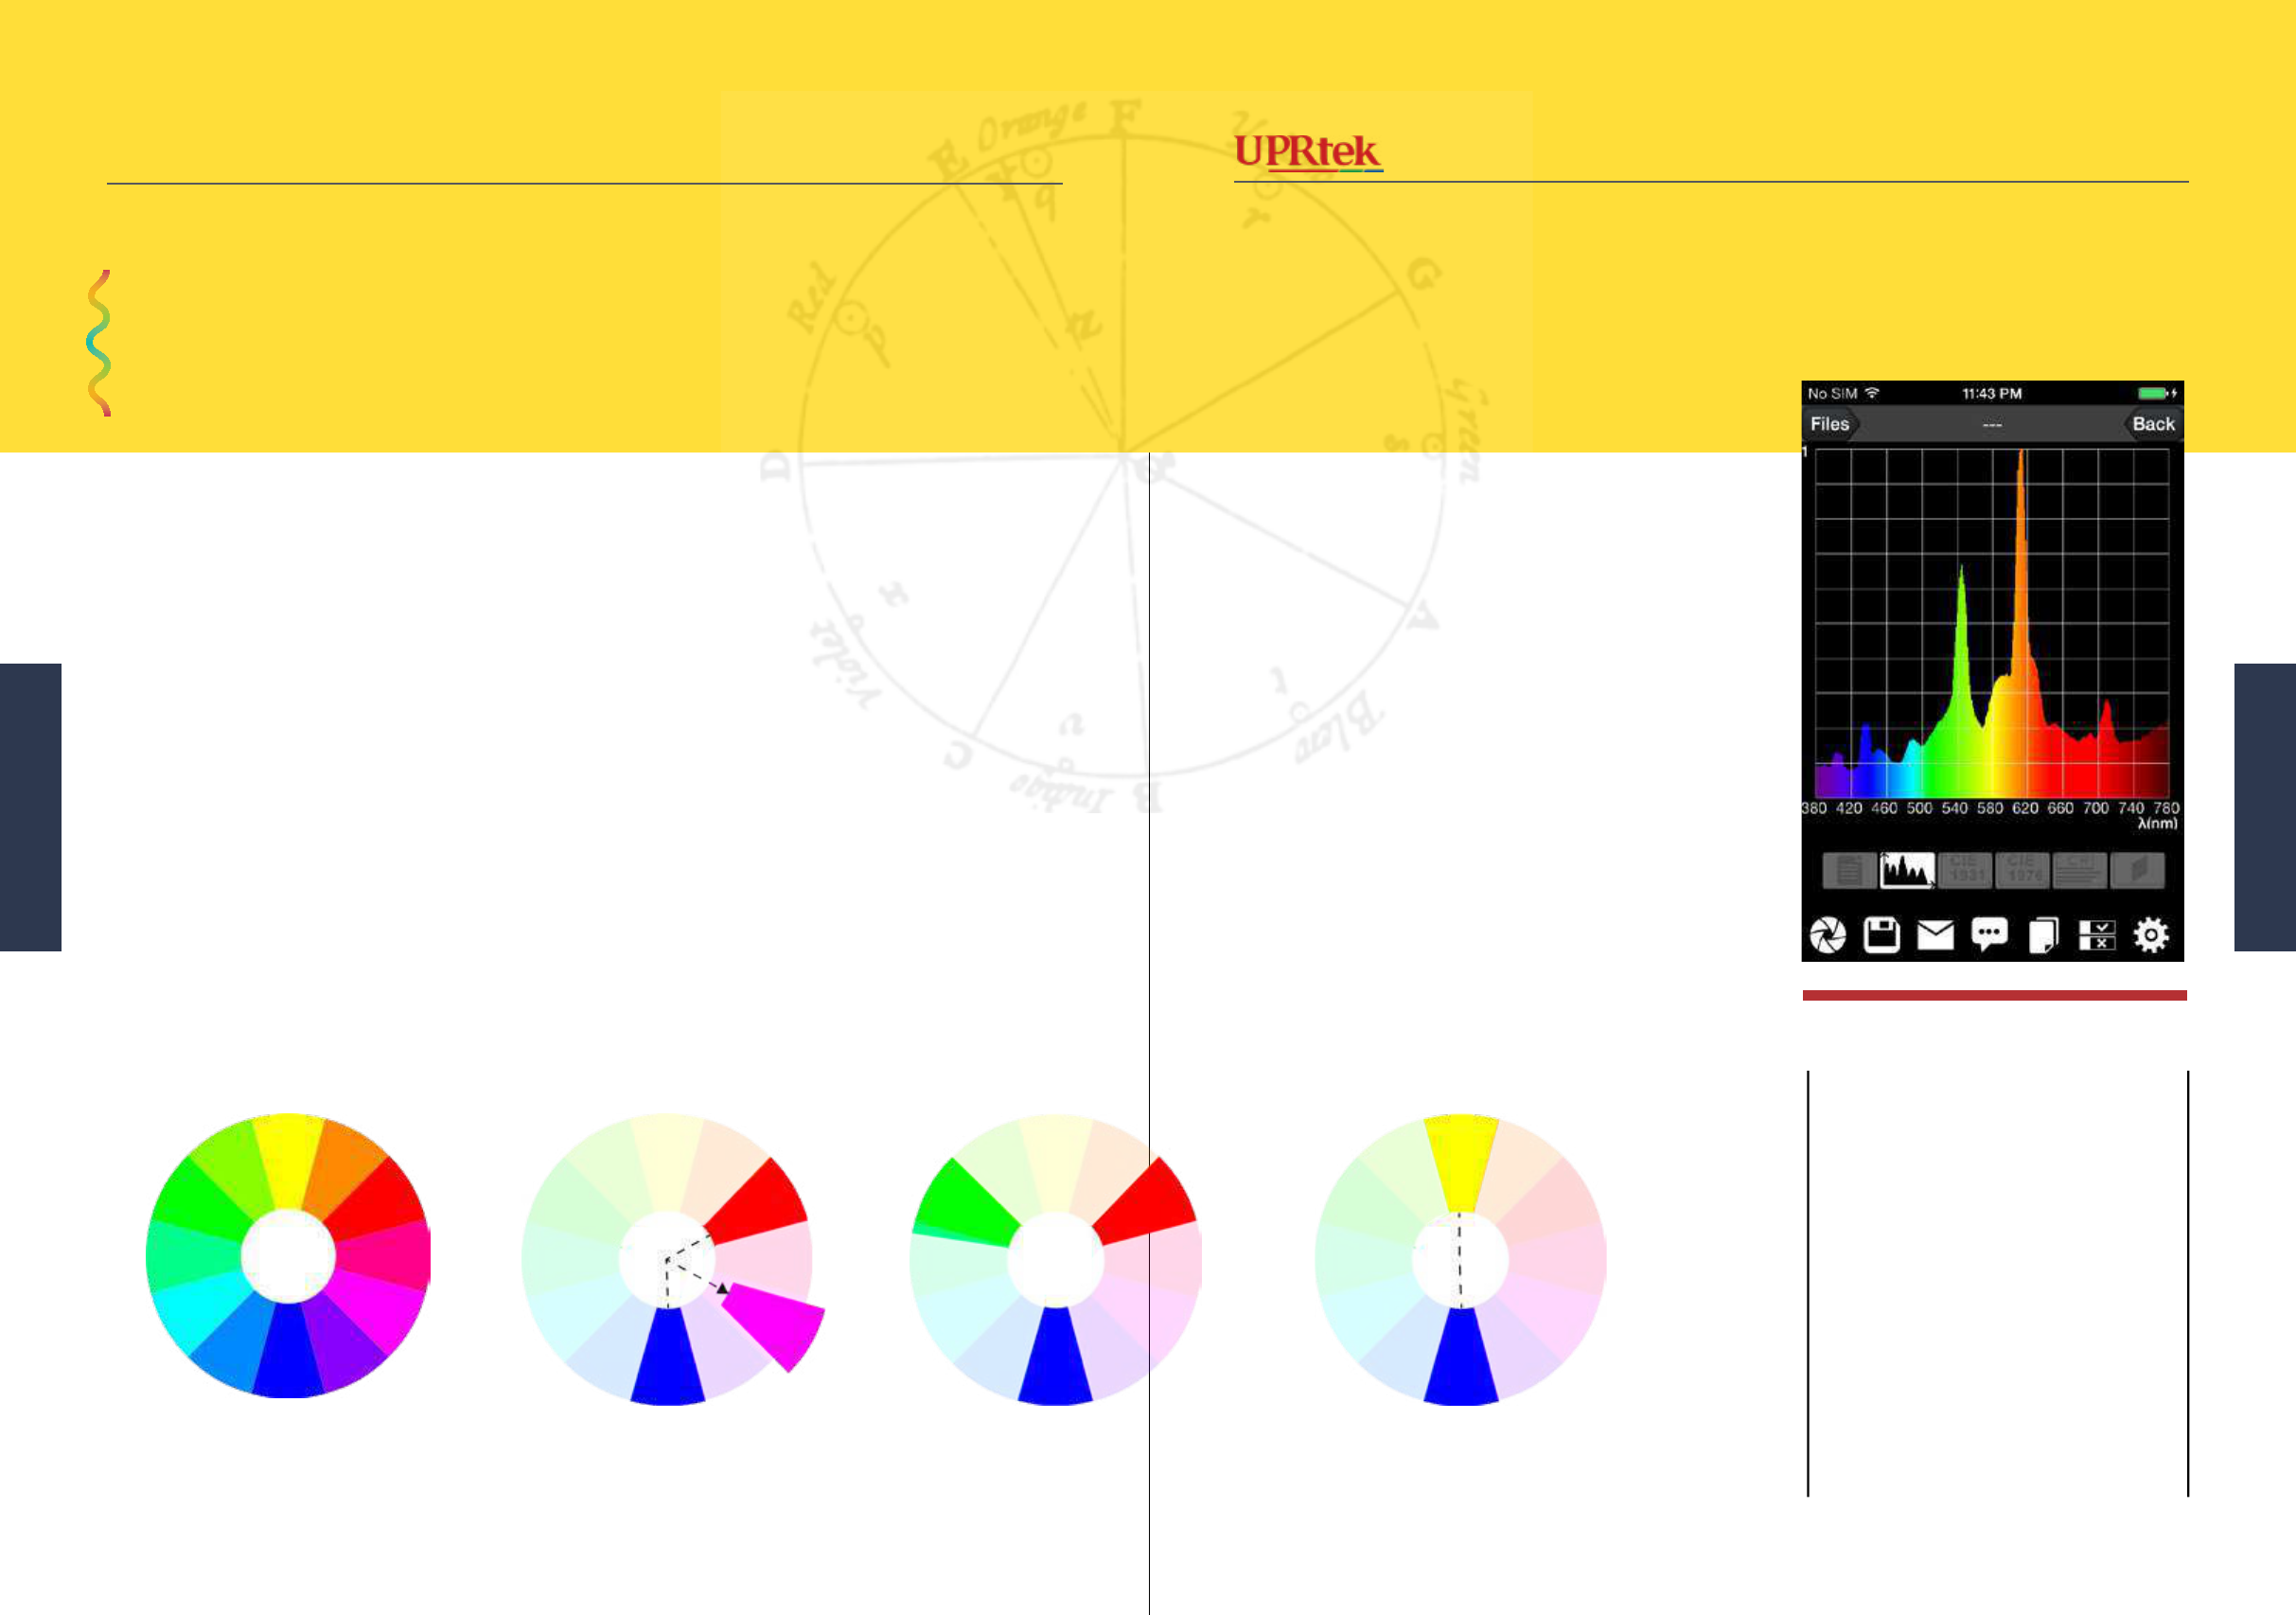
Good Readings
So, we know that white light is made up of
different colors as Newton discovered. He also
conceptualized the rst color wheel. This color
wheel has evolved over time and has come to
show us how colors interact and mix with each
other to form new colors.
The concept of primary colors was derived from
the color wheel, identifying a few basic colors
that could make up all of the other colors. For
RGB color wheel
Color Wheel - Mixing colors
OK, so we can mix two or three colors of equal
amounts to get a resulting color. The diagram on
the right is another way of showing a mixture of
colors - it is from a white light source. Howev-
er, light is not just two or three separate colors,
but a continuum of colors all connected together
into what we call a spectrum (like a rainbow).
There is another element and that is the amount
of a certain wavelength or the intensity or bright-
ness (y-axis). Notice that there is a green and
an orange spike - this shows that the orange and
green waves coming from this light are brighter
(more intense) than the other colors. This type of
diagram is called a color spectrum.
Primary Colors
red+green+blue=white
White
Opposite colors make white
(blue-yellow)
White
Additive vs. Subtractive
We use these two terms to describe
how to mix colors. The additive
method is used with light - you add
different colored lights together to
make your desired color. Subtractive
method is used with surfaces where
you start with a light and use a sur-
face to absorb (subtract) from the
light and reect the remaining colors
to form the new color. RGB is addi-
tive and CMYK is subtractive.
Spectrum - a continuum of colors,
like the rainbow
Spectral Colors - all the colors
visible to humans
TELL ME MORE
computers, they use red, blue and green. From
these 3 colors you can make all of the colors that
you can see on your screen. All of the colors in
the RGB color wheel can be made with just those
3 colors. Red + blue make the Secondary color
purple. Secondary + Primary colors make Tertiary
colors and so on. Red + green + blue make white
(in the middle). Also opposite colors such as blue
+ yellow also can make white (sound familiar?
hint LED light + Fluorescent Light).
Red
Blue
Purple
blue+red=purple (magenta)
Color Wheel - Mixing colors
www.colormatters.com
5150 MK350 Series Survival Handbook
Color
Color
http://www.youtube.com/watch?v=UXIfzc1UH-g
Version 20140410b - Not for distribution - © Copyright 2014 UPRtek All rights reserved
Versio 20140410b - Not for distribution - © Copyright 2014 UPRtek All rights reserved
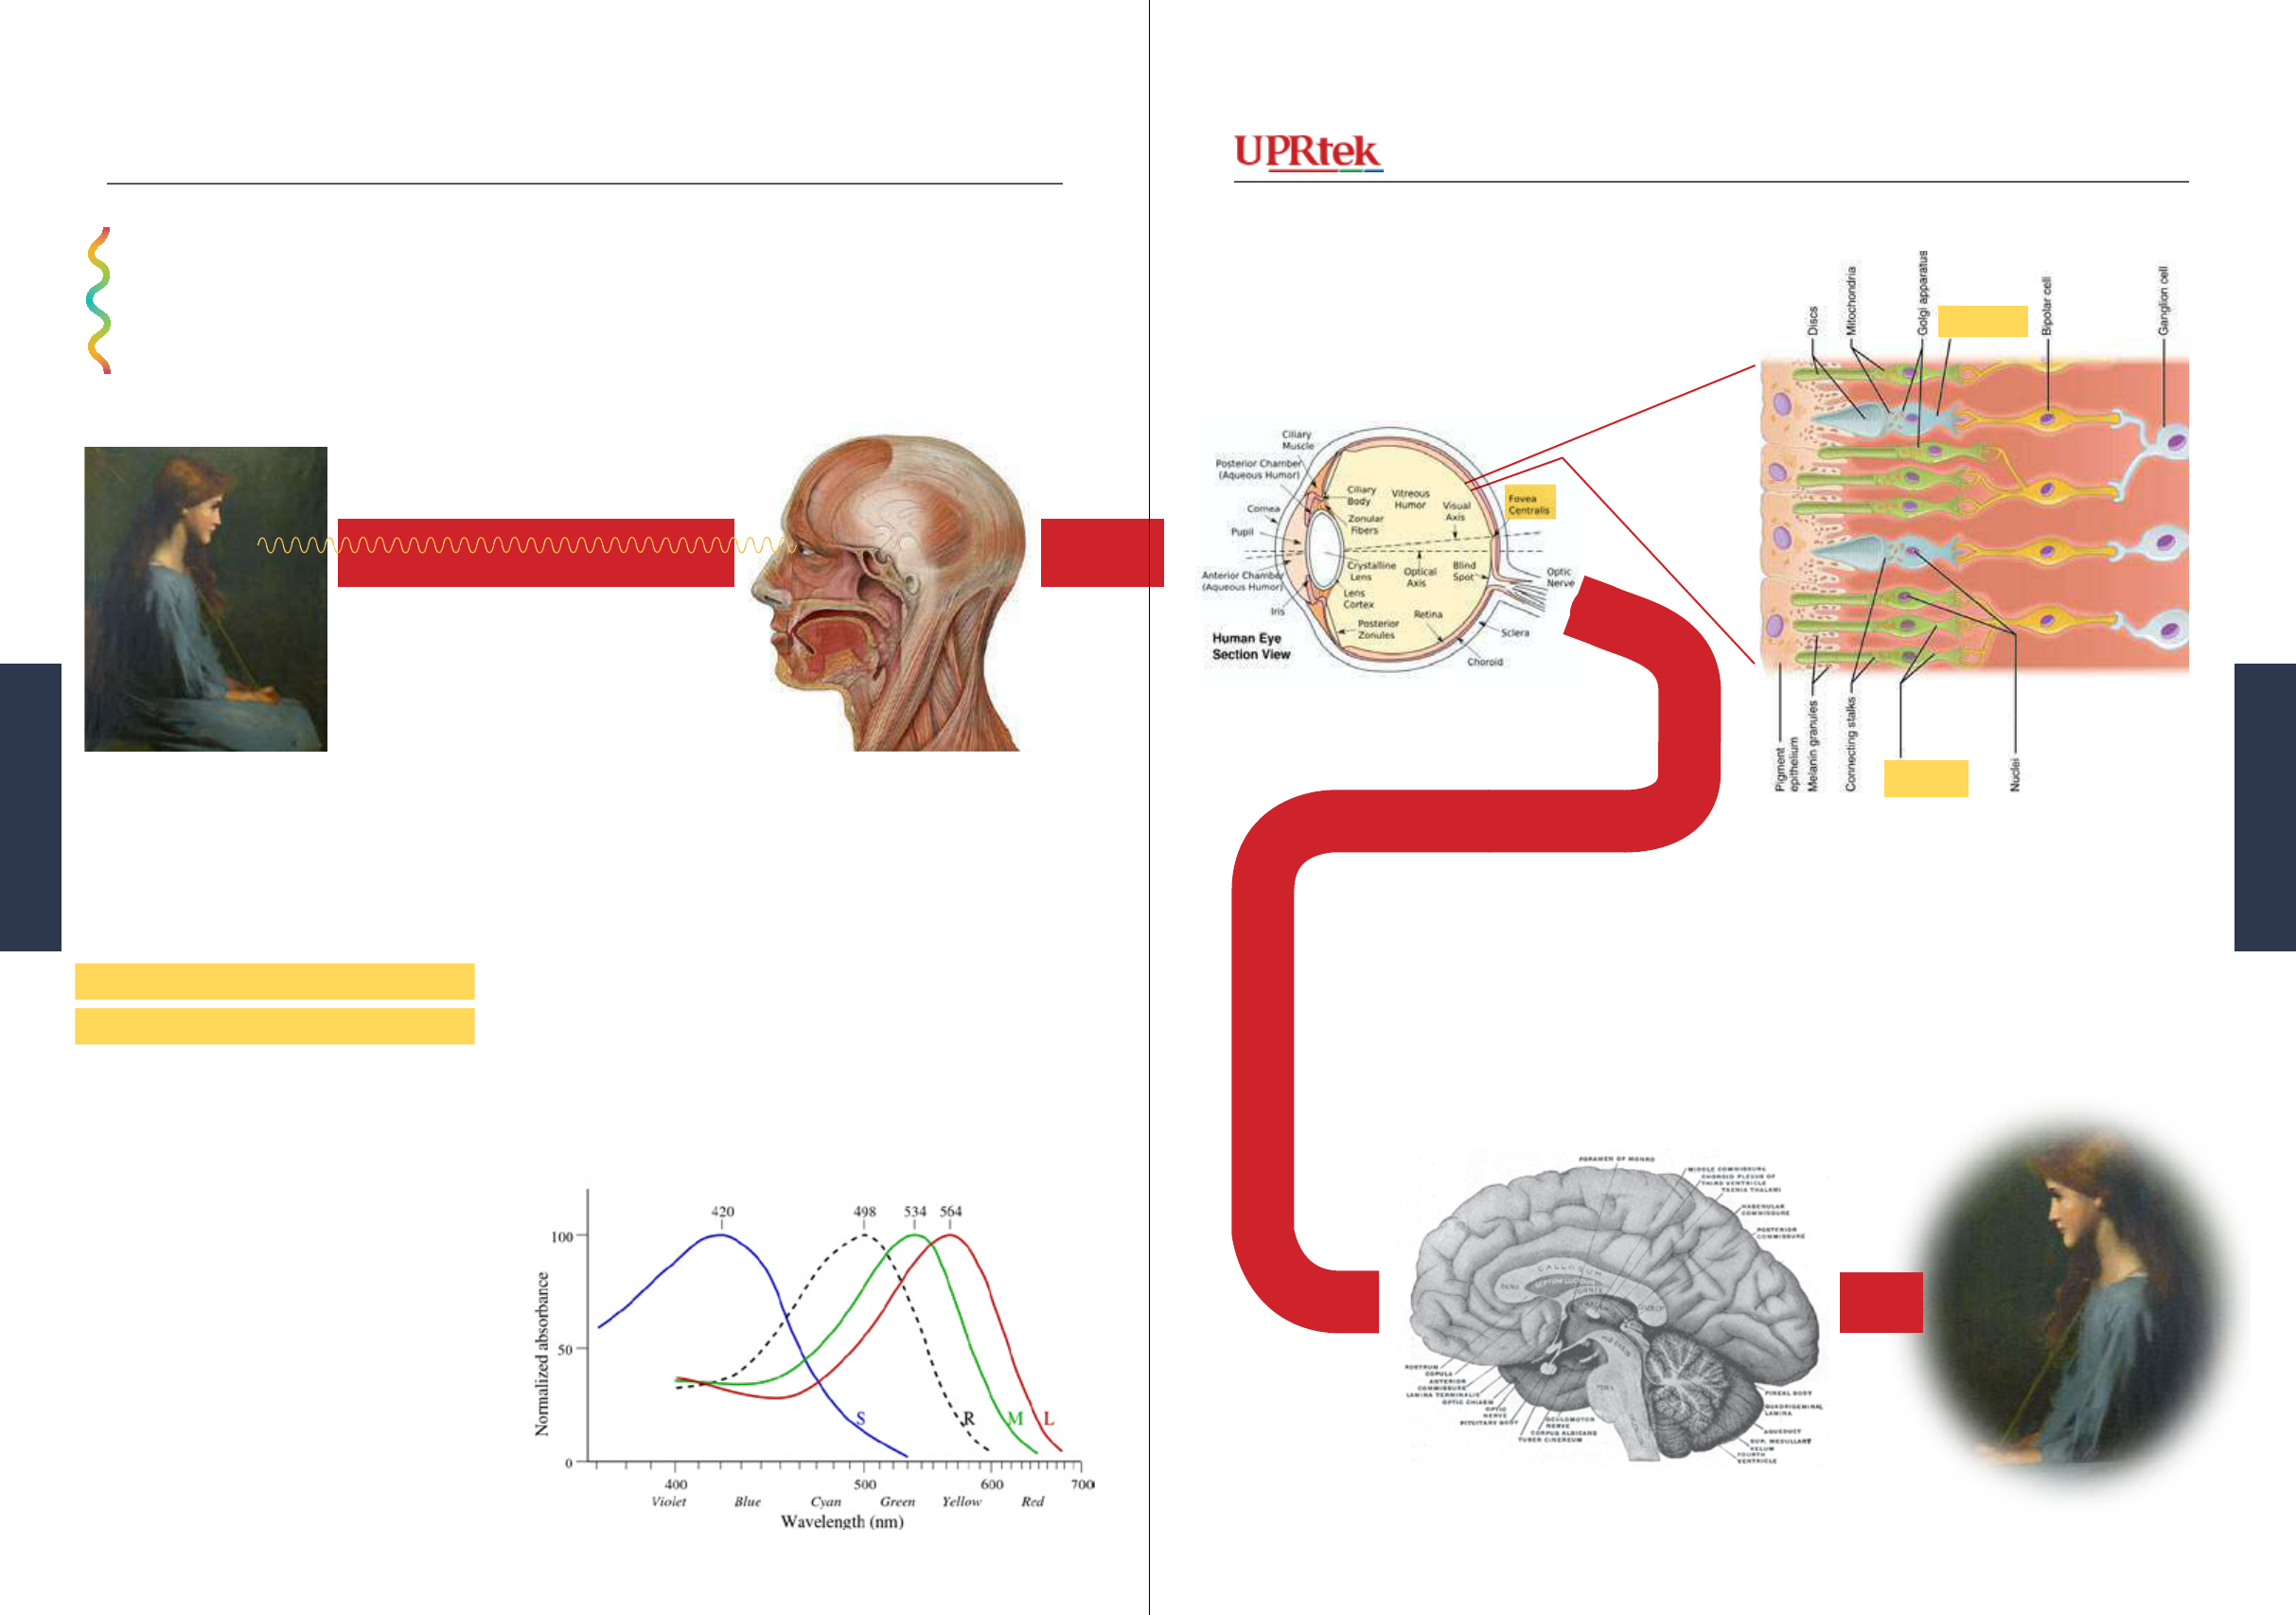
Rods & Cones
As we mentioned, light waves can enter
our eyes. In the back of our eye is the
retina - the retina has photo-receptor cells
(cells that can receive and act on light
waves) - These photo-receptors are called
Rods (night) - Scotopic Vision
Cones (day) - Photopic Vision
These Rods and Cones process light and
send impulses through the Optic Nerve to
our brain, which form an image IN OUR
MINDS.
The Rods are used in low light conditions
and do not visualize colors well. The
Cones however, are used in sunlight or
lighted conditions and can process colors
more effectively. Cones are mostly con-
centrated in the Fovea, a small depression
in the Retina.
There are 3 types of cones that were rst
Electromagnetic Wave
S-Cones
M-Cones
L-Cones
Rods
Ji-Elle- Creative Commons Attribution-Share Alike 3.0 Unported
Our colors are inherently a human experience
thought to process red, green and blue wavelengths and
mix them together to form all colors, conveniently just
like our RGB color wheel - but that was too good to be
true. A more apt and recent naming convention is S, M,
L cones because each cone processes a range of Small,
Medium and Large wavelengths - however, they are
sometimes still habitually referred to as red, blue and
green cones.
These cones actually overlap each other when process-
ing color from light (see below). It’s even more com-
plicated the further down the processing you go, as we
shall see.
Optic Nerve
Optic Nerve
Cones
Rods
Rods & Cones
http://www.youtube.com/watch?v=V73k_0KuUJo
Watch a Video
Ji-Elle- Creative Commons Attribution-Share Alike 3.0 Unported Wikimedia Commons
Patrick J. Lynch, Medical Illustrator, C. Carl Jaffe MD - CC-BY-2.5 Generic
Wikimedia Commons
OpenStax College - CC-BY-3.0 Unported
5352 MK350 Series Survival Handbook
Color
Color
Version 20140410b - Not for distribution - © Copyright 2014 UPRtek All rights reserved
Versio 20140410b - Not for distribution - © Copyright 2014 UPRtek All rights reserved
Measuring Light
Why measure light?
A light bulb’s light quality can
vary signicantly and people
are discovering that it can in-
uence us emotionally, phys-
ically and even economically.
Light affects the way we work,
the way we feel and even the
way we sleep and wake.
However, these aspects of light
that affect our lives are not eas-
ily seen by the human eye and
we need a measuring device to
help us see things that we can’t
normally see.
Also, as humans, our eyes are
not all the same and the colors
we see may be slightly different
or even quite different than how
others see them. We can use a
light meter to help us agree on
colors.
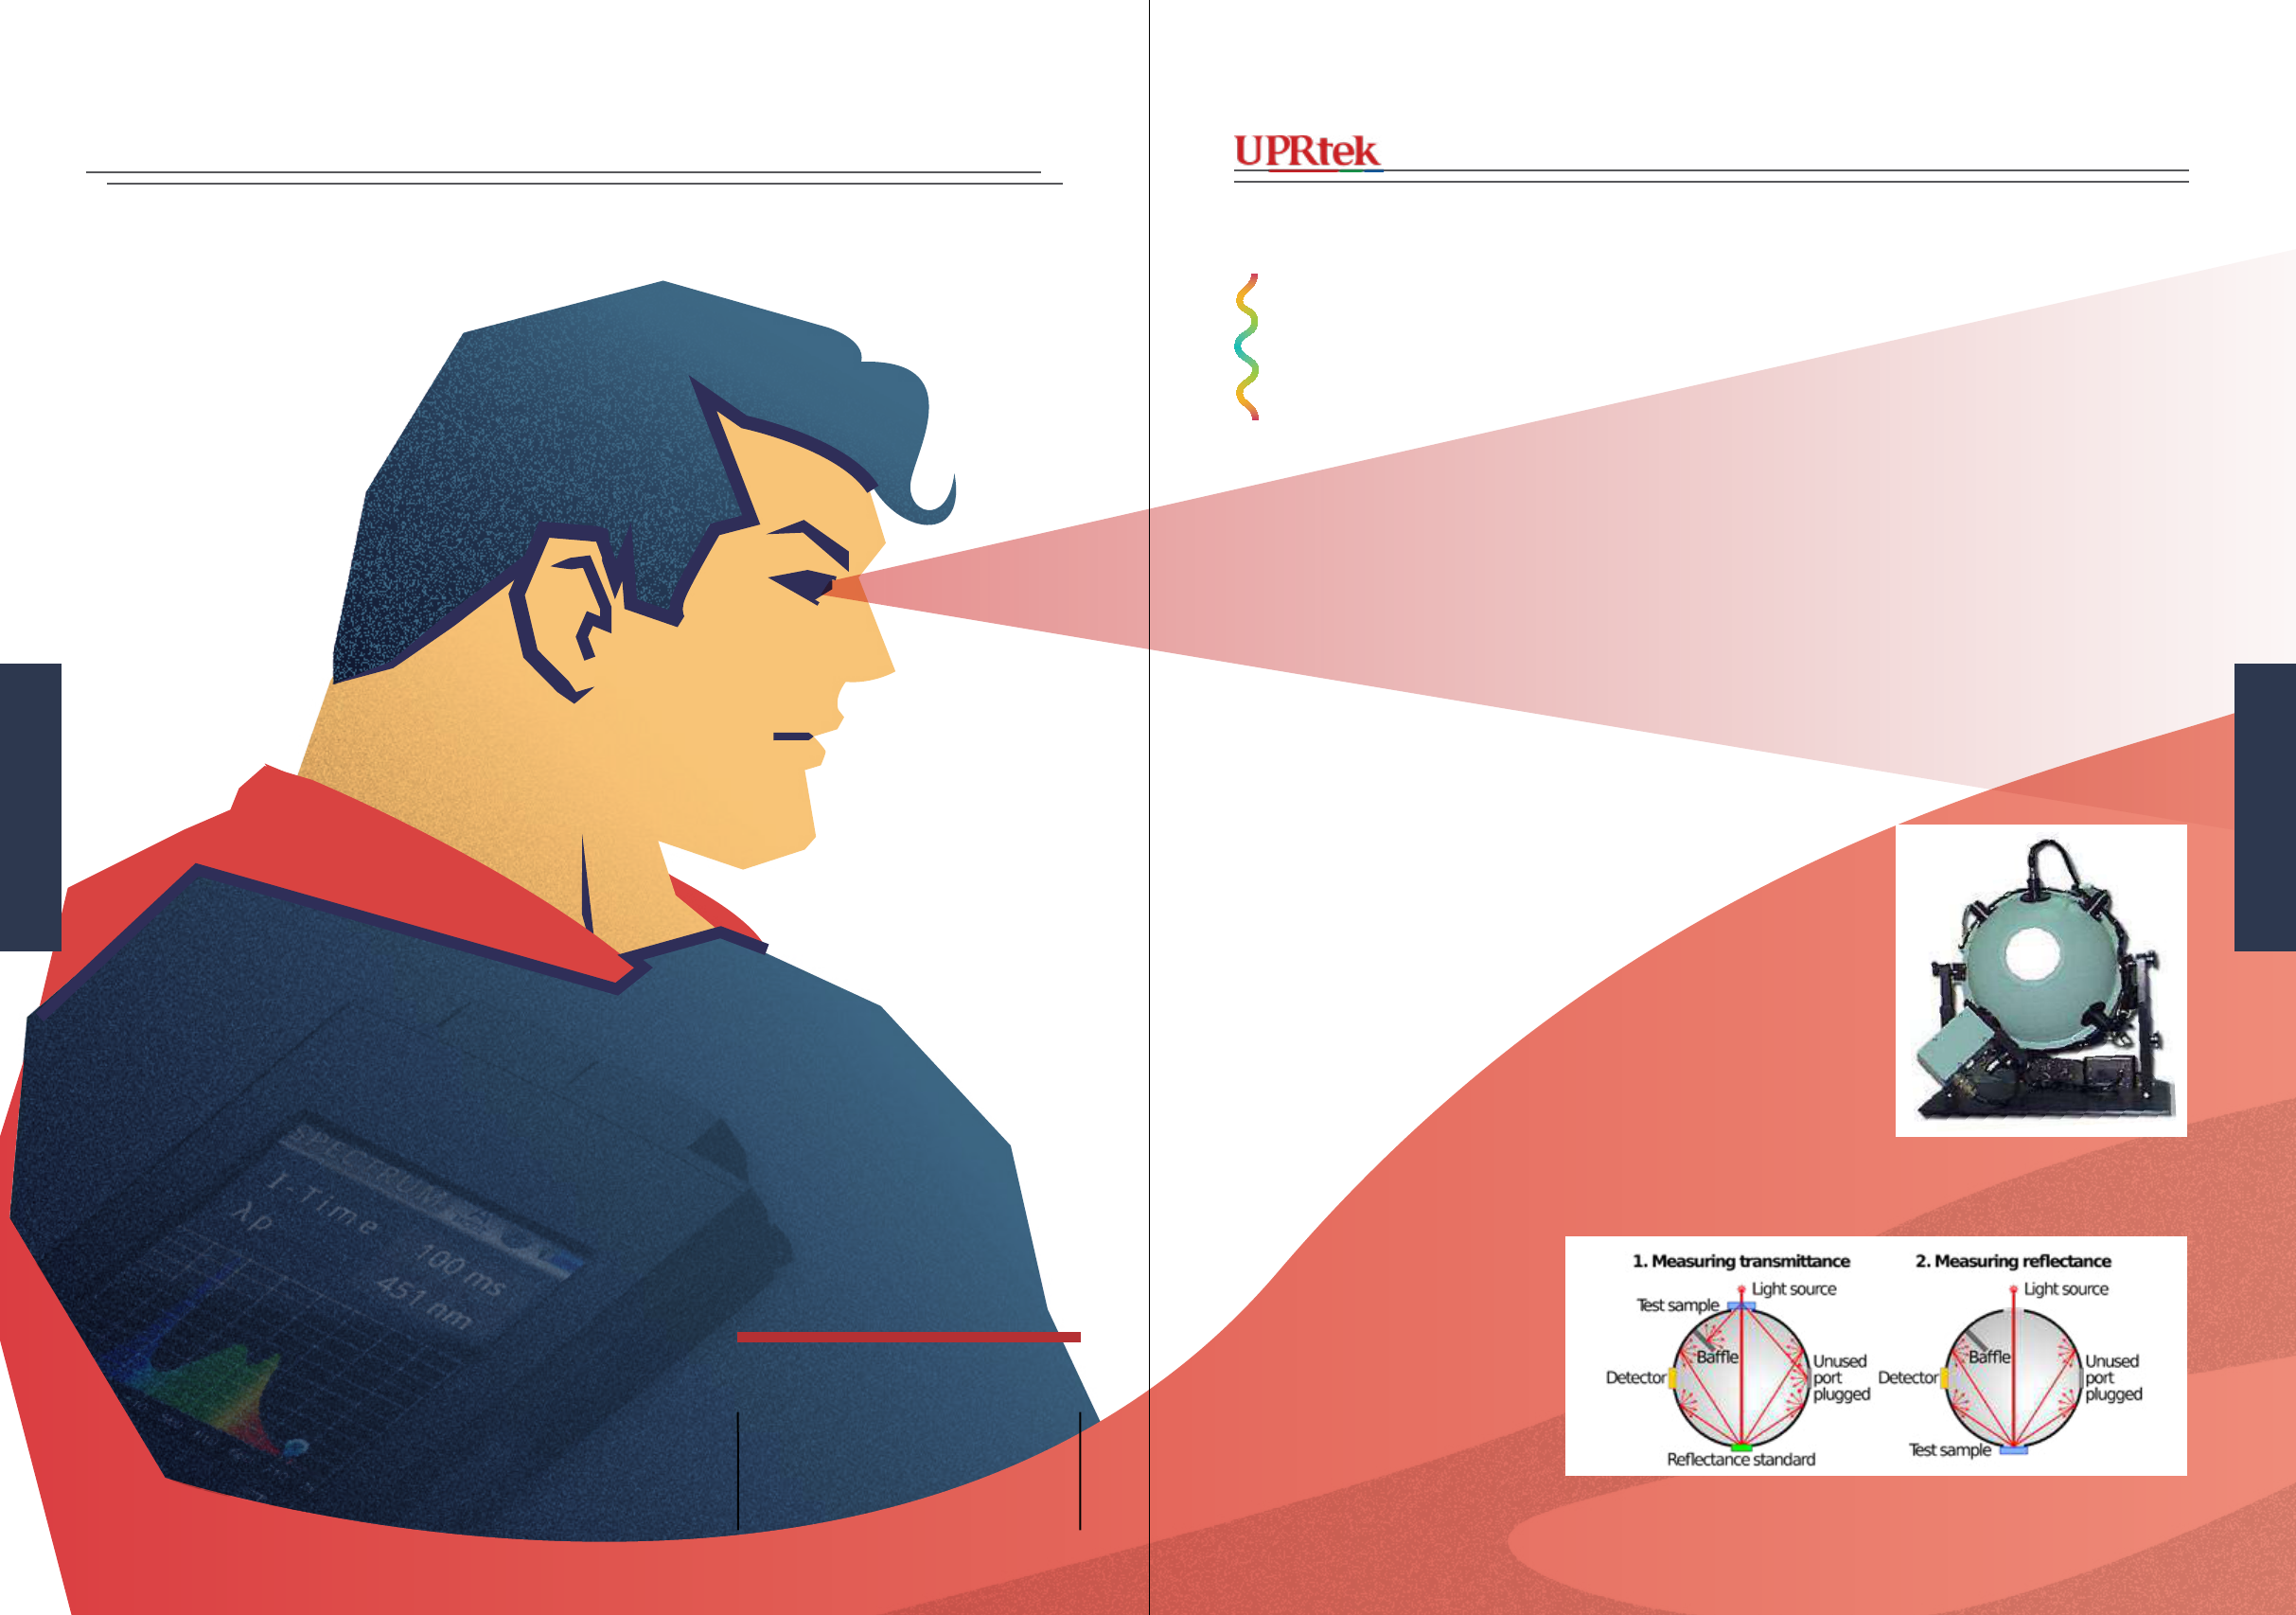
Traditional light measurement
equipment is expensive, immo-
bile, complicated and requires
By Electro Optical Industries Uploaded by The
Lamb of God at en.wikipedia -
CC-BY-SA-3.0 Wikimedia Commons
By Cmglee - Creative Commons Attribution-Share Alike 3.0 Unported
Superman Eyes
inordinate setup time including
the manpower needed to run
just one test on a single light
source. The main part is called
an Integrating Sphere and it
is still the most sophisticated
equipment for measuring light.
The idea of the inner sphere is
to provide a controlled environ-
ment for uniformly scattering
light and accurately measuring
the results.
The MK350 device is also a
light measuring device. Al-
though it admittedly cannot
compare with the integrating
sphere in terms of a controlled
and pristine environment, the
MK350 has shown remarkable
Photometry is the science of mea-
suring light
Spectrophotometry - measurement
of ux and spectral distribution.
TELL ME MORE
light measurement accuracy in
open space environments and
it’s practical uses and econom-
ic advantages make it nothing
short a revolutionary advance-
ment in light measurement
devices.
A light meter helps you see what you can’t normally see
with your own eyes.
Measuring Light
5554 MK350 Series Survival Handbook
Color
Measuring Light
Version 20140410b - Not for distribution - © Copyright 2014 UPRtek All rights reserved
Versio 20140410b - Not for distribution - © Copyright 2014 UPRtek All rights reserved
You may nd it strange that
white light color can be spec-
ied by a temperature - a bulb
may have a Color Temperature
of 2700 Kelvins - but there is a
close relationship between tem-
perature and light.
When you heat up an object like
an iron horseshoe, it begins to
slowly glow red, and then turn
yellow, and then white and nal-
ly blue. The cooler the tempera-
ture the more red; the hotter the
temperature the more blue (op-
posite of what we might think).
This relationship is important
because it’s a way to objectively
measure color - this relationship
was explained by Max Planck in
his famous Planck’s Law. An
LED bulb’s Color Temperature
(CT) is 3000K, means that when
you turn on the bulb, its light
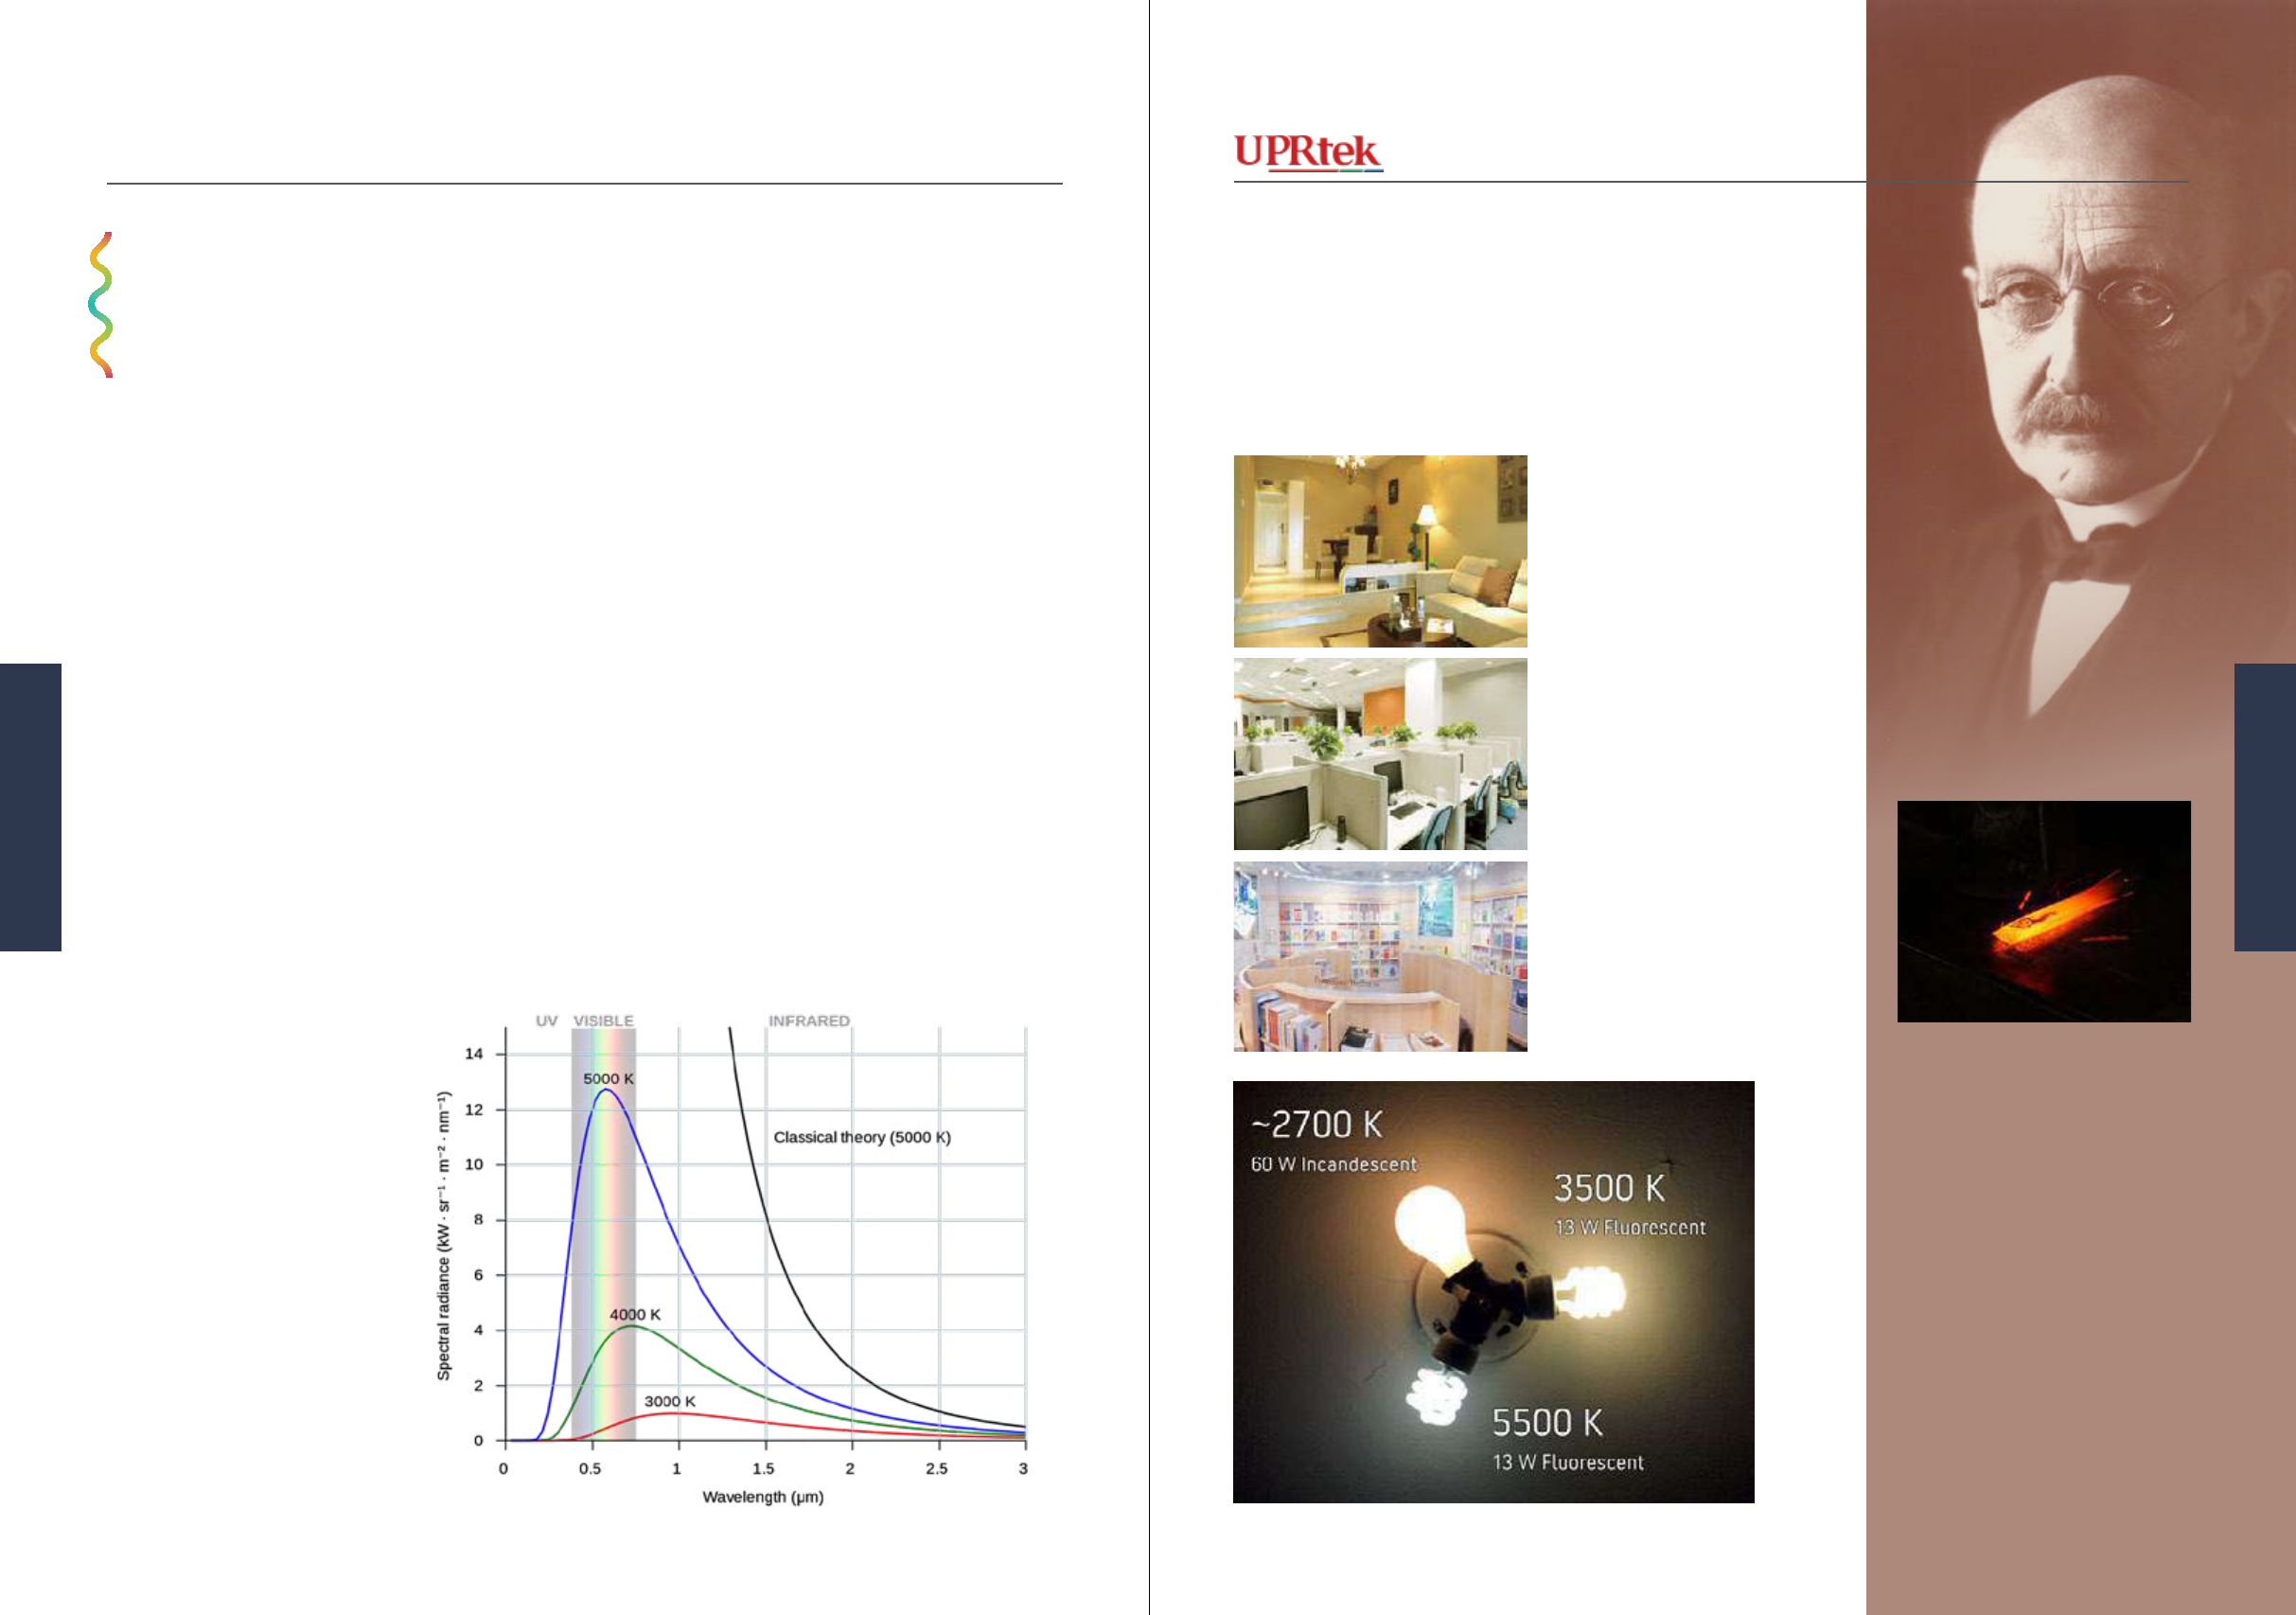
has the same color as an iron
horseshoe (for example) heated
to 3000K.
Of course, the amount of heat
to make something glow red-
yellow-blue-white will vary
somewhat on the matter being
Using Temperature to measure light color?
Incandescent Lights are based
on heat as we learned and are
natural Black Body Radiators
and so Color Temperature can
be specied quite accurately.
CFLs and LEDs are based on
Mercury Gas/Phosphor and
Semiconductors and so the CT
can only be approximated with-
in a certain range - these ranges
are called the Correlated Color
Temperatures, which can be
notoriously misleading (we’ll
explain why later).
Color Temperatures and Black Body Radiators
used (e.g. horseshoe). So a
theoretically, ideal matter was
conceived called the Black
Body - a perfect absorber,
absorbing 100% of light and
thus making it a perfect emitter
of heat radiation. Nothing is
really a perfect absorber, but
many objects that radiate light
using heat come close - the Sun,
a candle, an incandescent light.
Color Temperature is only
applicable to lights and in
lighting design it helps us to
gauge how cool or warm we
want our environment to look.
Generally, Color Temperatures
(CT) around 5,300K are called
cool colors (bluish white),
while lower color temperatures
around 3,300 K are called warm
colors (yellow to red). It is said
that people in hot tropical re-
gions prefer buying bulbs with
CT over 5,000K (to make it feel
a like a cooler bluish environ-
ment), while people in cooler
northern or southern regions
prefer bulbs with CT below
3000K (warmer-reddish looking
colors).
Warm Light
Around 3300K or below
Neutral Light
Around 3300K~5300K
Cool Light
Around 5300K or above
Using Temperature to measure light color?
By “Hi-Res Images of Chemical Elements” Creative Commons - Wiki-
media Commons Attribution 3.0 Unported
5756 MK350 Series Survival Handbook
Measuring Light
Measuring Light
Version 20140410b - Not for distribution - © Copyright 2014 UPRtek All rights reserved
Versio 20140410b - Not for distribution - © Copyright 2014 UPRtek All rights reserved
How does a device measure light?
So, we’ve seen how to use
temperature as a reference for
measuring color. However, it’s
only a theoretical model (Black
Body), used to measure white
light and it is very imprecise
with CFL and LED lighting. So
there must be another way of
measuring light.
Let’s take another look at
“Color”. Color, as we see it, is
inherently a human experience
- blue skies, red apples, green
trees form as images in our
brains. A device has no way
to sense “blue”, as much as it
cannot sense “sadness”, be-
cause “blue” and “sadness” are
How does a machine
know what colors
to display on a screen?
By the numbers.
inherently human experiences.
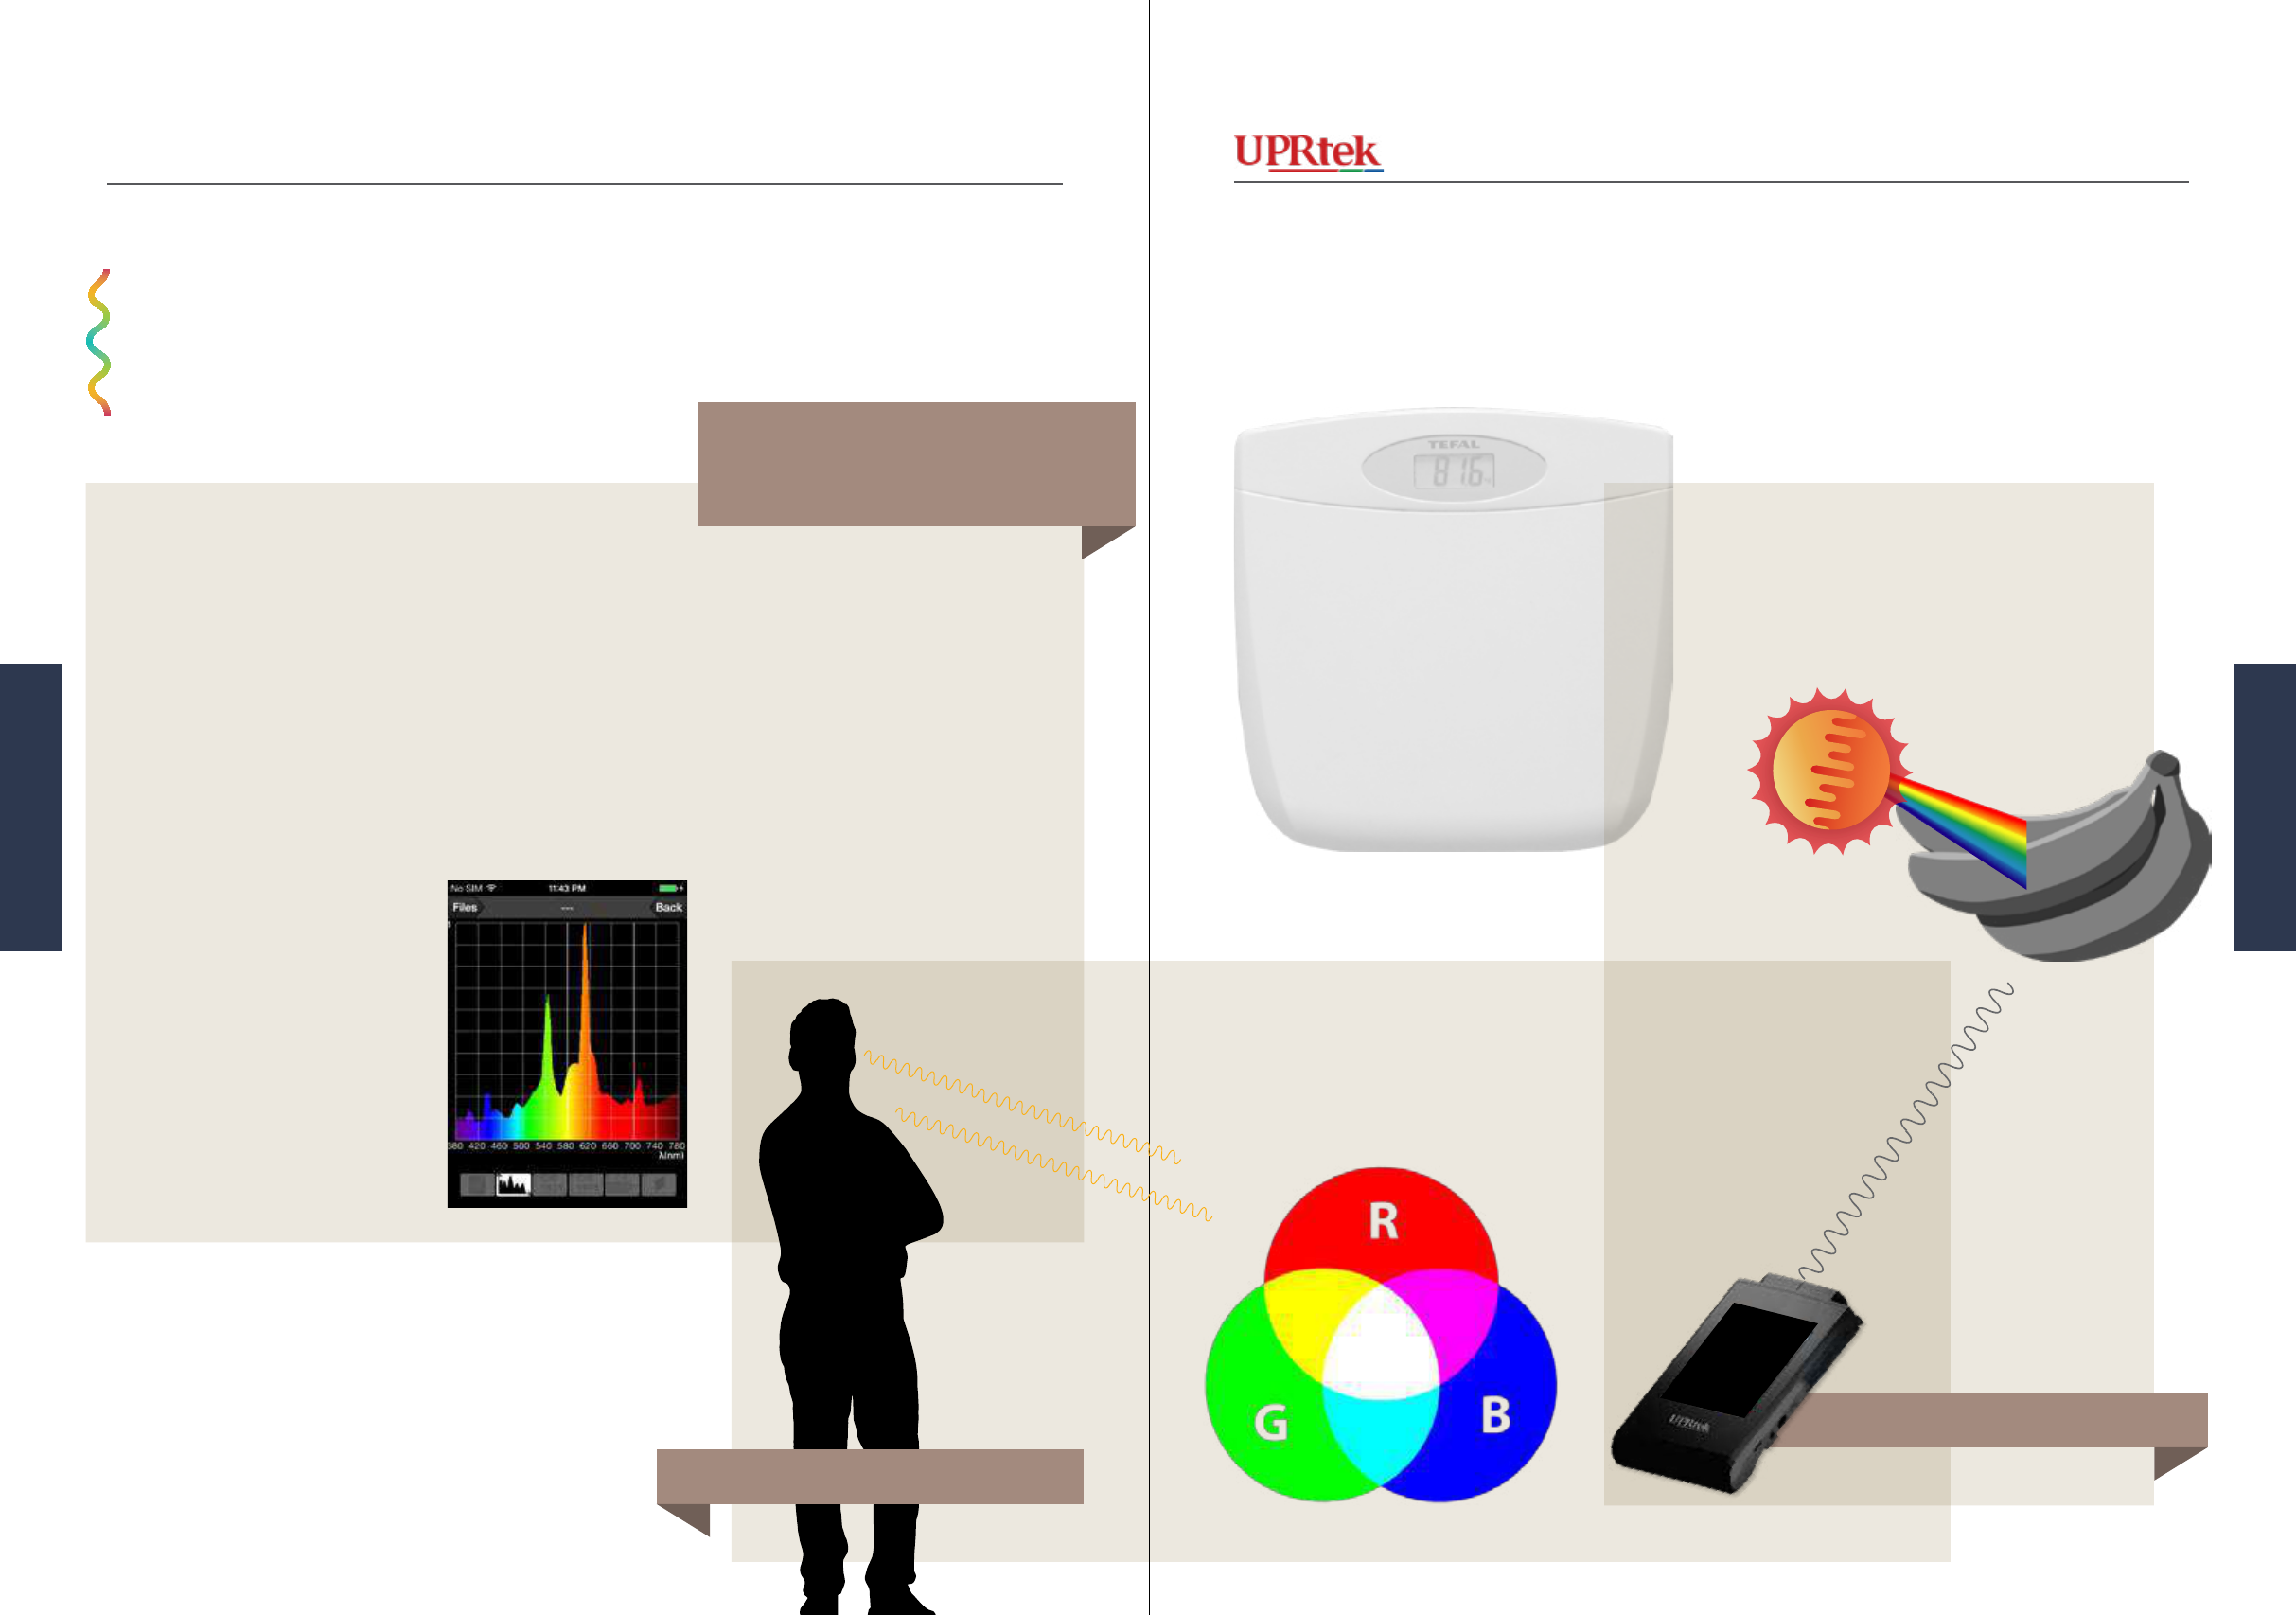
Devices, however, can measure in numbers - take your scale for
instance, which measures in kilograms or pounds. Light is the
same - a light meter device can measure light by its numbers -
i.e. wavelength, frequency and intensity. We can use these num-
bers to relate waves to our visual colors and an easy way to do
this is to use the primary colors of red-blue-green, conveniently
similar to our S, M and L cones. In other words, we can teach
our device to use RGB to relate “our” colors to wavelengths.
Yellow, what is yellow?
Waves? What waves?
How does a device measure light?
M.Minderhoud at nl.wikipedia - GFDL, CC-BY-SA 3.0 Unported - Wikimedia Commons
5958 MK350 Series Survival Handbook
Measuring Light
Measuring Light
Version 20140410b - Not for distribution - © Copyright 2014 UPRtek All rights reserved
Versio 20140410b - Not for distribution - © Copyright 2014 UPRtek All rights reserved
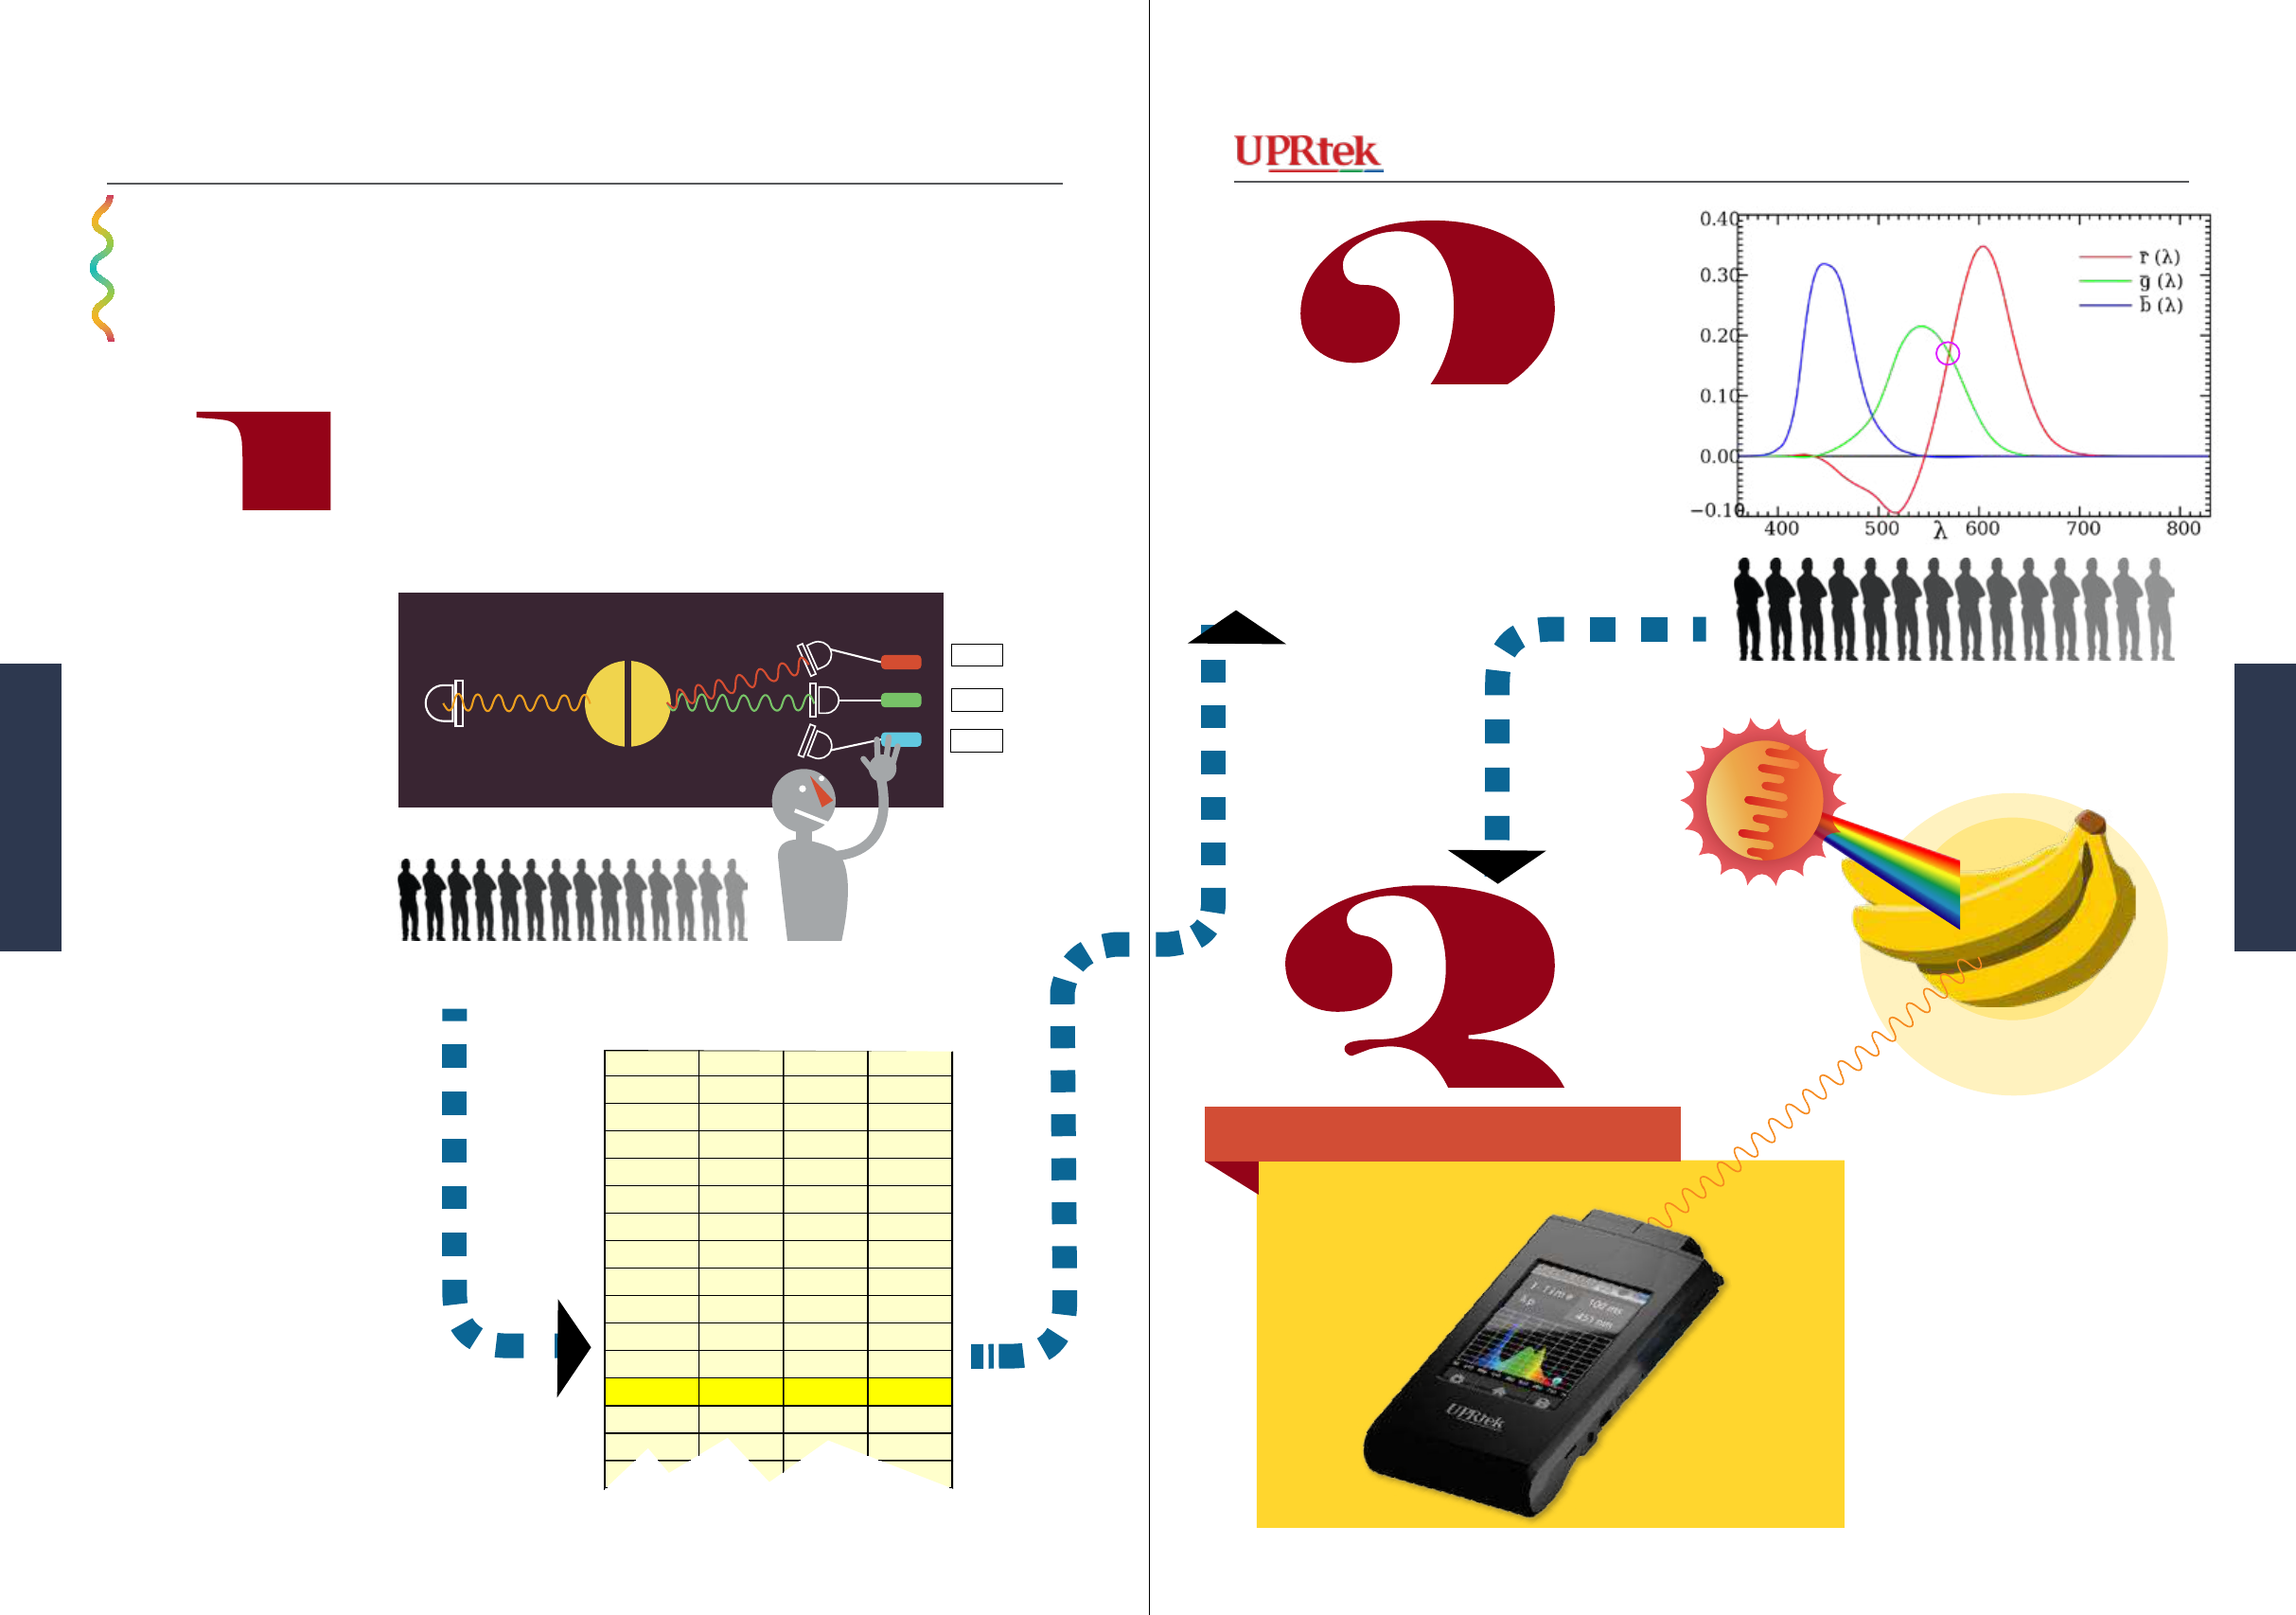
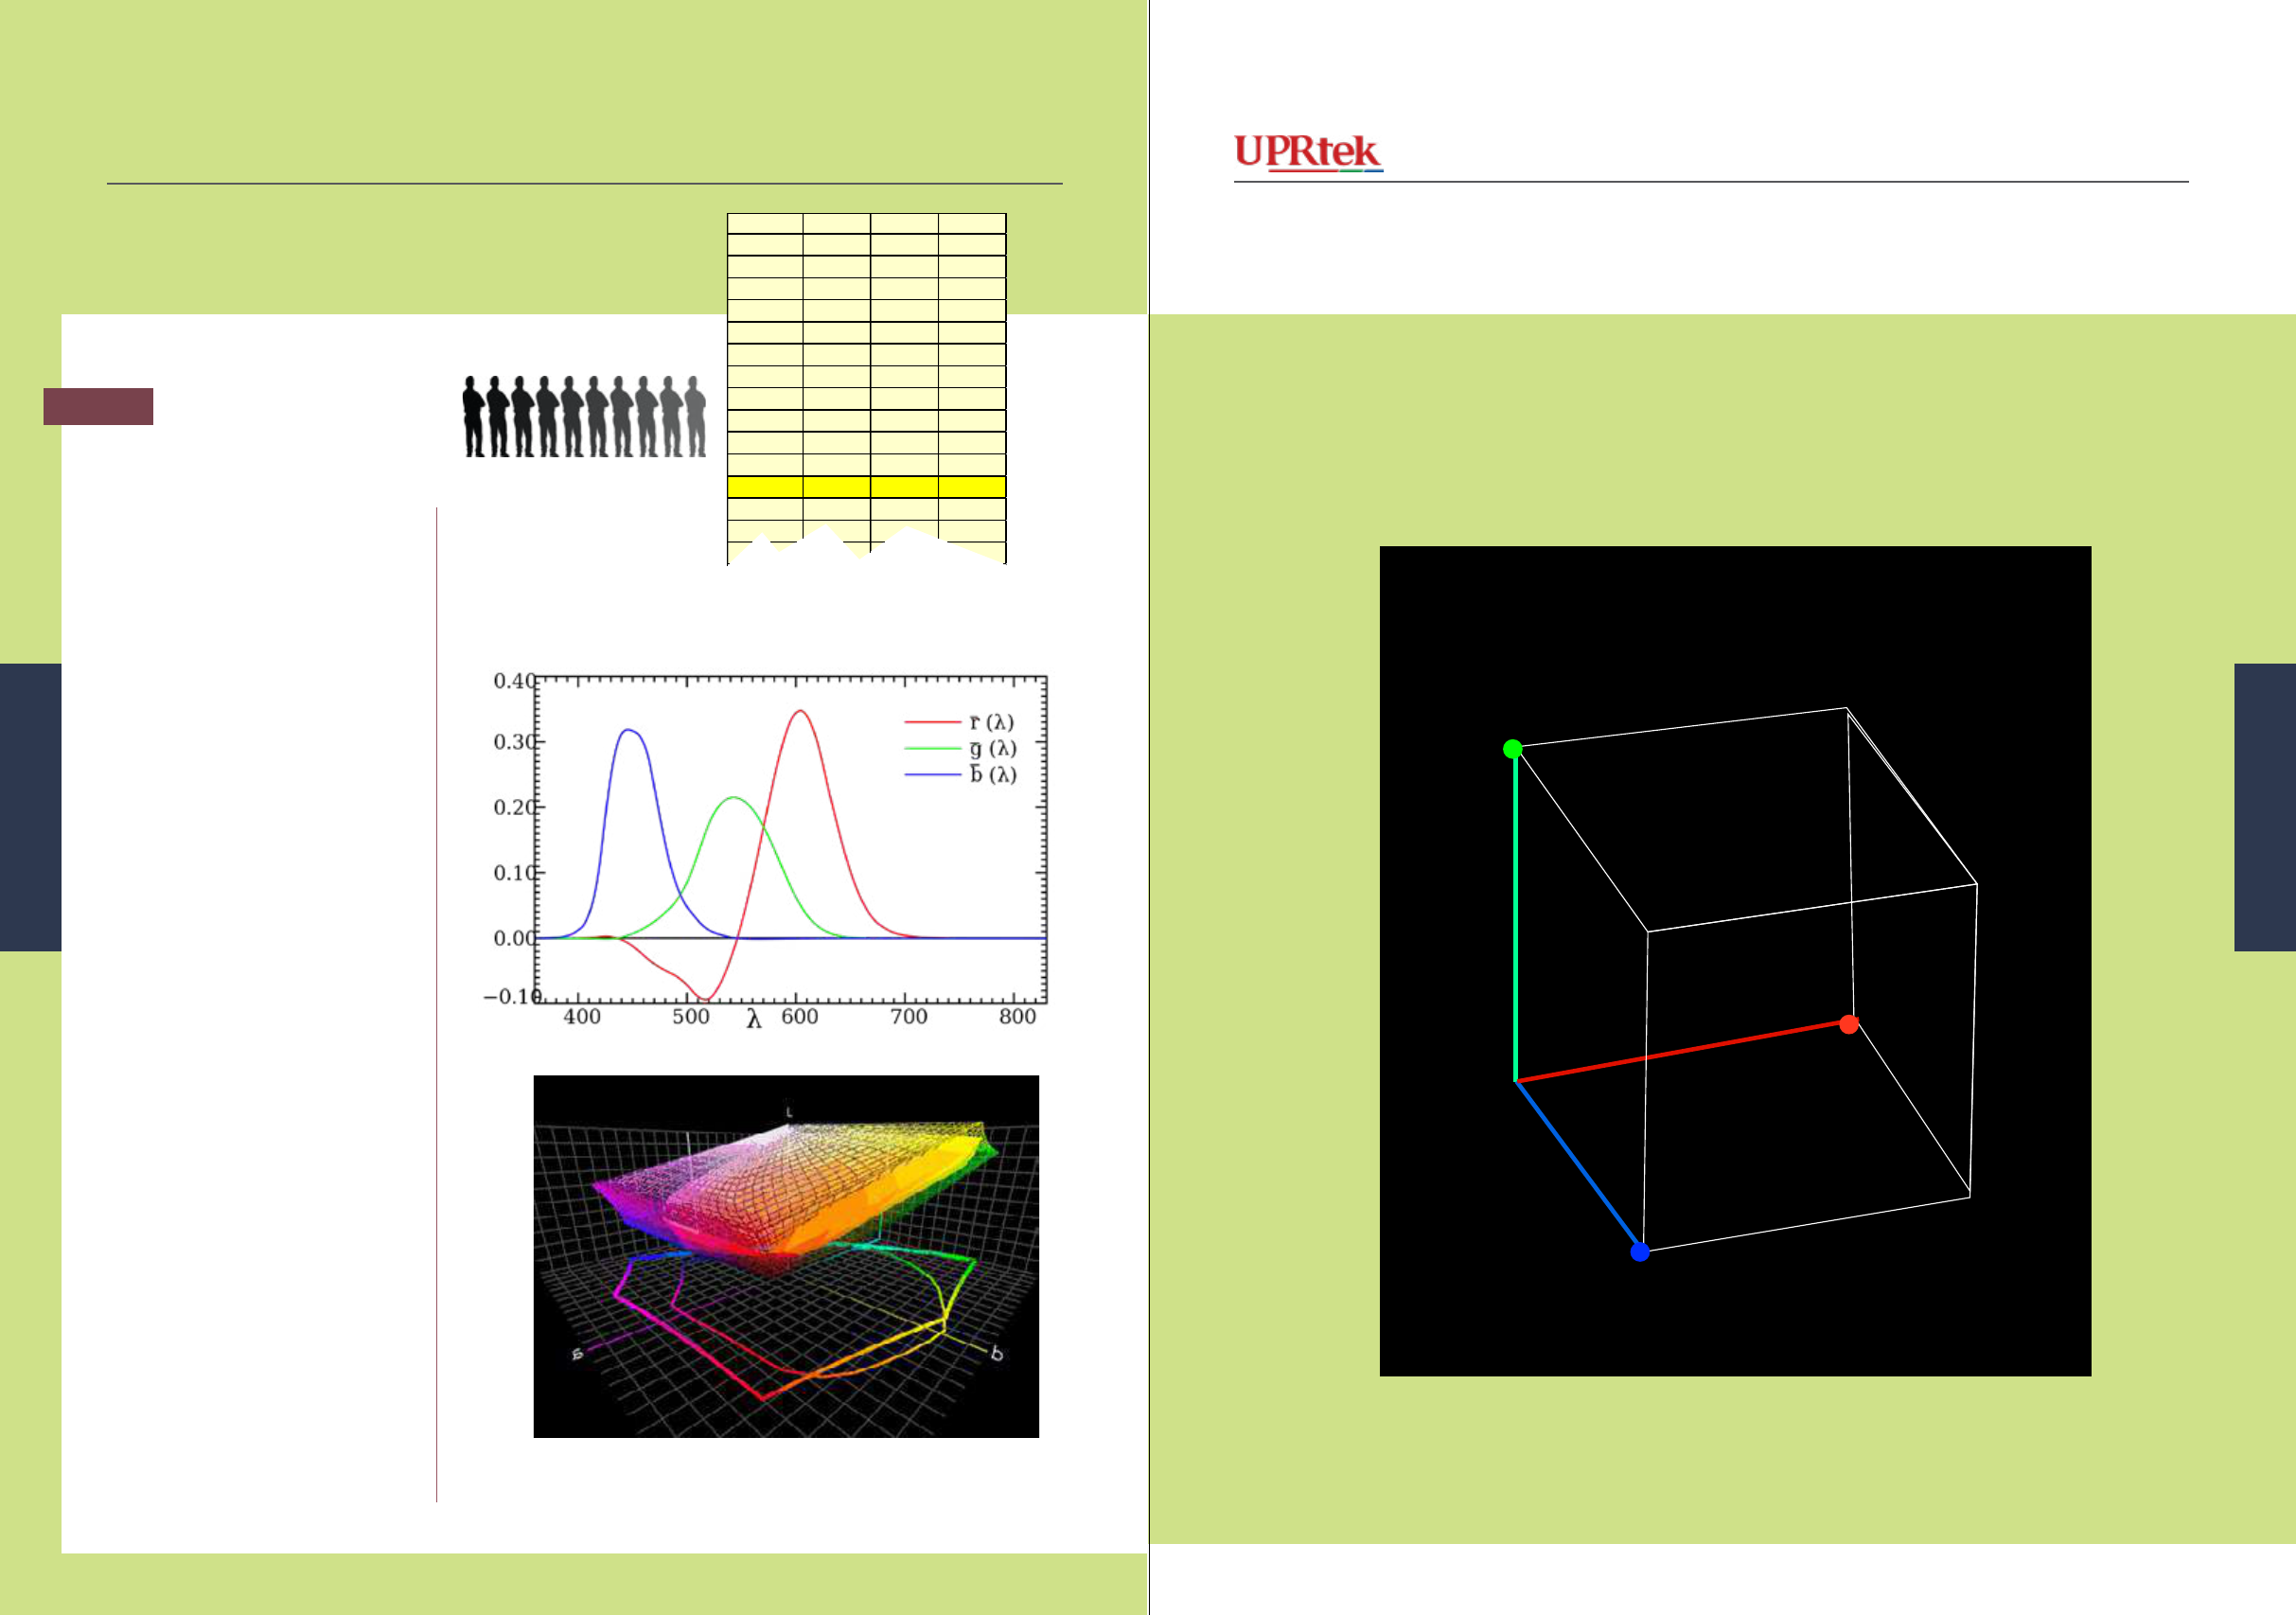
First, we need to take a light
with a certain wavelength, and
then have a tester adjust in-
tensity values of red, blue and
green lights to match the test
color to relate the wavelength
to human color perception.
This gives us 3 values (RGB)
to represent each color wave-
length that we want to test.
However, since we all see
colors a little differently, we
need to include many testers,
record their data and then take
an average.
Matching wavelengths
to colors
Take the data, which is in sets of 3 RGB values per
wavelength and graph it on a 2D plane - this graph
makes the connection between wavelengths and
RGB values that humans perceive. For a Wave-
length of 580 (yellow), we see that equal parts of
Red and Green are used (circle on graph).
These tests were real experiments performed
in 1926 by William David Wright and John Guild.
The Matching Function
Step
Step
Matching Wavelengths to Colors
Test color - 580nm
100%
100%
0%
R 700nm
G 546.1nm
B 435.8nm
r g b
λ
380 0.0272 -0.0115 0.9843
385 0.0268 -0.0114 0.9846
390 0.0263 -0.0114 0.9851
395 0.0256 -0.0113 0.9857
400 0.0247 -0.0112 0.9865
405 0.0237 -0.0111 0.9874
410 0.0225 -0.0109 0.9884
415 0.0207 -0.0104 0.9897
420 0.0181 -0.0094 0.9913
425 0.0142 -0.0076 0.9934
430 0.0088 -0.0048 0.9960
435 0.0012 -0.0007 0.9995
440 -0.0084 0.0048 1.0036
445 -0.0213 0.0120 1.0093
450 -0.0390 0.0218 1.0172
Step
Oh, that’s yellow!
This device can use the
matching data we just cre-
ated. When it encounters
a wavelength of 580 nm, it
can adjust its RGB screen
lights and display the prop-
er color on its screen.
6160 MK350 Series Survival Handbook
Measuring Light
Measuring Light
Version 20140410b - Not for distribution - © Copyright 2014 UPRtek All rights reserved
Versio 20140410b - Not for distribution - © Copyright 2014 UPRtek All rights reserved
It’s Like
The Chromaticity Diagram
Identifying, Specifying and Comparing Light
OK, we’ve taught our light meter to
recognize colors. Now, it would be
nice to be able to take a measure-
ment of any light source and then
identify it, specify it and perhaps
compare it to other lights.
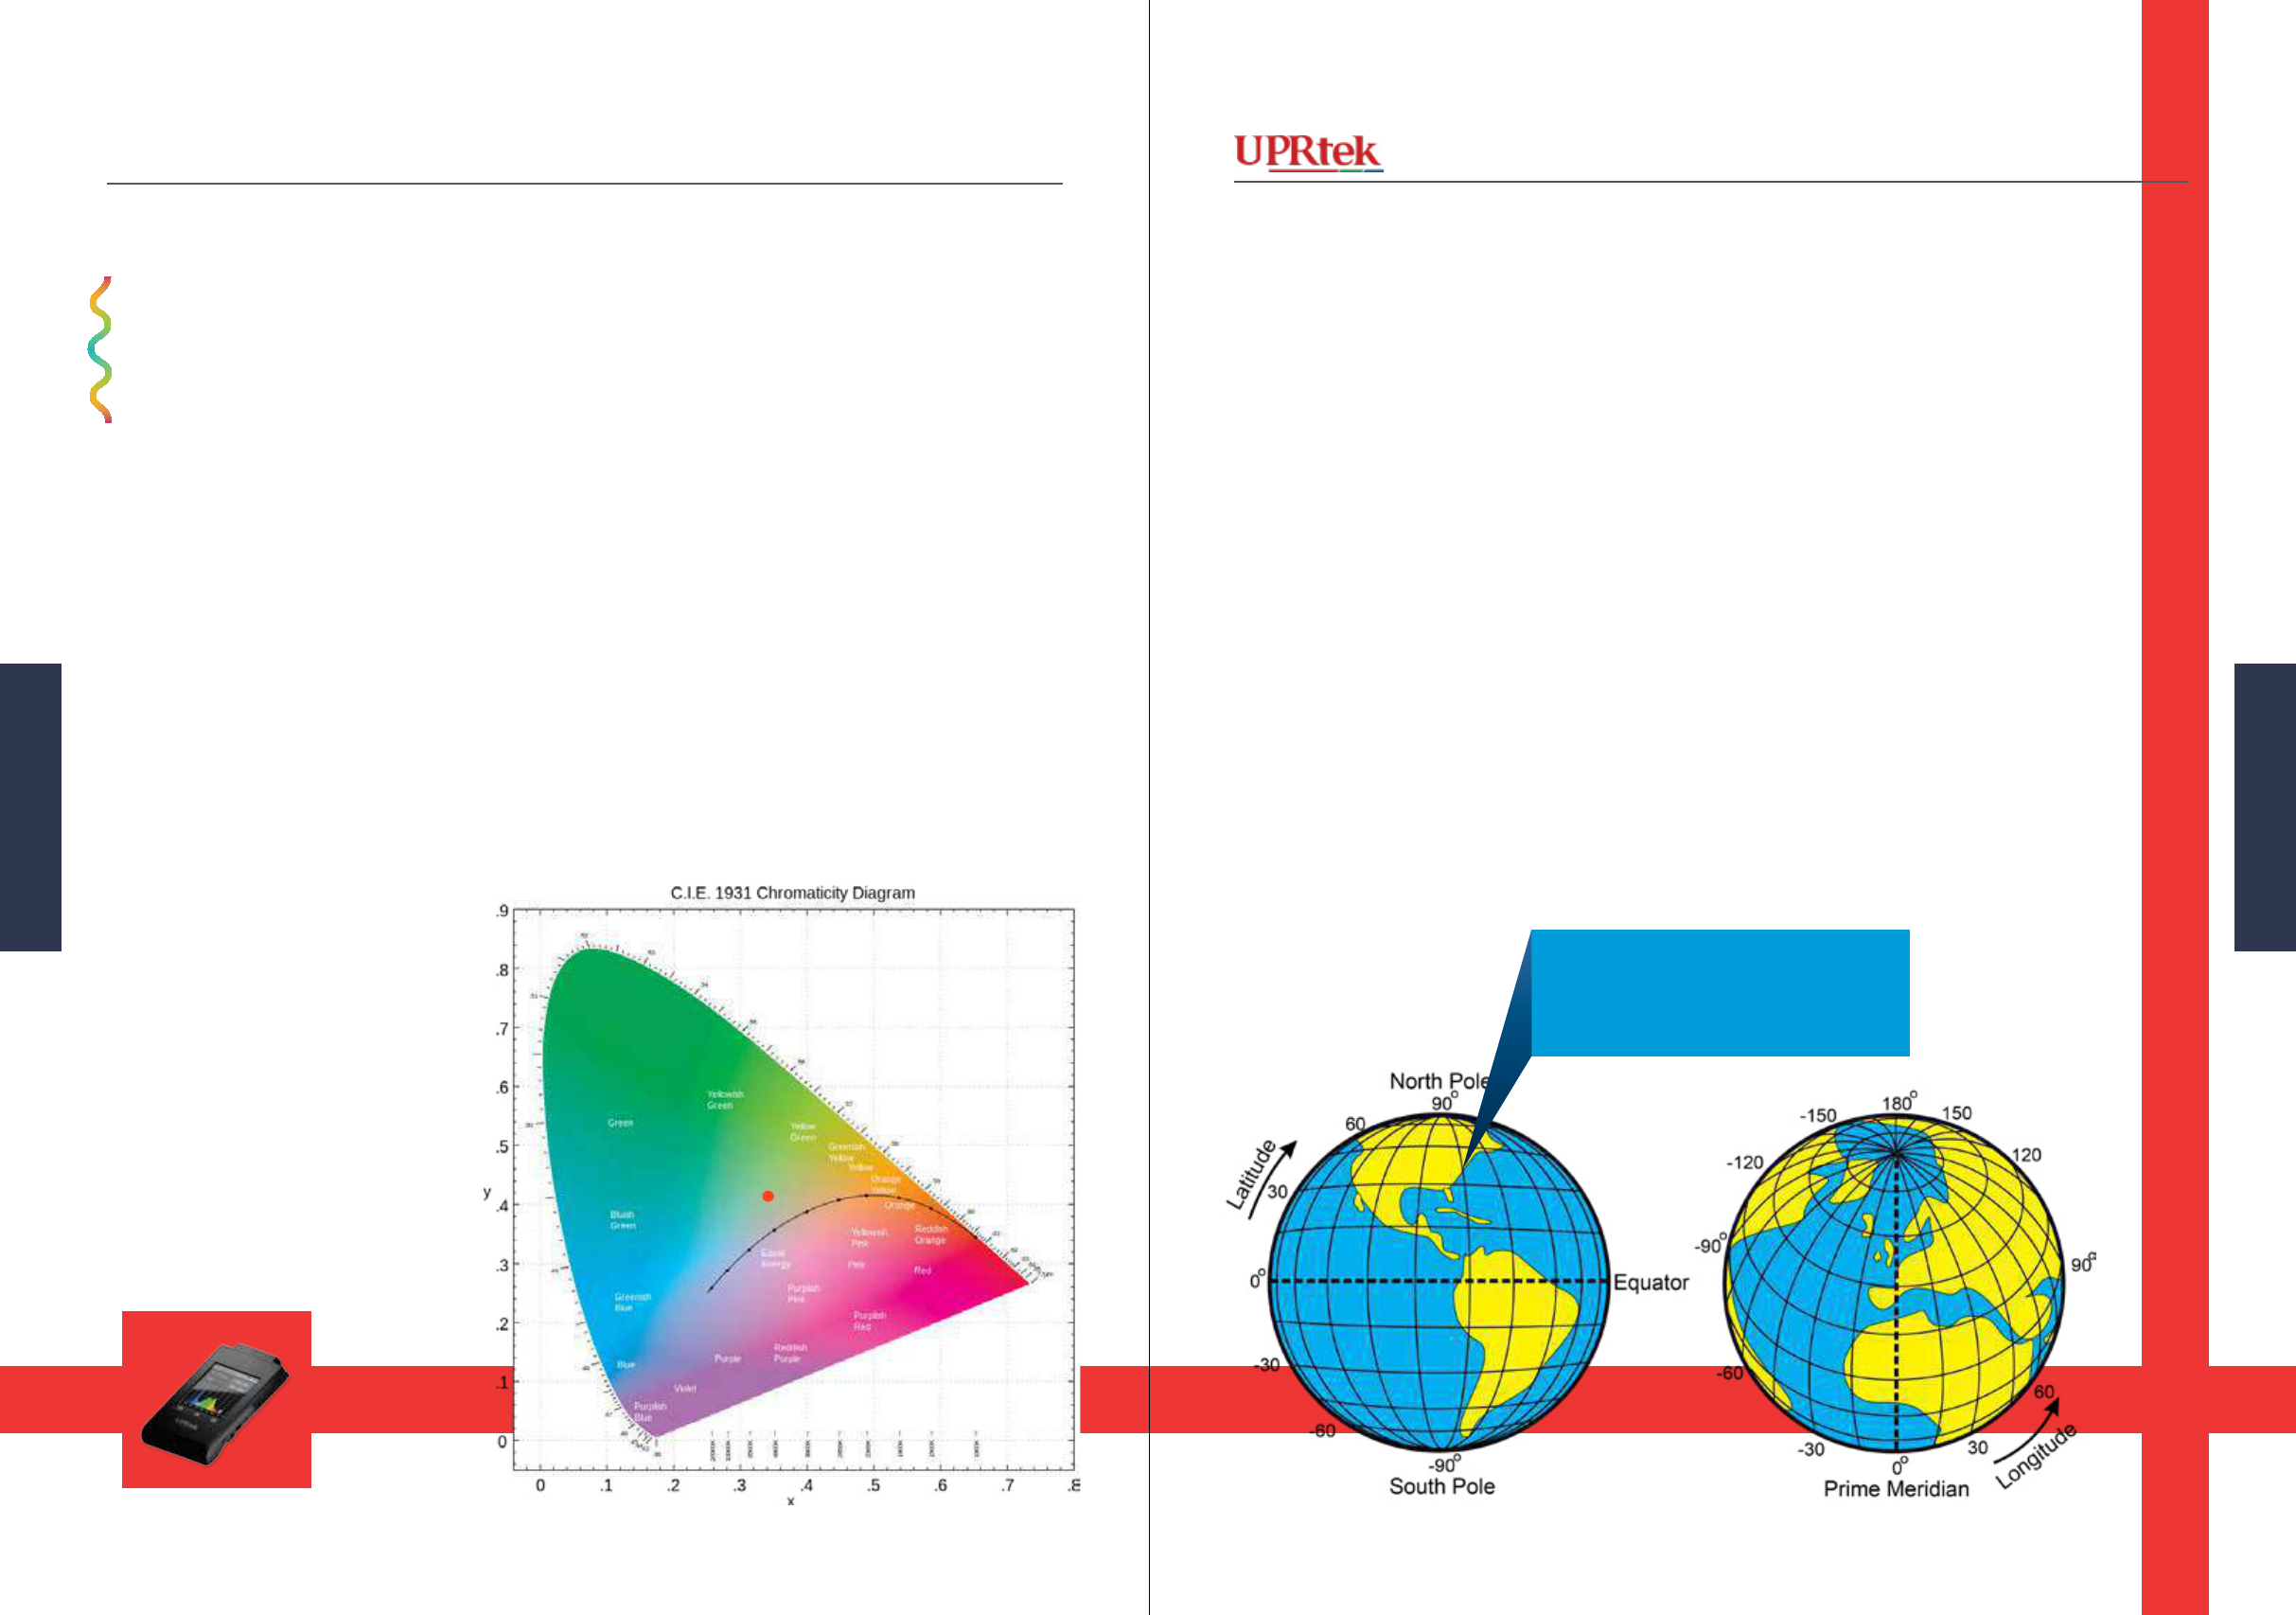
We do this with a color map called
the Chromaticity Diagram (Chroma
is the Greek word for color) and it’s
an important part of a light meter.
It’s like a map of our globe - if you
know the Longitude and Latitude,
you can identify any place on Earth.
Similarly, if you know your x,y col-
or coordinates, you can nd where
your light color lies compared to all
the other colors we can see - and by
the way, the colors contained within
the map are all of the colors humans
can visualize and this map is called
Chromaticity Diagram.
NY - Broadway and 42nd Street
40 45’ 21” N latitude
73 59’ 11” W longitude.
The Chromaticity Diagram - CIE 1931
Fuzzypeg at en.wikipedia, derived from Paulschou at en.wikipedia - CC-BY-SA-3.9
Measuring your light source identies where your
light lies in the map of x,y coordinates.
x,y
6362 MK350 Series Survival Handbook
Measuring Light
Measuring Light
How the Chromaticity
Diagram Came About
How the Chromaticity Diagram Came About
r g b
λ
380 0.0272 -0.0115 0.9843
385 0.0268 -0.0114 0.9846
390 0.0263 -0.0114 0.9851
395 0.0256 -0.0113 0.9857
400 0.0247 -0.0112 0.9865
405 0.0237 -0.0111 0.9874
410 0.0225 -0.0109 0.9884
415 0.0207 -0.0104 0.9897
420 0.0181 -0.0094 0.9913
425 0.0142 -0.0076 0.9934
430 0.0088 -0.0048 0.9960
435 0.0012 -0.0007 0.9995
440 -0.0084 0.0048 1.0036
445 -0.0213 0.0120 1.0093
450 -0.0390 0.0218 1.0172
1
Version 20140410b - Not for distribution - © Copyright 2014 UPRtek All rights reserved
Versio 20140410b - Not for distribution - © Copyright 2014 UPRtek All rights reserved
How do we come up with these
x,y coordinates and the map?
Well, it’s a long story with lots
of math, but we’ll try to keep
it simple. This Chromaticity
Diagram was conceived in 1931
by the International Commis-
sion on Illumination or more
commonly referred to by its
French acronym CIE or the
Commission Internationale de
l’Eclairage.
It was designed to map the
entire human visible spectrum -
it gives us a standardized, easy,
visual tool to specify, identify
and compare colors. Do you
remember our RGB test val-
ues from before? We plotted
them on a 2D graph as shown
(top right). Now what we want
to do is put those same RGB
values on a 3D graph. Each
wavelength’s RGB data were
mapped as a point in 3D-Space
which produced the diagram
on the right, a beautiful but
not very useful map. So the
CIE folks did some fancy work
to make a 2D map, from a 3D
map.
Remember when the three RGB test values are plotted on a 2D
graph? It looks like the graph below.
If you plotted all of the RGB test values onto a 3D graph, then you
would get this. It’s hard to use a 3D map for color identication
because your color might lie in the middle.
Test Color - 580 nm
100 %
0 %
100 %
R 700 nm
G 546.1 nm
B 435.8 nm
1,1,0
1
1
1
.5, .5, 0
.33, .33, .33
0, 0, 0
.5, .5, 0
x
y
1
1
1
1
1
1
1,1,0
1,1,0
1,1,1
1,1,0
1,1,1
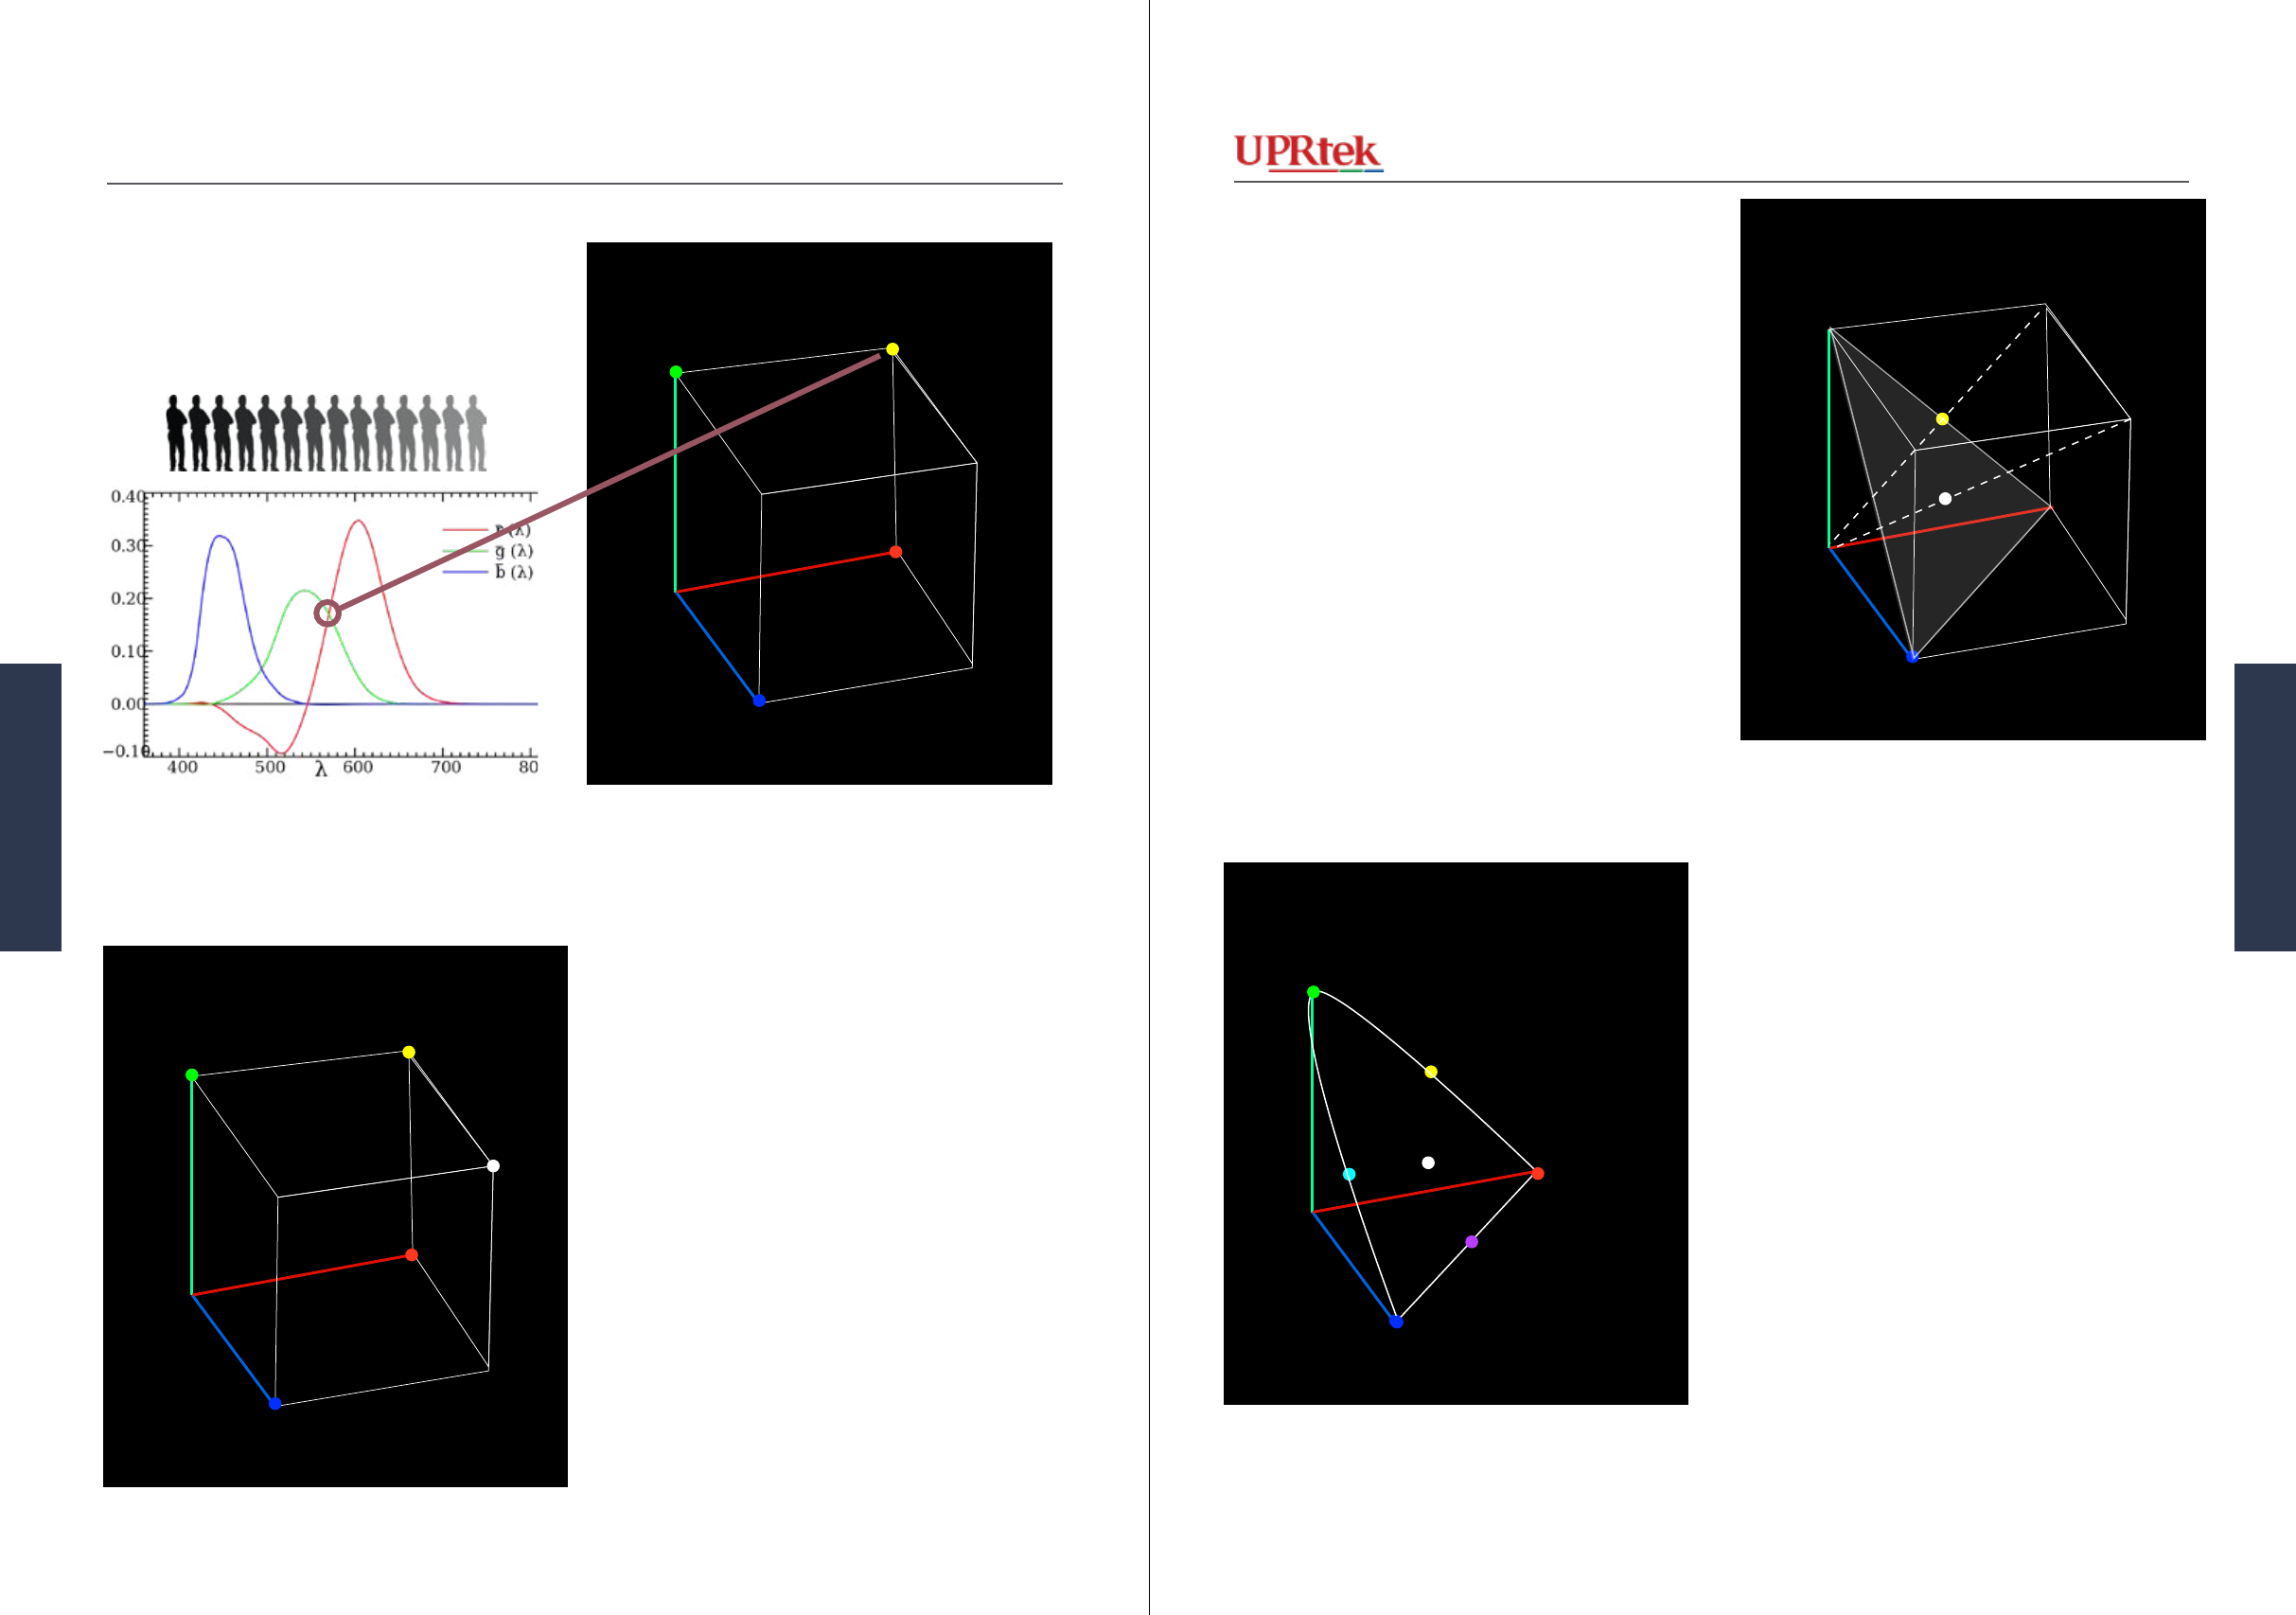
Let’s rst draw a 3D space. Each axis represents one of the primary col-
ors of Red, Blue and Green. The ends of each axis represent the highest
intensity from the each RGB test data set, which we will show as 1.
6564 MK350 Series Survival Handbook
Measuring Light
Measuring Light
Version 20140410b - Not for distribution - © Copyright 2014 UPRtek All rights reserved
Versio 20140410b - Not for distribution - © Copyright 2014 UPRtek All rights reserved
2
Test Color - 580 nm
100 %
0 %
100 %
R 700 nm
G 546.1 nm
B 435.8 nm
1,1,0
1
1
1
.5, .5, 0
.33, .33, .33
0, 0, 0
.5, .5, 0
x
y
1
1
1
1
1
1
1,1,0
1,1,0
1,1,1
1,1,0
1,1,1
Now let’s plot our yellow wave-
length (580 nm), which is full red,
full green and no blue (1,1,0)
3
Let’s take our “White”, which is a
combination of 100% Red, 100%
Green and 100% Blue and plot that.
Imagine doing this for all our RGB
points for each wavelength.
Test Color - 580 nm
100 %
0 %
100 %
R 700 nm
G 546.1 nm
B 435.8 nm
1,1,0
1
1
1
.5, .5, 0
.33, .33, .33
0, 0, 0
.5, .5, 0
x
y
1
1
1
1
1
1
1,1,0
1,1,0
1,1,1
1,1,0
1,1,1
Next (this is the magical part),
make a triangle by connecting 3
three points that each represent
100% intensity at each primary
color (RGB) - this is a plane called
the Unit Plane - if you take a single
point on the plane and add up the
three associated data values, they
will always add up to 1. If you
draw a line between each RGB
point that we plotted (in step 3) and
the origin (0,0,0), it intersects our
Unit Plane and creates a new point.
This point represents the same pro-
portions as the original point and so
it is essentially the same color.
4
5
Now imagine all the wavelength
RGB points mapped to the Unit
plane - what will you get? A
horse-shaped Chromaticity Dia-
gram!
Test Color - 580 nm
100 %
0 %
100 %
R 700 nm
G 546.1 nm
B 435.8 nm
1,1,0
1
1
1
.5, .5, 0
.33, .33, .33
0, 0, 0
.5, .5, 0
x
y
1
1
1
1
1
1
1,1,0
1,1,0
1,1,1
1,1,0
1,1,1
Test Color - 580 nm
100 %
0 %
100 %
R 700 nm
G 546.1 nm
B 435.8 nm
1,1,0
1
1
1
.5, .5, 0
.33, .33, .33
.33, .33 .33
.5, .5, 0
x
y
1
1
1
1
1
1
1,1,0
1,1,0
1,1,1
1,1,0
1,1,1
6766 MK350 Series Survival Handbook
Measuring Light
Measuring Light
Version 20140410b - Not for distribution - © Copyright 2014 UPRtek All rights reserved
Versio 20140410b - Not for distribution - © Copyright 2014 UPRtek All rights reserved
6
Test Color - 580 nm
100 %
0 %
100 %
R 700 nm
G 546.1 nm
B 435.8 nm
1,1,0
1
1
1
.5, .5, 0
.33, .33, .33
0, 0, 0
.5, .5, 0
x
y
1
1
1
1
1
1
1,1,0
1,1,0
1,1,1
1,1,0
1,1,1
Test Color - 580 nm
100 %
0 %
100 %
R 700 nm
G 546.1 nm
B 435.8 nm
1,1,0
1
1
1
.5, .5, 0
.33, .33, .33
0, 0, 0
.5, .5, 0
x
y
1
1
1
1
1
1
1,1,0
1,1,0
1,1,1
1,1,0
1,1,1
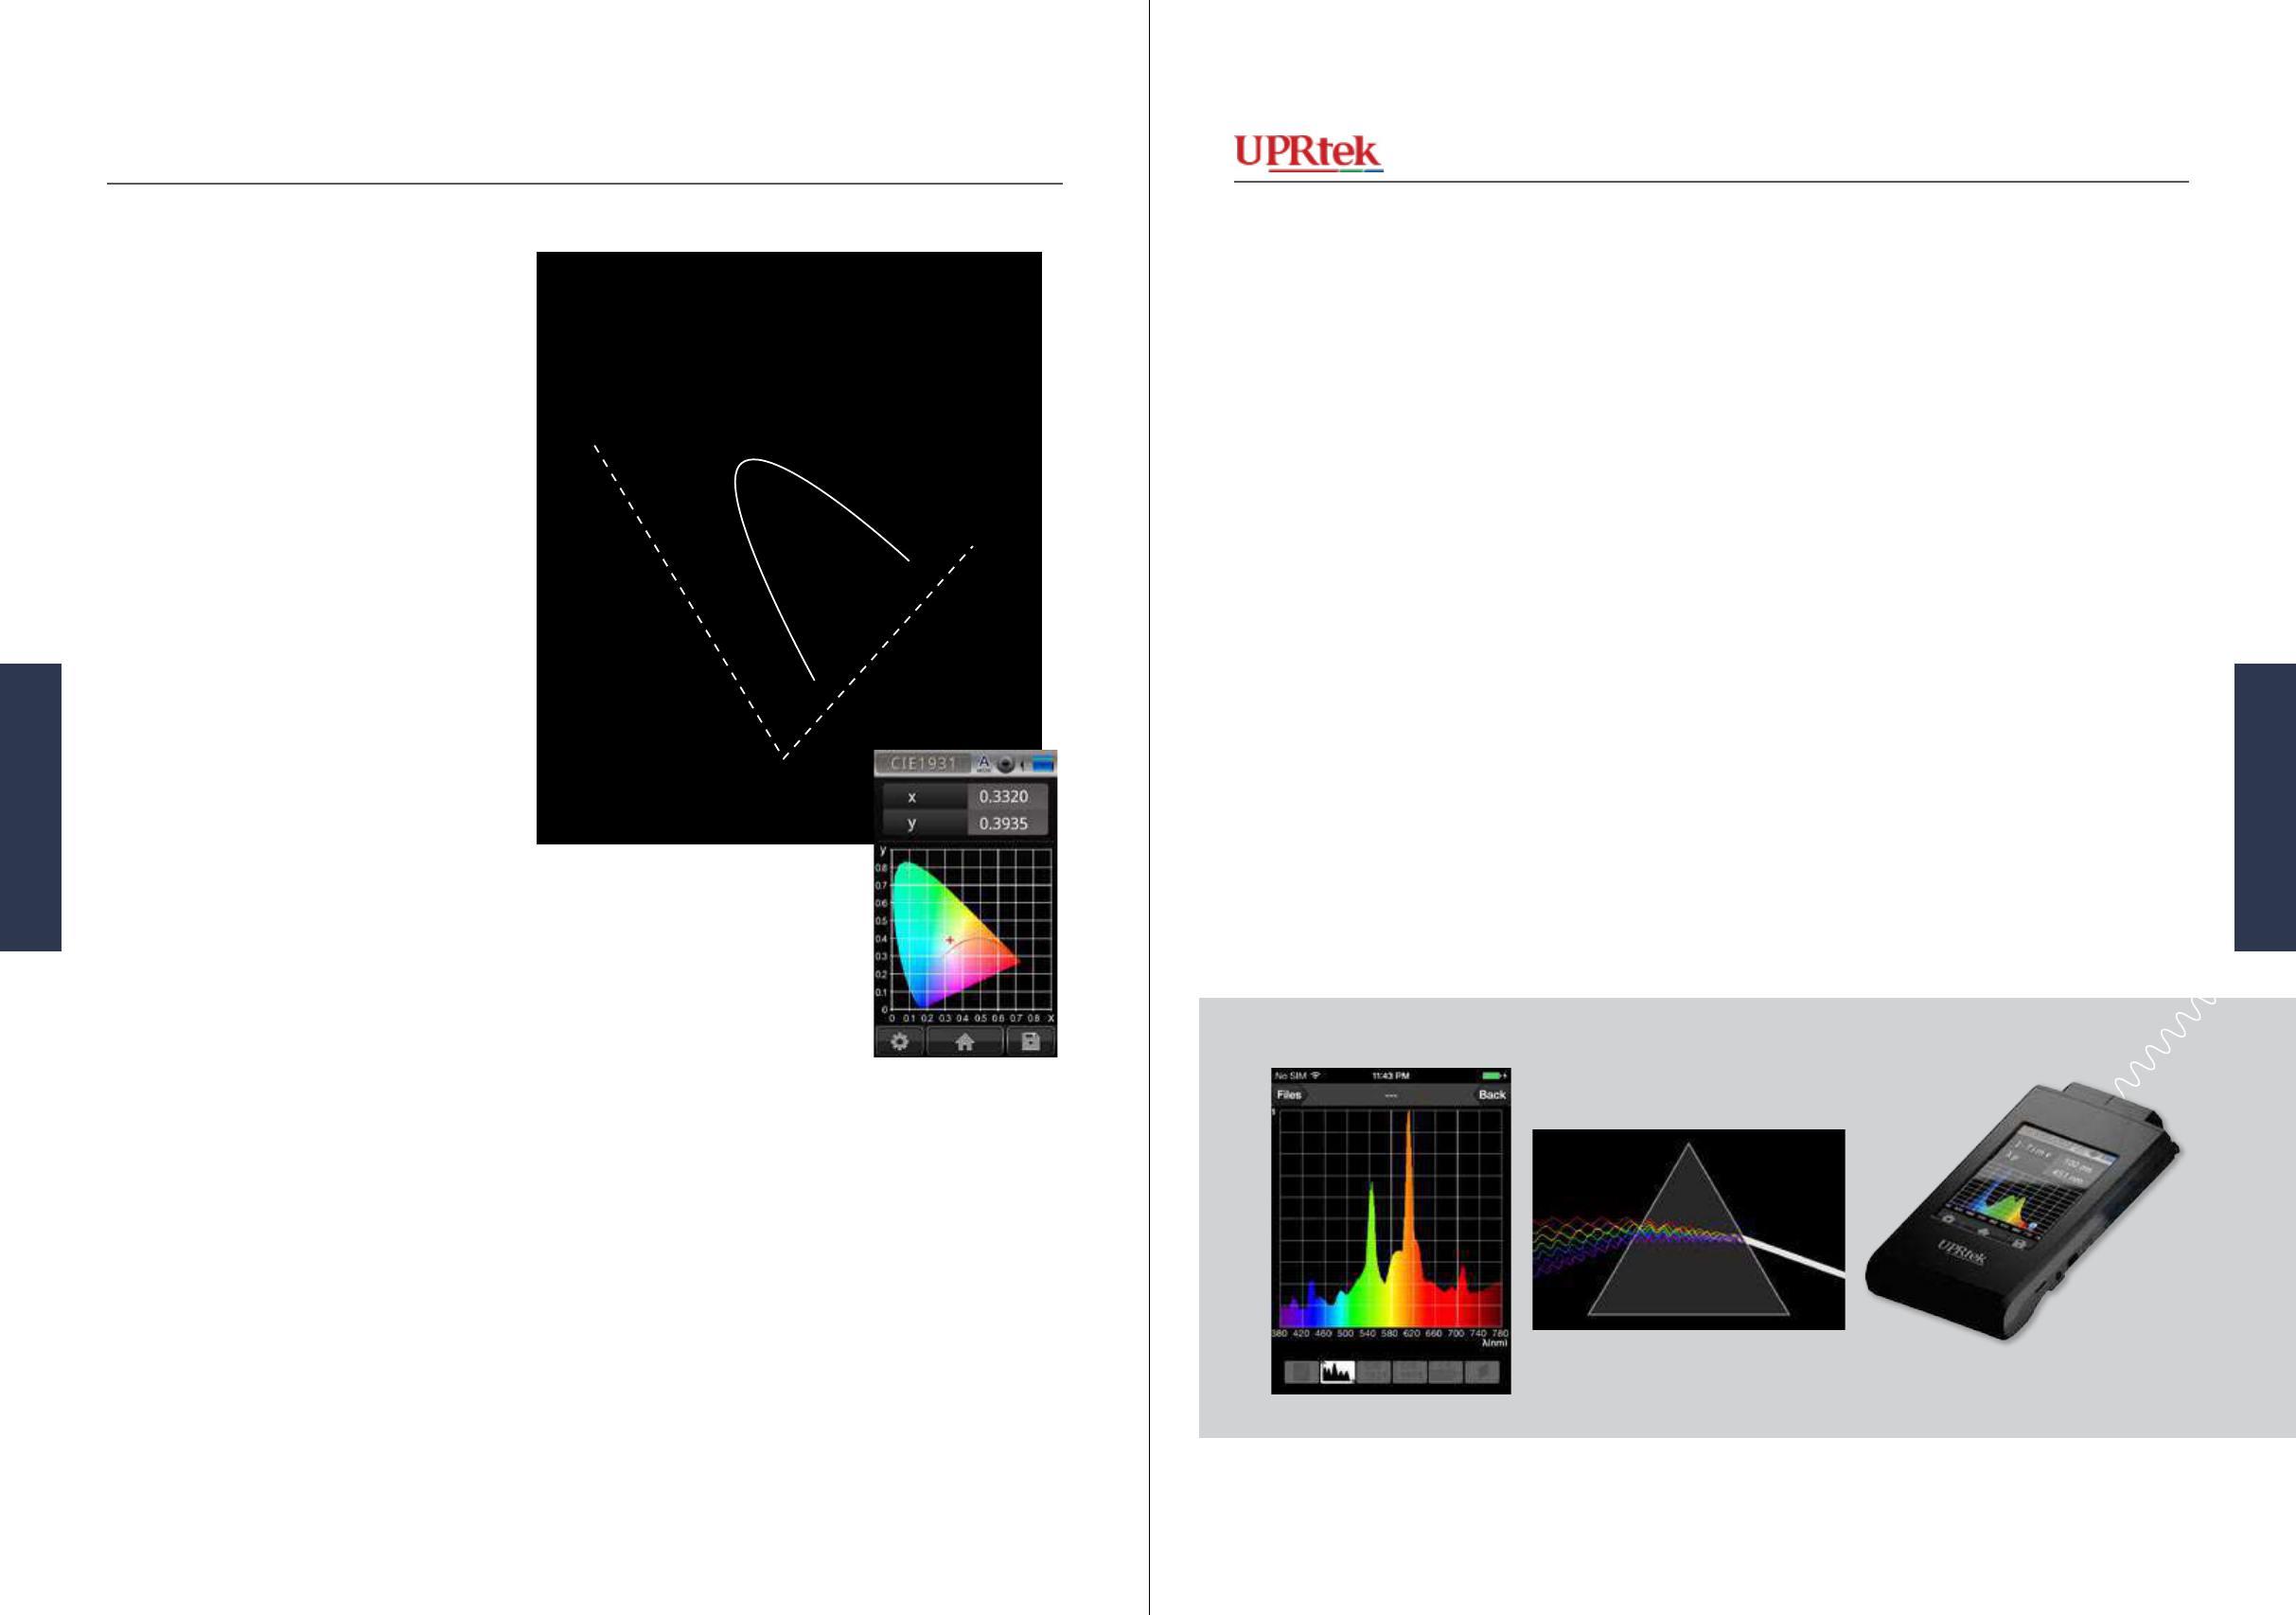
Since our Unit Plane is a 2D
plane, we can now assign it an x,y
axis. This is where the horse-shoe
shaped CIE Chromaticity Diagram
comes from.
Take Home
1. The horseshoe shaped diagram is a
“map” all of the colors that human
beings can visualize.
2. If you measure a light source, it can
give you an x,y coordinate which tells
you where in our map your light color
resides
3. The x,y coordinates are derived from
data from the original 1926 RGB
Human Experiments. They represent
RGB data values that have been math-
ematically condensed from 3D to a 2D
plane because it is much easier to work
with.
NOTE
The previous explanation is a conceptual description of the
creation of the Chromaticity Diagram. For additional informa-
tion see Appendix I
http://www.youtube.com/watch?v=82ItpxqPP4I
http://www.biyee.net/color-science/cie-chromaticity-diagram/
Watch a Video
Play
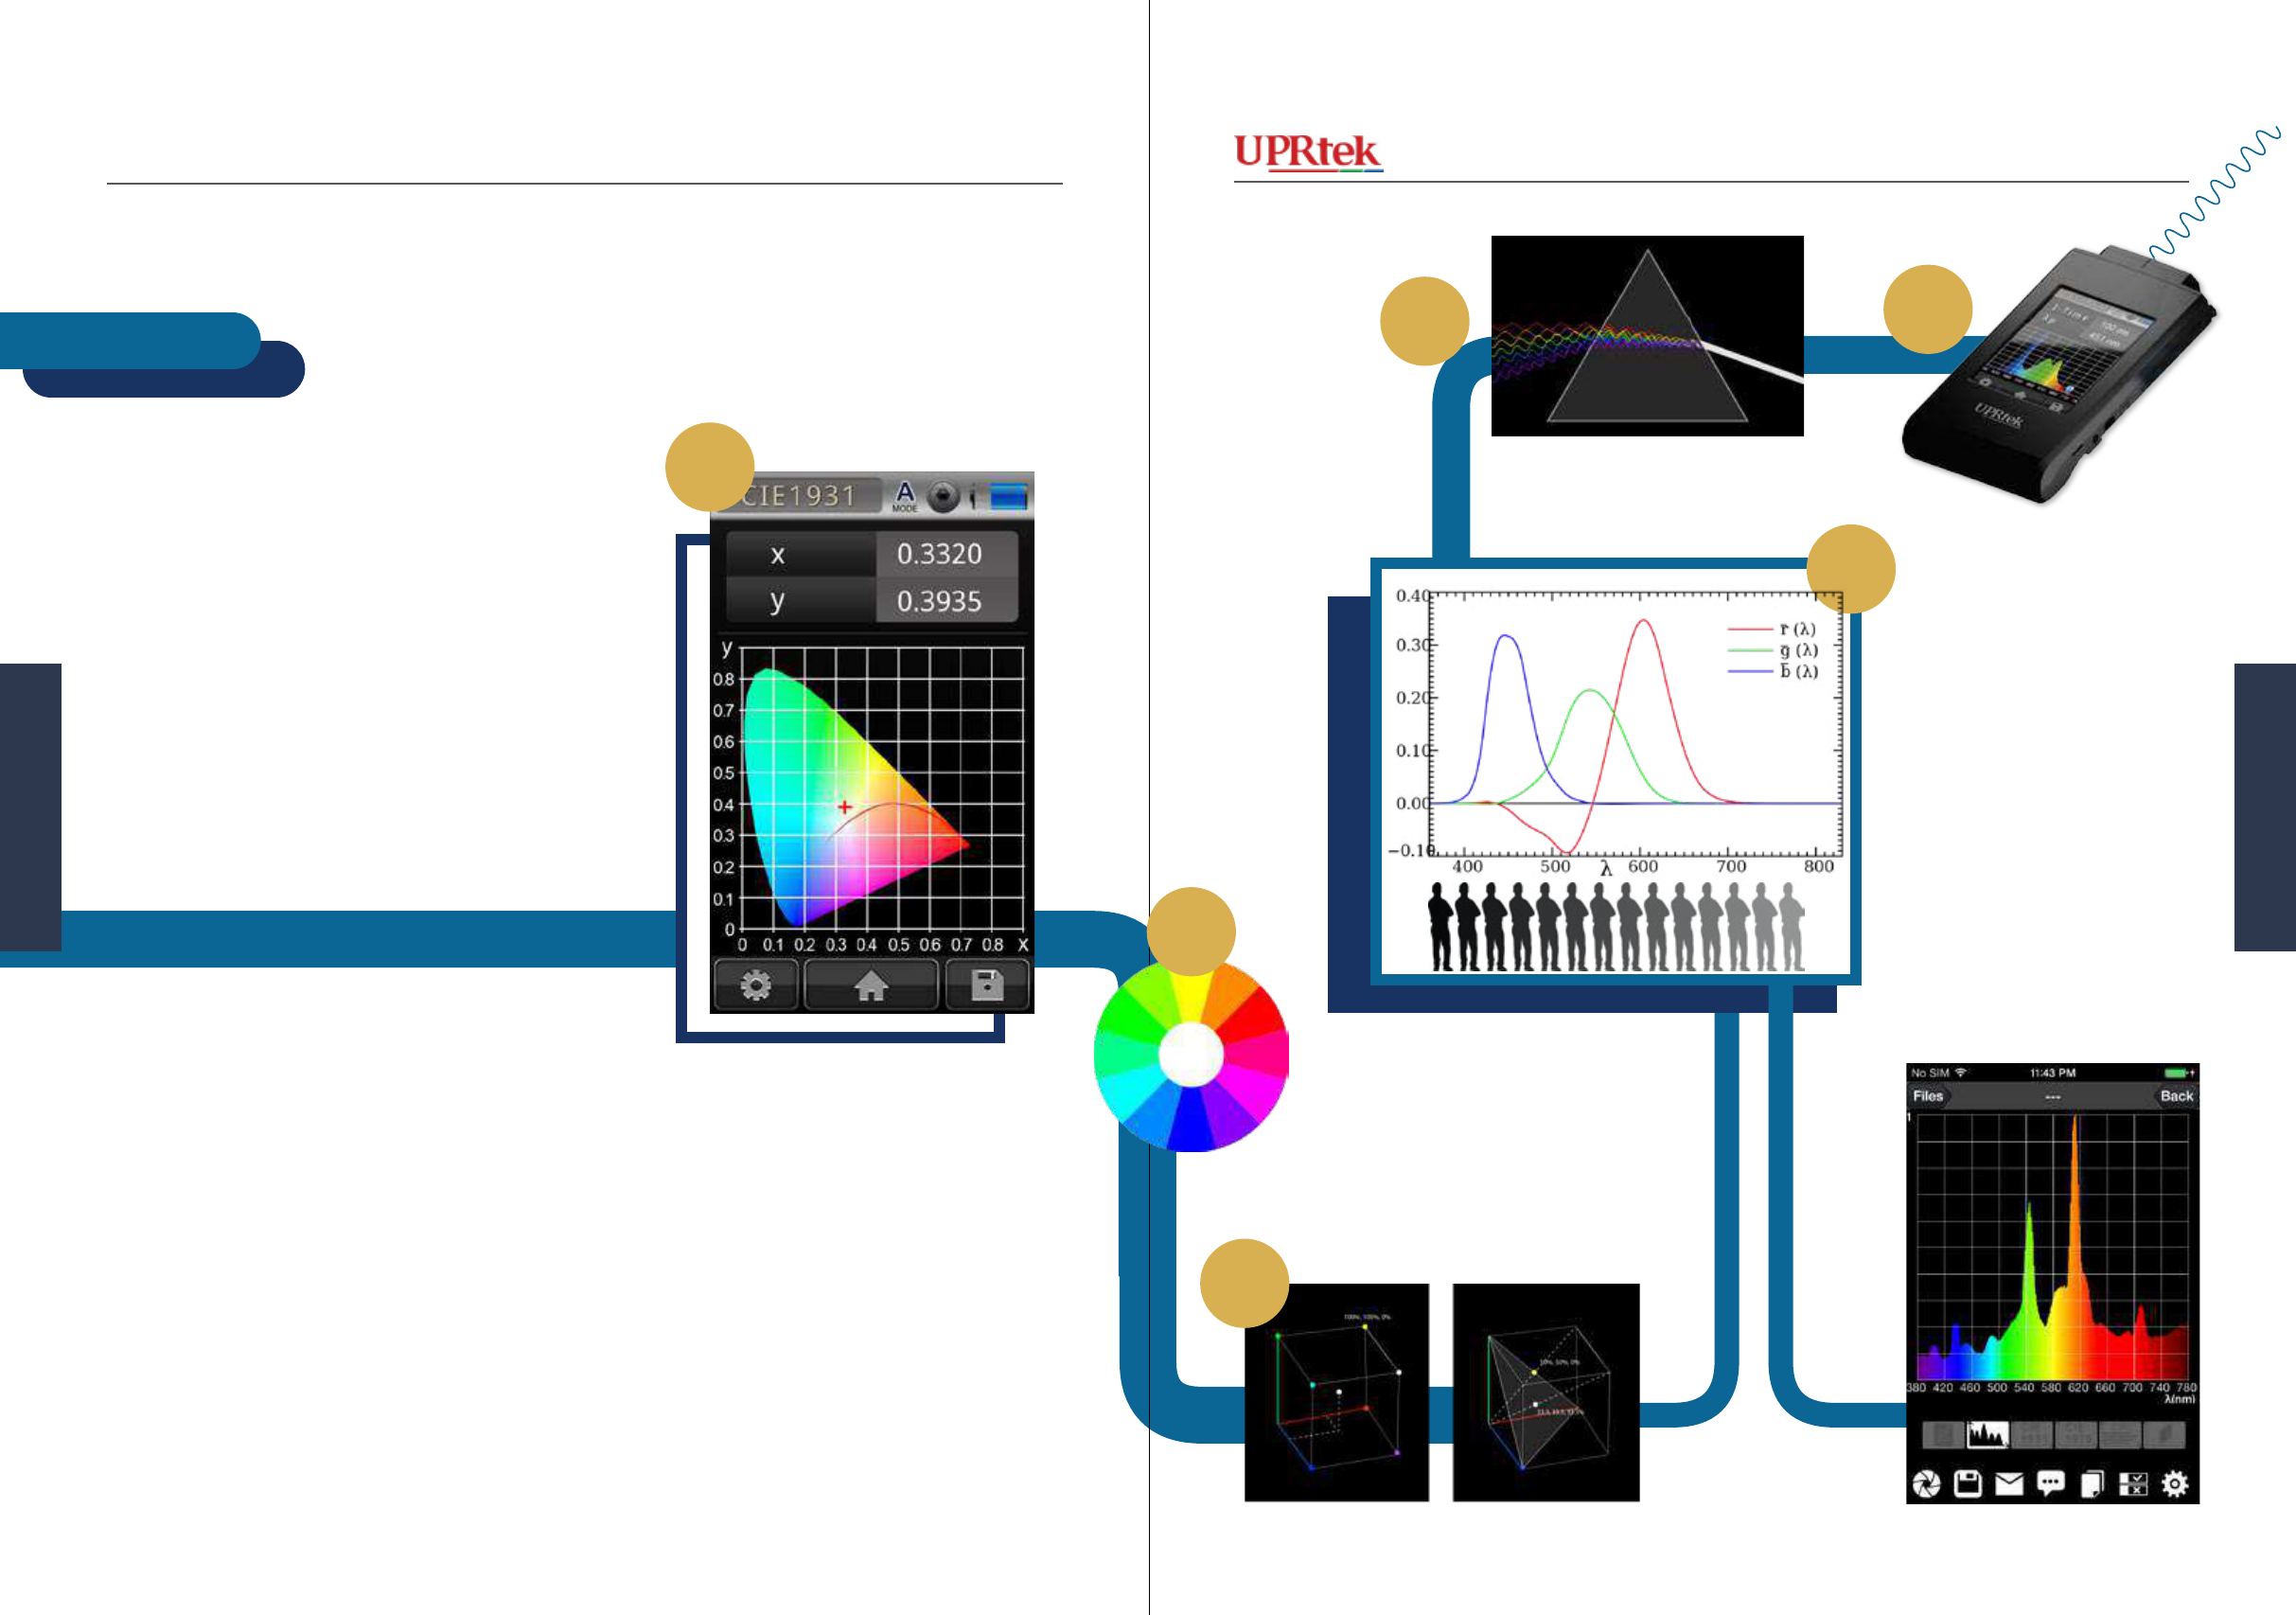
Wavelength Intensity
Now we know that a device like an MK350 can capture a single light source and separate it into
its different component wavelengths. Each component wavelength inside the light could have
different quantities of “intensity”, which inuence the color. This is represented by the Color
Spectrum (below-left) also provided by the MK350 devices. It shows the different wavelengths
and their respective intensities. In this example, we can see that reddish colors at about 610 nm
are dominant and will cause the white light to appear perhaps reddish - however, you must really
take all the colors and mix them together to really know if your light is more reddish, greenish or
bluish - and that is what the x,y point on the Chromaticity Diagram can tell you. Chromaticity
Diagrams show you color; the Color Spectrum shows you the intensities of all the wavelengths
that, when mixed together, make up that color.
Wavelength Intensity
Color Spectrum
Weblars - Creative Commons Attribution-Share Alike 3.0 Unported - Wikimedia Commons
6968 MK350 Series Survival Handbook
Measuring Light
Measuring Light
How does a light meter determine x,y?
How does a light meter determine x,y?
Version 20140410b - Not for distribution - © Copyright 2014 UPRtek All rights reserved
Versio 20140410b - Not for distribution - © Copyright 2014 UPRtek All rights reserved
1. A light meter captures light
2. Separates the light into distinct wavelengths
3. Sends each wavelength data through the Color Match-
ing function to gure out how humans see these wave-
lengths in terms of Reds, Greens and Blues.
4. For each wavelength, it then “mathematically” plots
the RGB values for all those wavelengths in 3D space
and “mathematically” normalizes it to 2D (Unit Plane
or x,y plane).
5. It takes all those points and adds them together to ar-
rive at a single x,y coordinate.
6. Finally it plots it on the Chromaticity Diagram!
■ a way to objectively specify, identify and compare light sources
■ derived from Human Data Experiments (1926)
■ derived from RGB, a convenient model for mixing colors; it is convenient because it is like our 3
Cones which are loosely based on RGB.
■ used to map x,y coordinates that represent a light’s chromaticity (color) among all the colors humans
can see and agree on (standardize colors)
■ used by a light meter like the MK350 - it captures light and goes through all the necessary steps to
arrive at an x,y coordinate for a light source
■ all the colors visible to the human eye
Chromaticity Diagram
Color Spectrum
Take home - The CIE 1931 Chromaticity Diagram is ...
1
3
4
6
5
Weblars - Creative Commons Attribution-Share Alike 3.0 Unported
2
Mathematical Calculations
Color Matching Functions
Separate Colors in Light
7170 MK350 Series Survival Handbook
Measuring Light
Measuring Light
Version 20140410b - Not for distribution - © Copyright 2014 UPRtek All rights reserved
Versio 20140410b - Not for distribution - © Copyright 2014 UPRtek All rights reserved
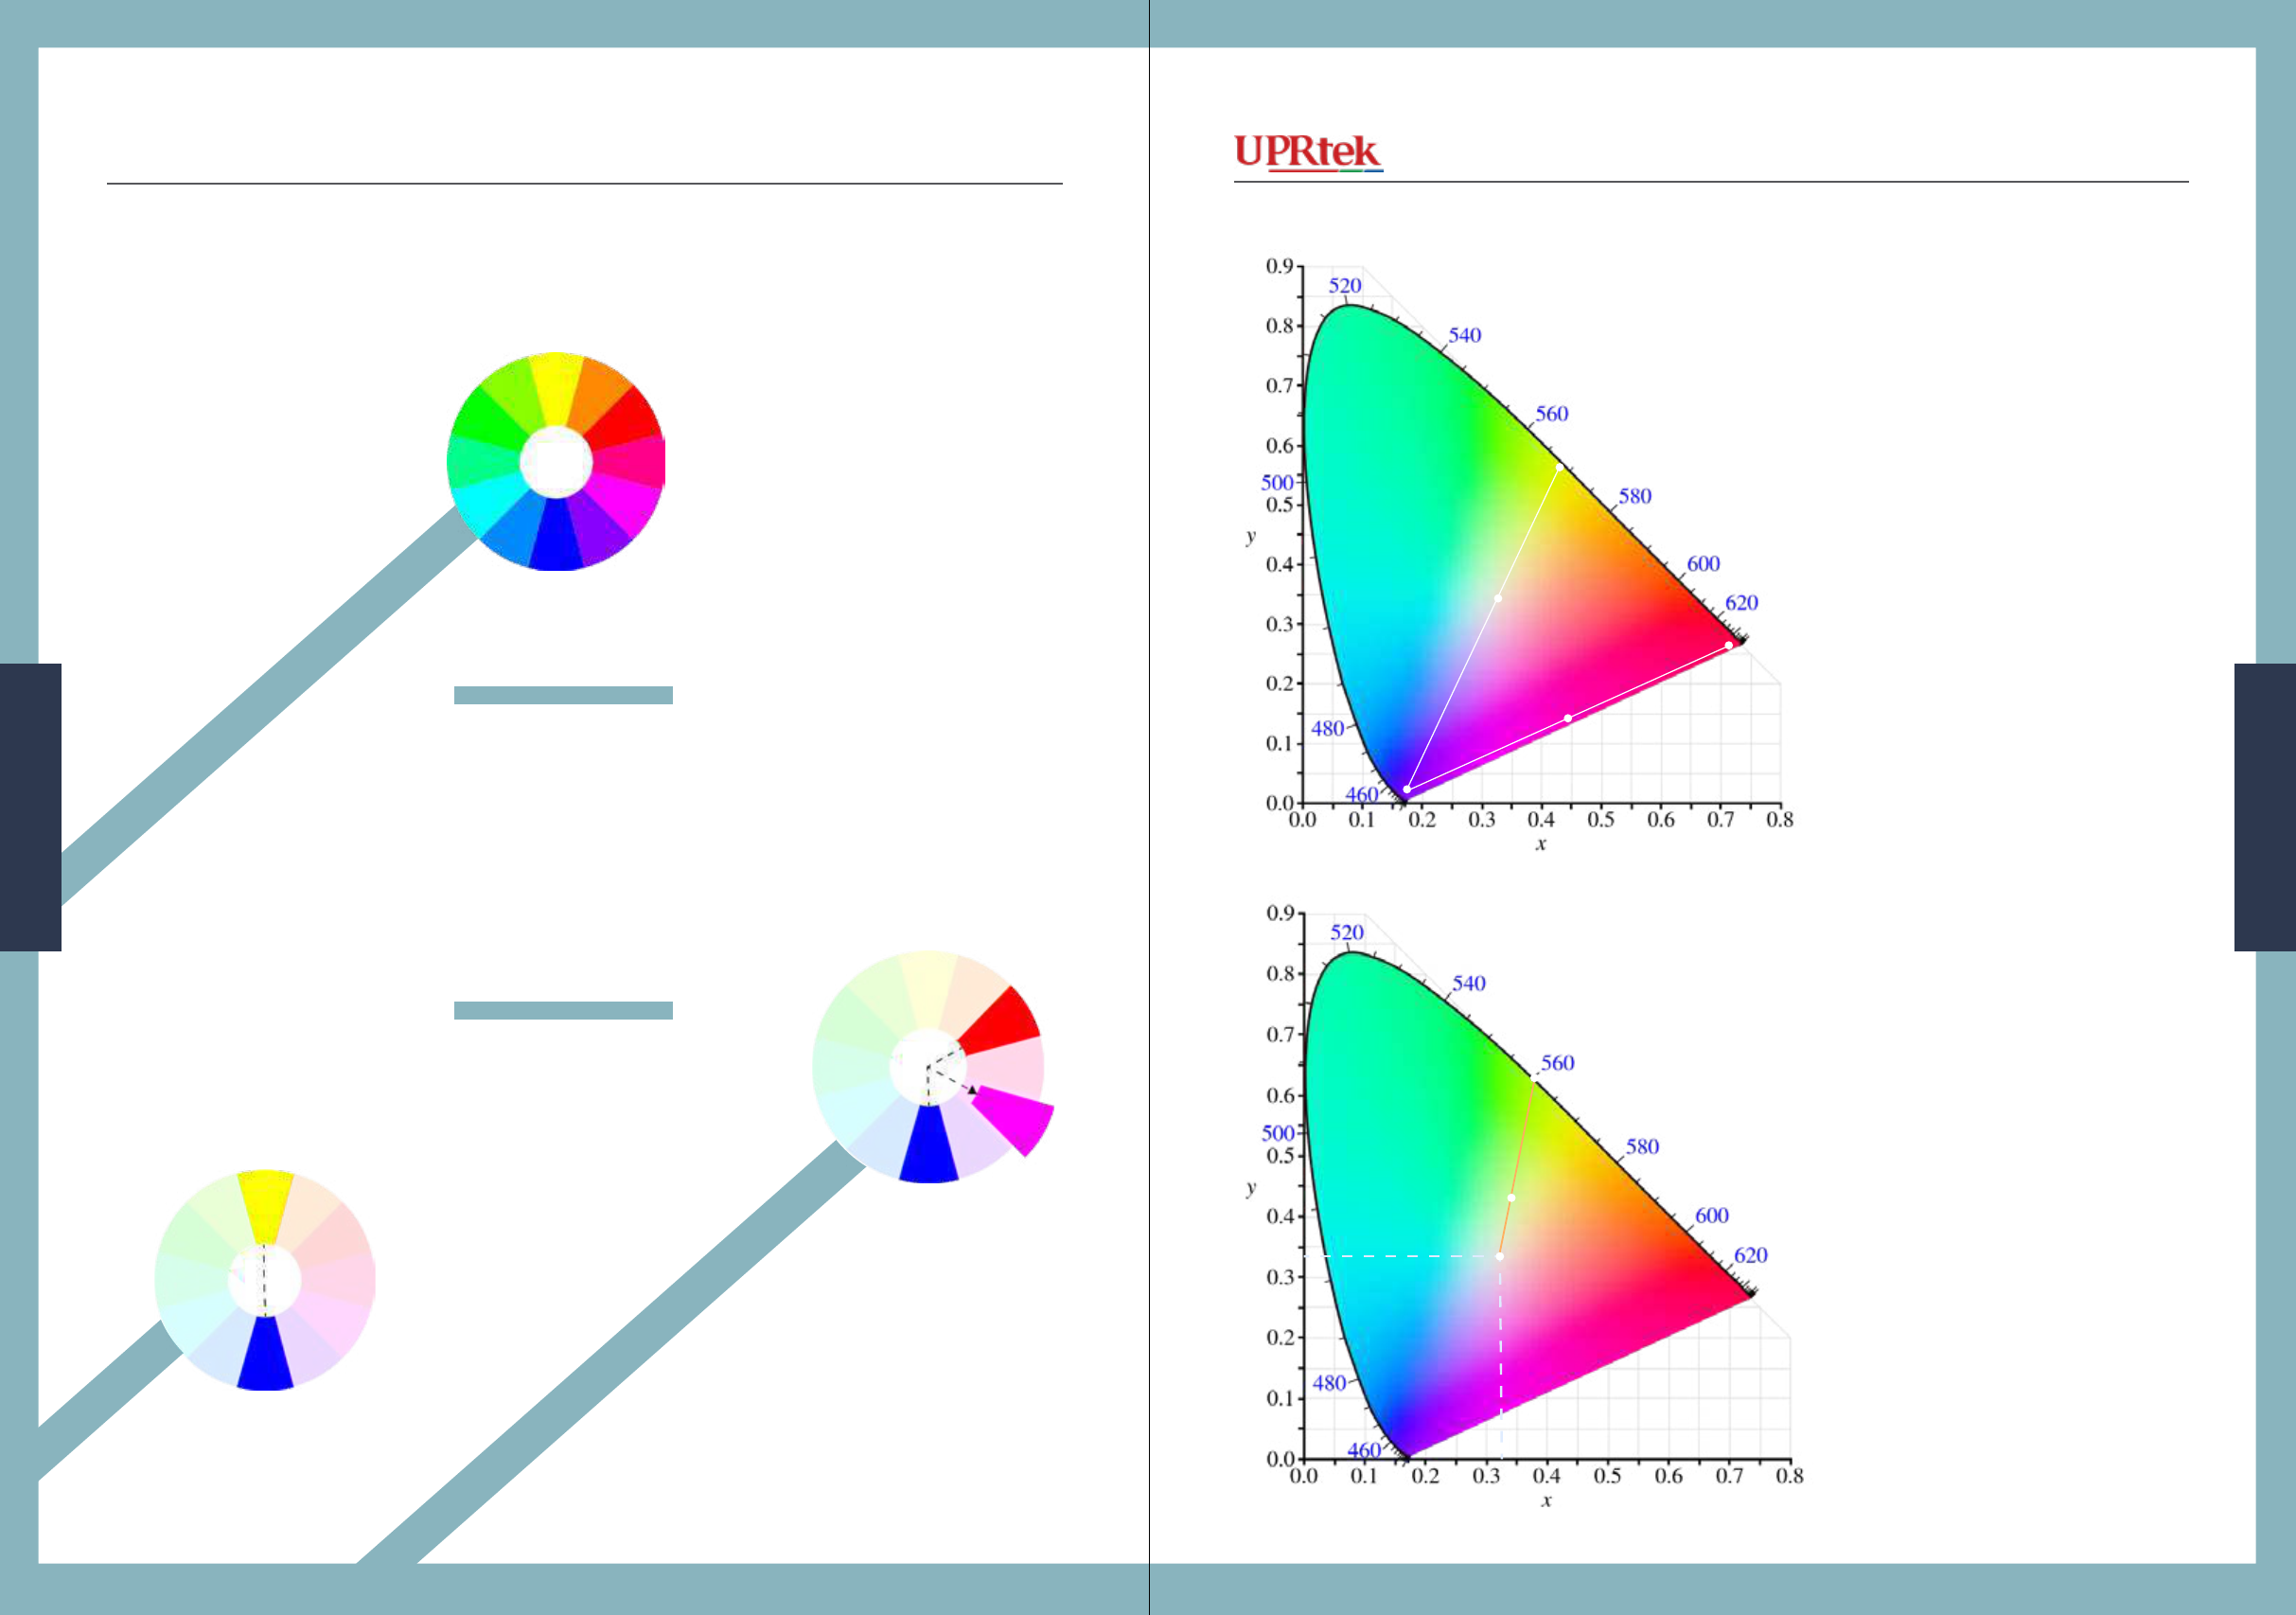
Color wheel and the Chromaticity Diagram
Remember our original
color wheel? Our Chro-
maticity Diagram has
characteristics that are
similar in some ways.
Like mixing and match-
ing colors to make new
colors.
In our Chromaticity Diagram,
you can mix n’ play like our
color wheel. If you take a point
that is red and you connect it to
a blue point, the midpoint will
be purple. Similarly, mixing
blue and yellow gives you
whitish color - however these
midpoints will not generally be
accurate because of distortions
in the diagram.
Reddish
Purplish
Yellow
White
RGB color wheel
Red
Blue
Purple
Opposite colors make white
(blue-yellow)
White
If your color is at x,y and you
drew a line from the white
point to the outer edge, you will
arrive at a fully saturated color,
or the “dominant wavelength”
(e.g. 560) - it’s like taking your
x,y color and taking all of the
white out of it.
Somewhere close to the middle
of the gamut there is a white
point, which is at .33 and .33.
This is an important reference
point.
x,y
Bluish
White point
Fully Saturated Color
The Color wheel and the Chromaticity Diagram
7372 MK350 Series Survival Handbook
Measuring Light
Measuring Light
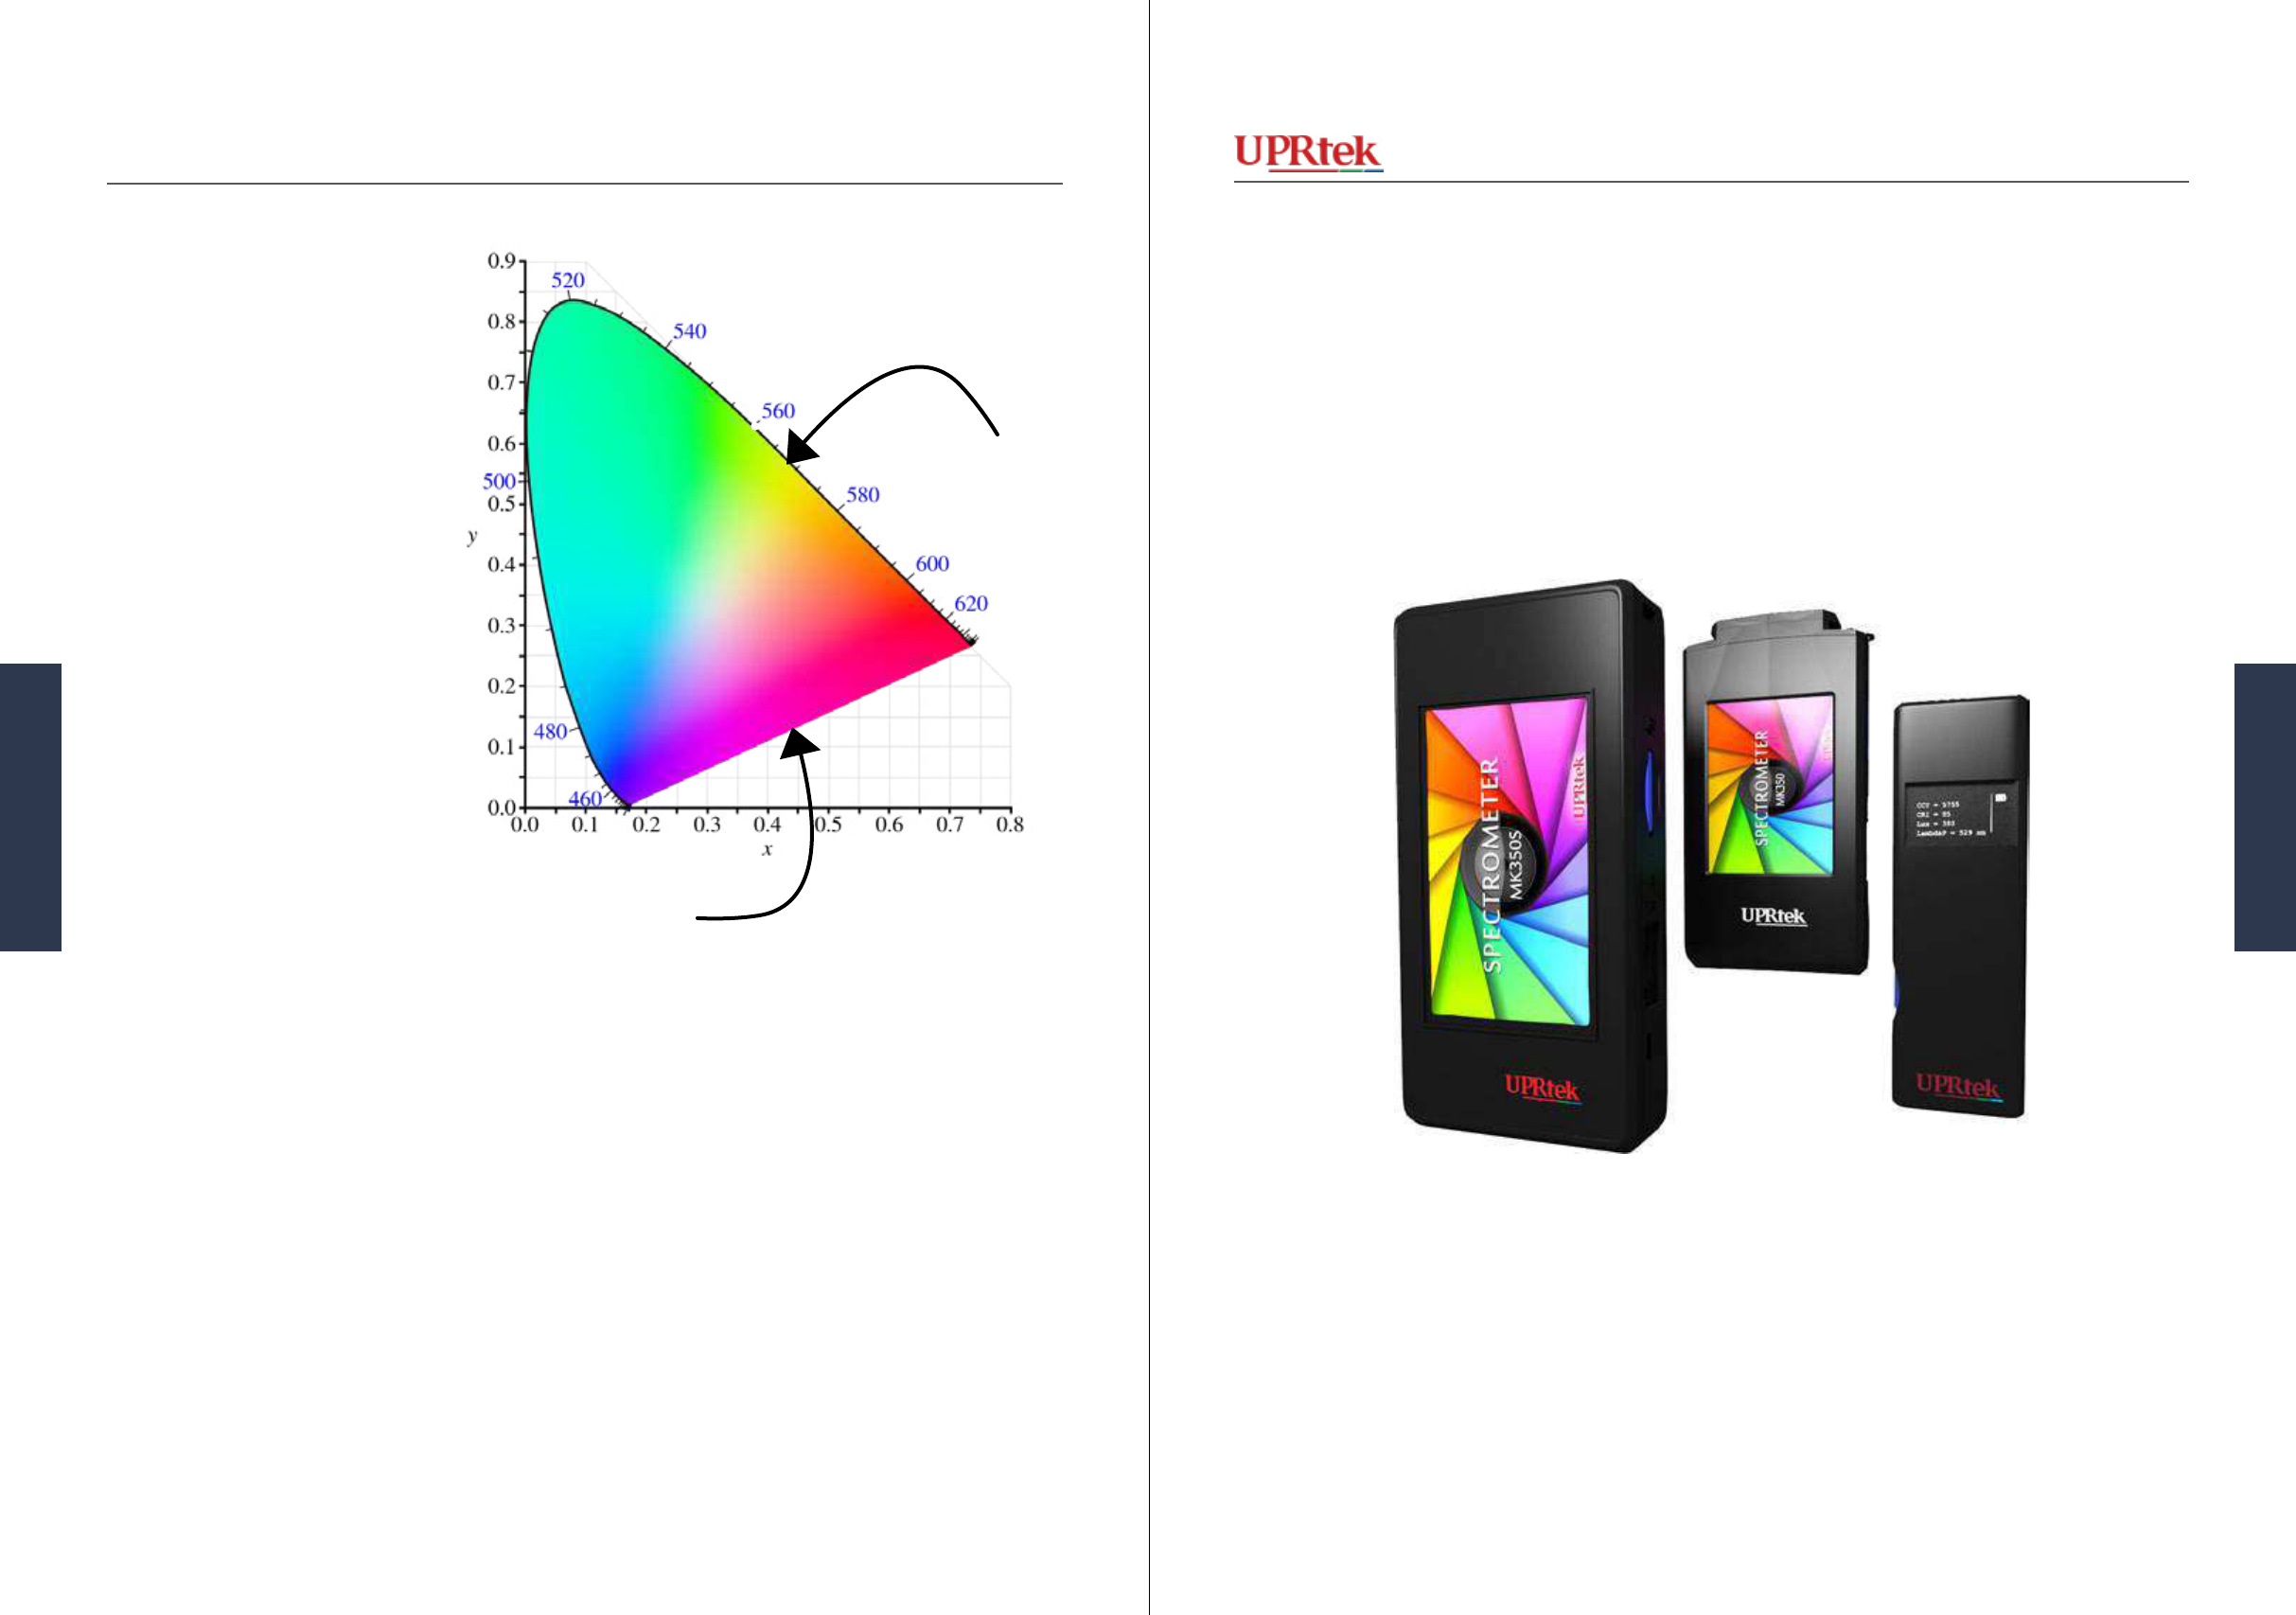
Version 20140410b - Not for distribution - © Copyright 2014 UPRtek All rights reserved
Versio 20140410b - Not for distribution - © Copyright 2014 UPRtek All rights reserved
All of the dominant wave-
lengths on the outer contour and
are also all the monochromatic
(pure) colors that can be repre-
sented by one wavelength and
are also all the colors split up
by our prism (all the rainbow
colors).
At the bottom of the “horse-
shoe” is a straight line. It is
called the “Line of purples”.
These are real colors that we
can see but with one exception -
they are not pure colors, mean-
ing a single wavelength cannot
represent any color on that line
(unlike 700 nm wavelength that
represents pure red); you need
to mix two or more colors to
produce them.
Line of Purples
Pure Colors on
the contour.
(this page left intentionally blank)
7574 MK350 Series Survival Handbook
Measuring Light
Measuring Light
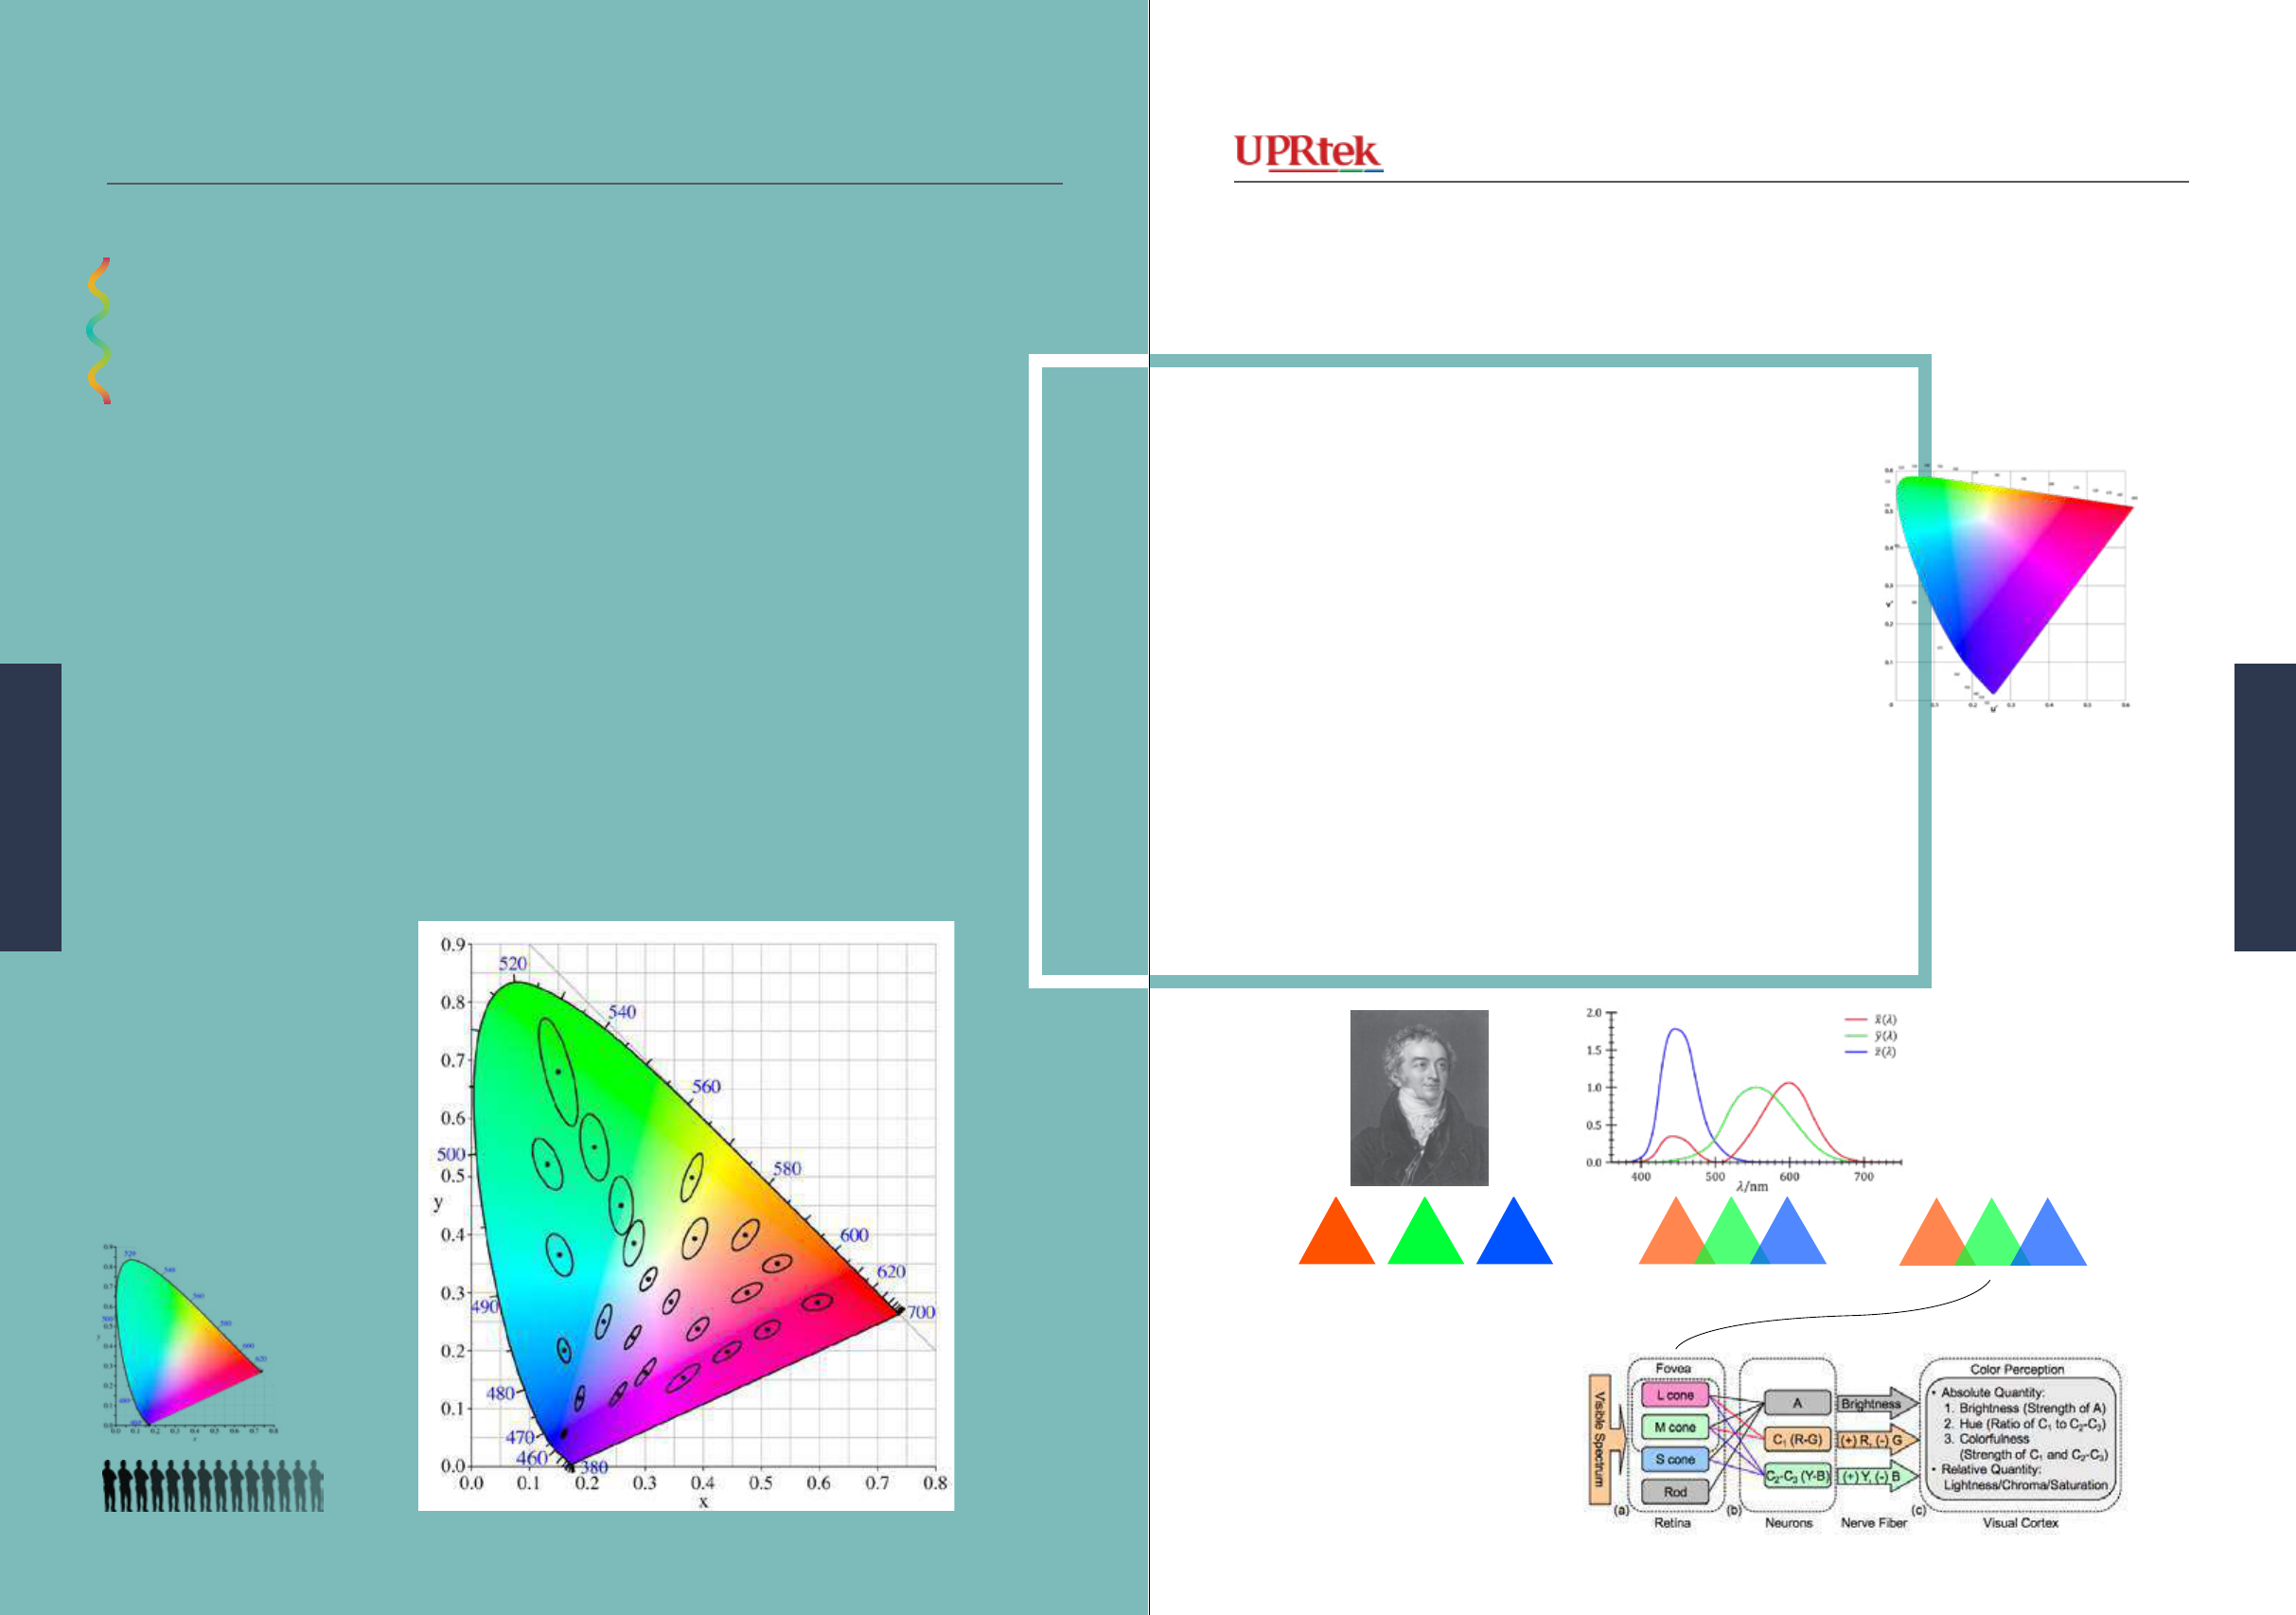
CIE 1931 to CIE 1976
Version 20140410b - Not for distribution - © Copyright 2014 UPRtek All rights reserved
Versio 20140410b - Not for distribution - © Copyright 2014 UPRtek All rights reserved
CIE 1931 to CIE 1976
The CIE 1931 was the original
Chromaticity Diagram followed
by, CIE 1960 and CIE1976,
which were improvements to
their respective predecessor
- but change doesn’t always
come easy - CIE 1931, is still
in widely used. The most
recent CIE 1976 version boasts
improvements that more ac-
curately matches our visual
perception compared to the CIE
1931 diagram.
All the colors in the CIE 1931
diagram are supposed to be
distinguishable colors. Exper-
iments by Kodak researcher
David L. MacAdam along with
GNU Free Documentation Creative Commons Attribution-Share Alike 3.0 Unported
CIE 1976 specication actually includes two versions; the CIELAB
and CIELUV. They both take into account the distortions revealed
by the MacAdam’s Ellipses. Furthermore, these also take into
account more recent revelations in how our 3 cones really process
colors (see below). Like CIE 1931, CIELUV and CIELAB have x,y
coordinates, but use u,v and a,b respectively
Another advantage to CIELAB and CIELUV is that they have
a larger color space and are device independent - what does this
mean? It means that you can choose a logo color and not have
to worry about CMYK, RGB, sRGB, Adobe RGB, Pantone - the
devices will adapt to CIELAB. However, change comes slow and
this is why lots of devices are still stuck on CIE 1931, not wanting
to comply with CIELAB.
The difference between CIELAB and CIELUV is usage. CIELAB
is recommended to be used for subtractive processes used in print-
ers, while CIELUV is recommended for use with additive processes
like displays (monitors).
Creative Commons Attribution-Share Alike 3.0 Unported - googolplexbyte
Opponent Color Theory
Better but still not perfect
Deane B. Judd and Gunter Wyszecki
provided empirical evidence that CIE
1931 represented a distorted view
of how humans see colors. Basical-
ly, the ellipses in the MacAdam’s
Ellipse diagram show areas where
there is no discernible difference in
color according to test subjects. The
CIE 1976 Chromaticity Diagram im-
proved on these distortions but was
admittedly still not perfect.
MacAdam’s Ellipses
1800s 1931 1976
Our knowledge
of how our
cones work has
evolved.
CIE 1976 is better suited to human visual perception because it incor-
porates MacAdam’s Ellipses and more closely parallels how our cones
work, using a new paradigm called the Opponent Theory.
7776 MK350 Series Survival Handbook
Measuring Light
Measuring Light
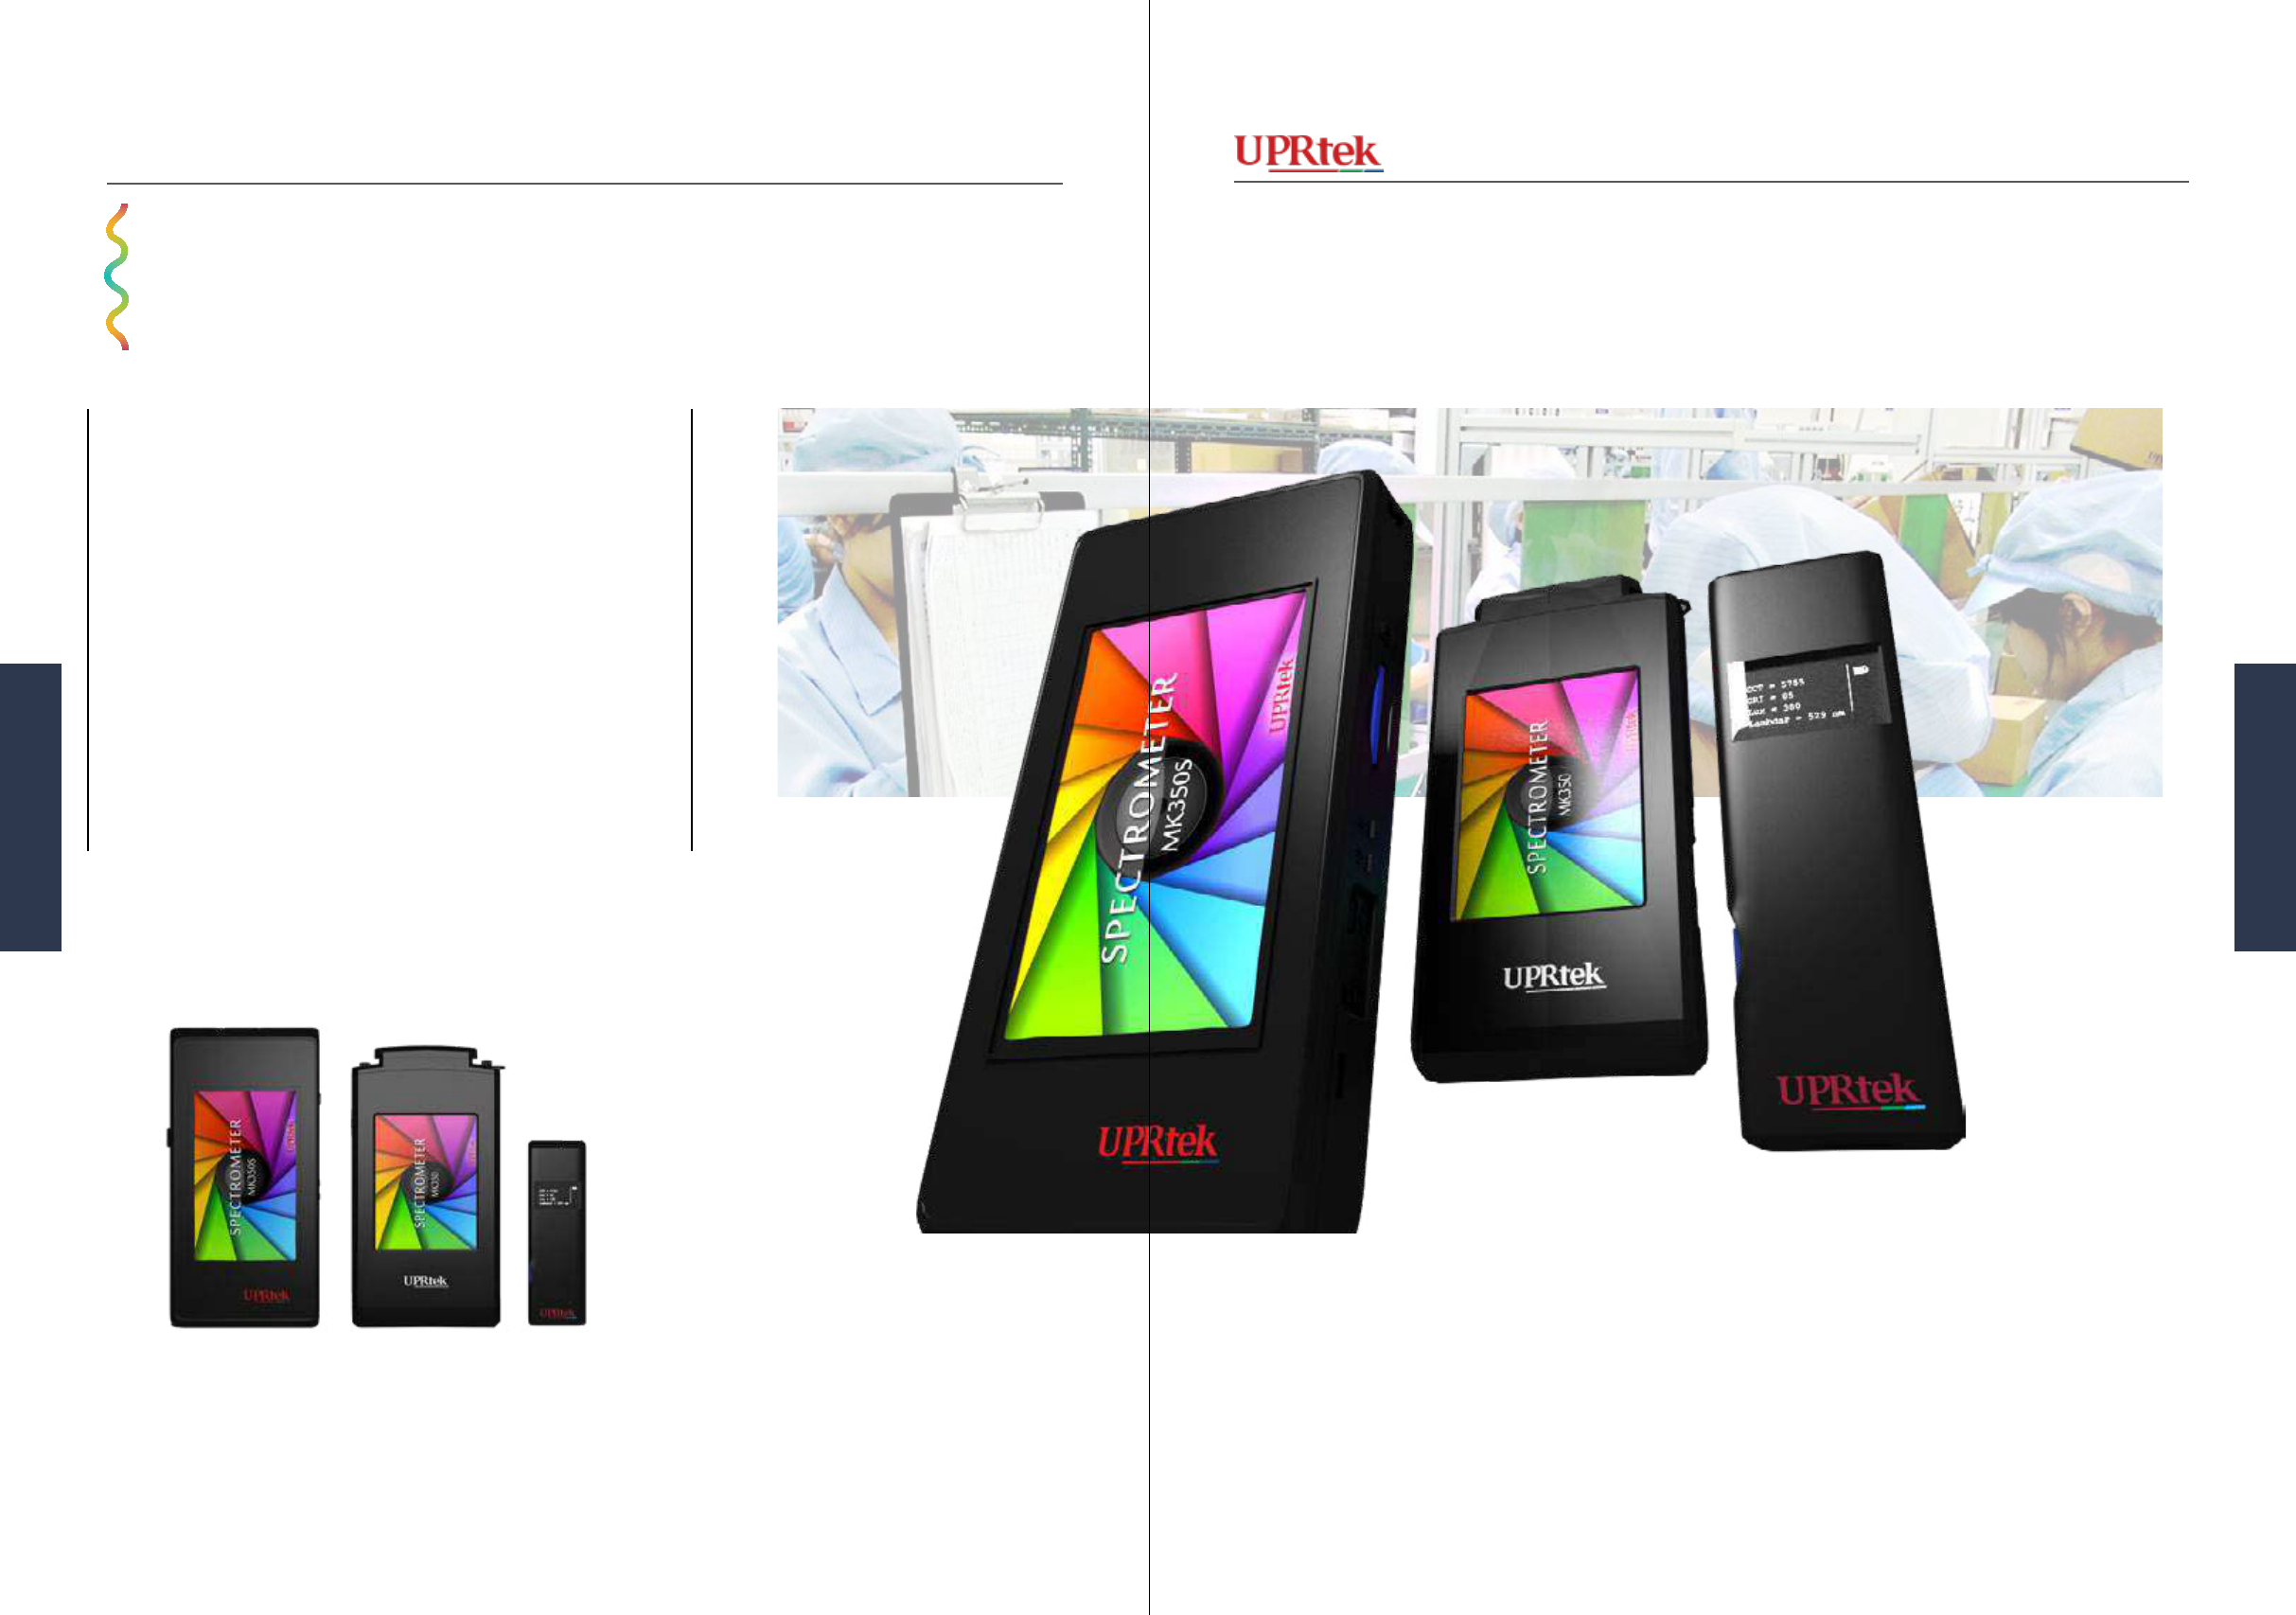
The MK350 Series are UPRtek’s
precision Spectroradiometers (i.e. light meters) includ-
ing the Advanced, Basic and Compact models. They
are differentiated by functionality, usage and size.
The Advanced model has a very wide range of features
and measurement capabilities, and can cover most
portable applications from basic measurements to spe-
cialty analysis, comparison and administration.
Both the Basic and Compact models provide the user
with a quick snapshot and basic measurement infor-
mation. The Compact model only has a small visual
screen but is conveniently pocket-sized. Both of these
products were given a tremendous boost with the
ability to connect to the uSpectrum PC software and
the Smart Phone Apps. Additionally, the Compact
model was recently upgraded with a new feature called
Flicker sensor.
Advanced Basic Lite
Version 20140410b - Not for distribution - © Copyright 2014 UPRtek All rights reserved
Versio 20140410b - Not for distribution - © Copyright 2014 UPRtek All rights reserved
MK350 Series - Things you should know
Advanced MK350S, Basic MK350N and Compact MK350D
MK350 Series - Things you should know
Advanced MK350S
Basic MK350N
Compact MK350D
7978 MK350 Series Survival Handbook
MK350 Series
MK350 Series
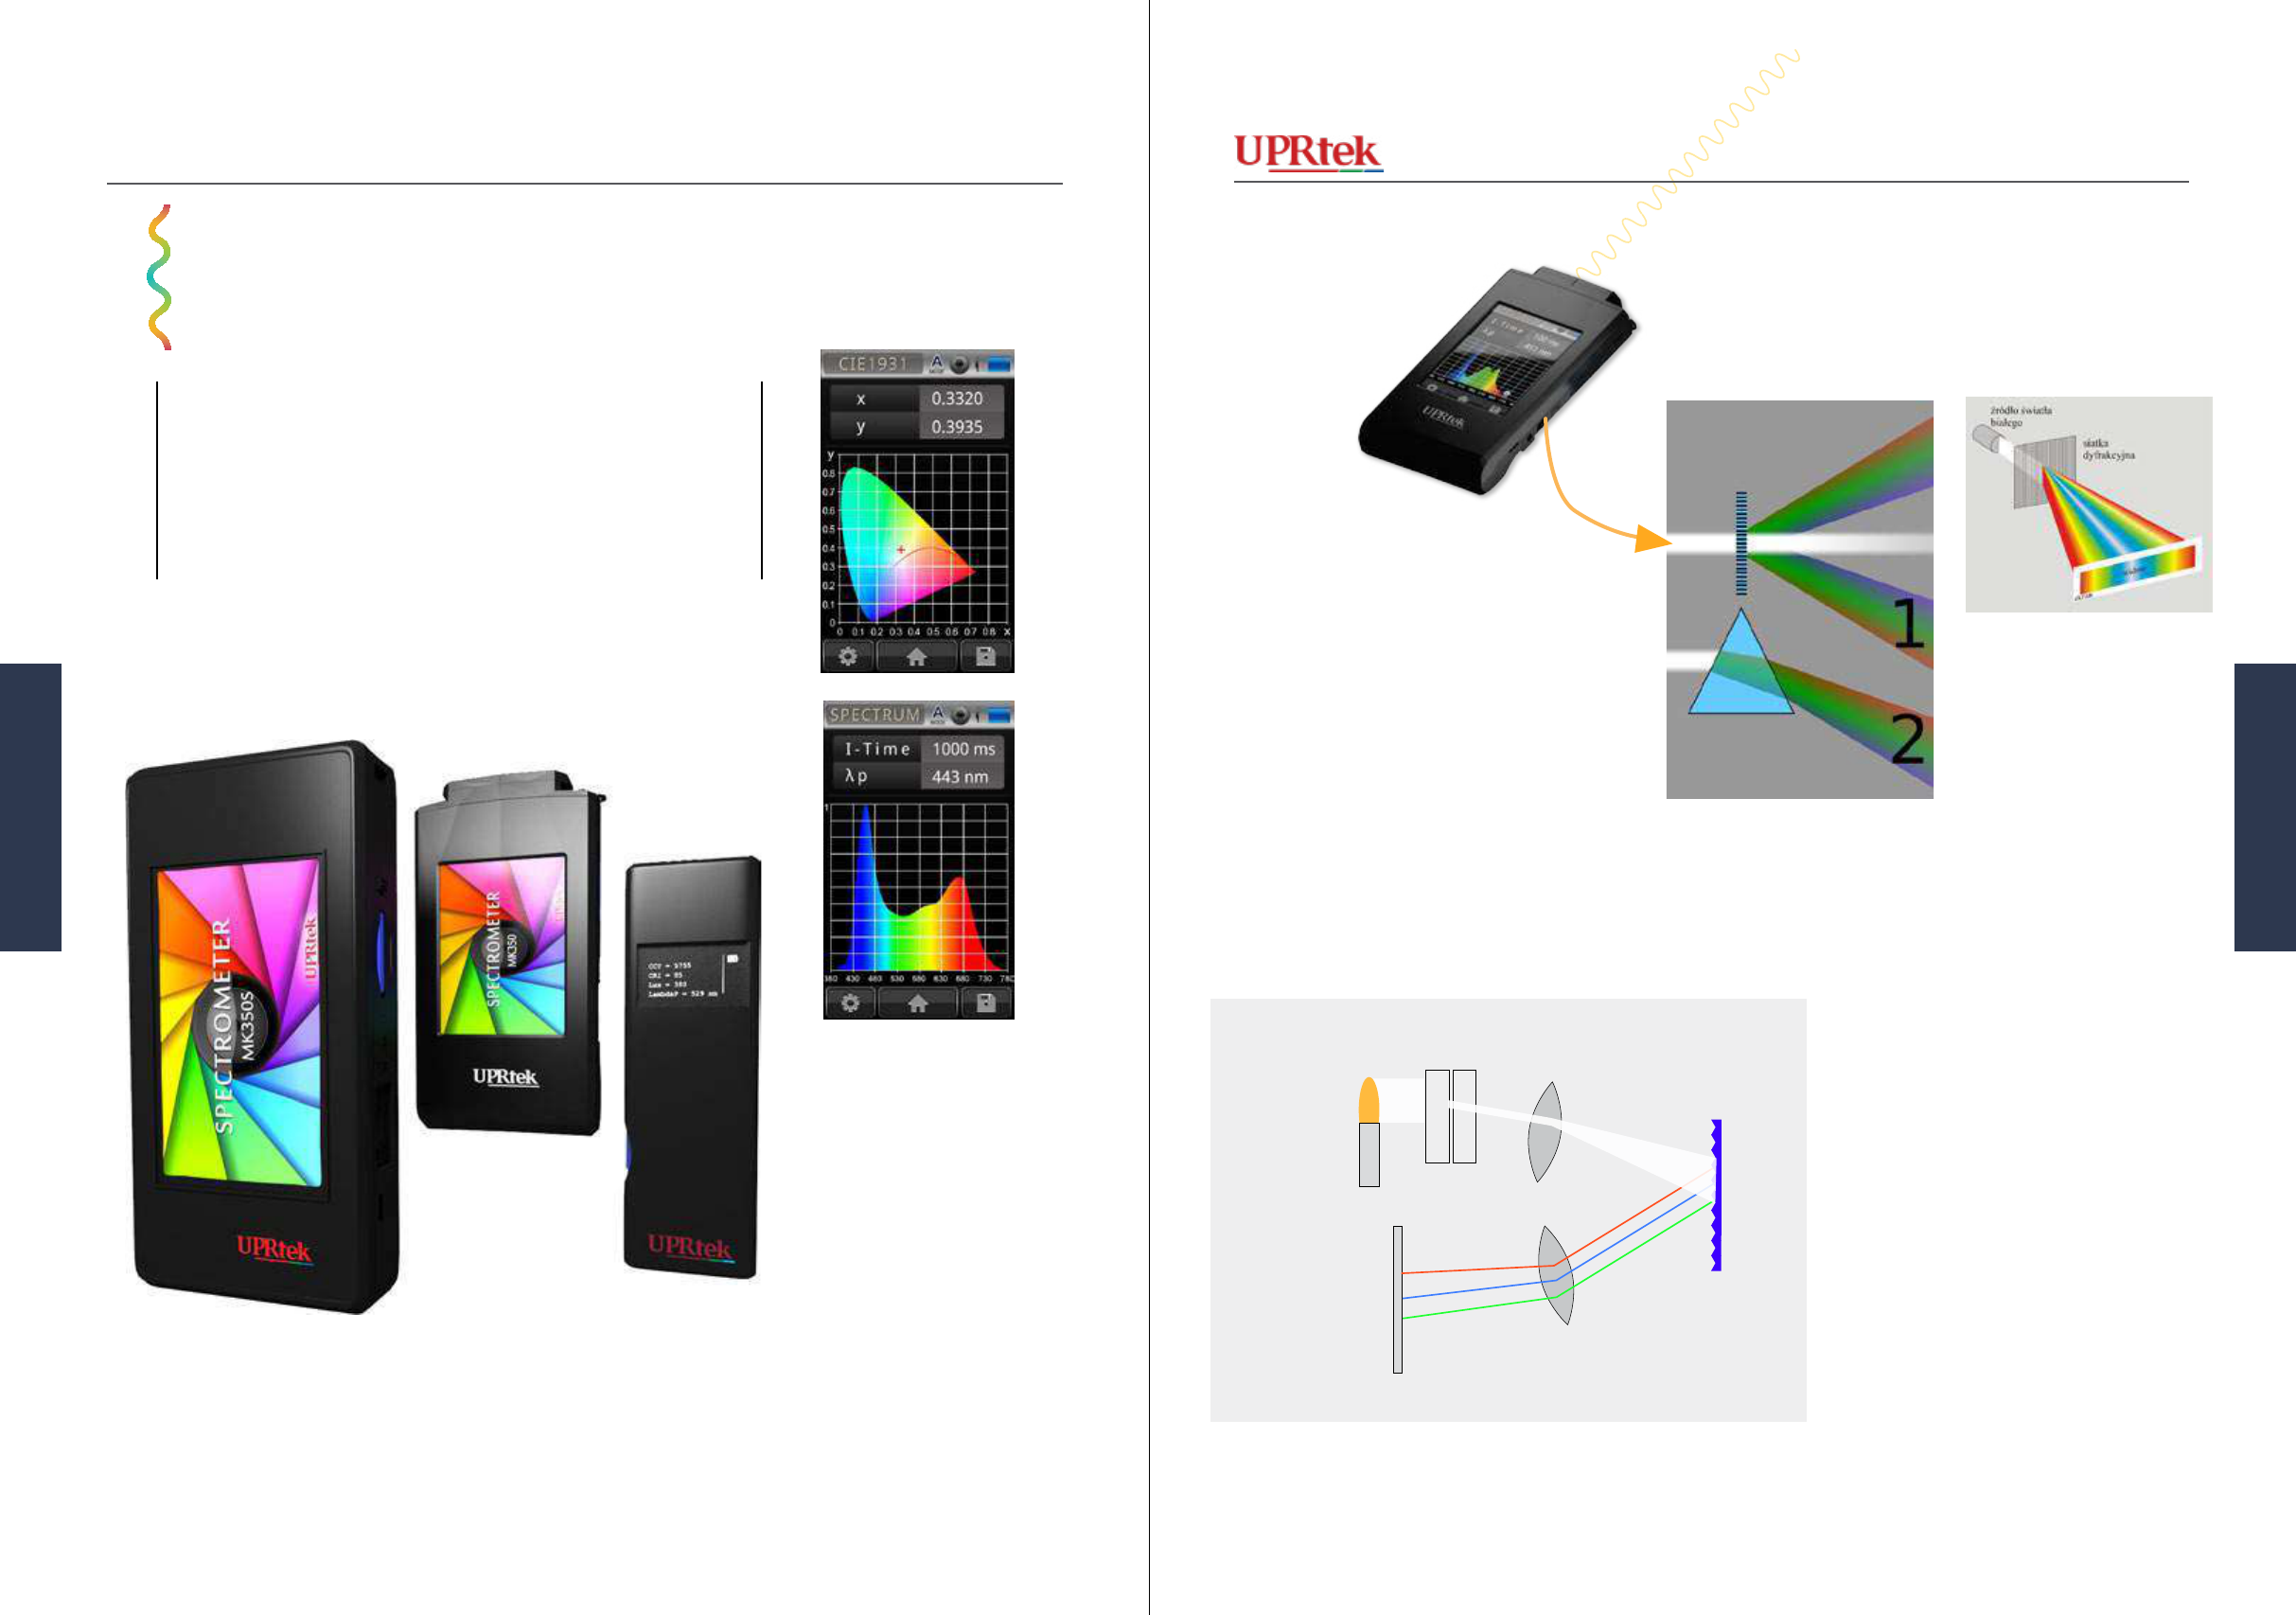
Watch a Video
The MK350 User Manuals will explain most of the
features and functions, which we will skip here (you
should read the User Manuals at some point). In this
section we’ll look at some of the special terms and
functionality that were not covered in depth in the
User Manual.
We’ve already talked about how a
meter device can capture a white
light and derive an x,y coordinate
for our chromaticity diagram.
In that discussion we used a prism
to separate the colors in white
light - but actually, in our MK350
devices, we have what is called a
diffraction grating that does the
same thing but more efciently
and effectively.
http://www.youtube.com/watch?v=pxC6F7bK8CU
Diffraction Grating
Prism
The simplied explanation is that
light is received through a small slit
which transmits and reects off lens-
es and the diffraction grating to -
nally reach the CMOS sensor which
is the device that actually senses the
dispersed light waves to be recorded
as wavelength and intensity data.
Cmglee - CC-BY-SA-3.0
MPastermak - CC-BY-SA-3.0
Version 20140410b - Not for distribution - © Copyright 2014 UPRtek All rights reserved
Versio 20140410b - Not for distribution - © Copyright 2014 UPRtek All rights reserved
Specialty Terms
Diraction Grating
Diraction Grating
Light Source
Lens
Lens
Diraction Grating
CMOS Sensor
Slit
8180 MK350 Series Survival Handbook
MK350 Series
MK350 Series
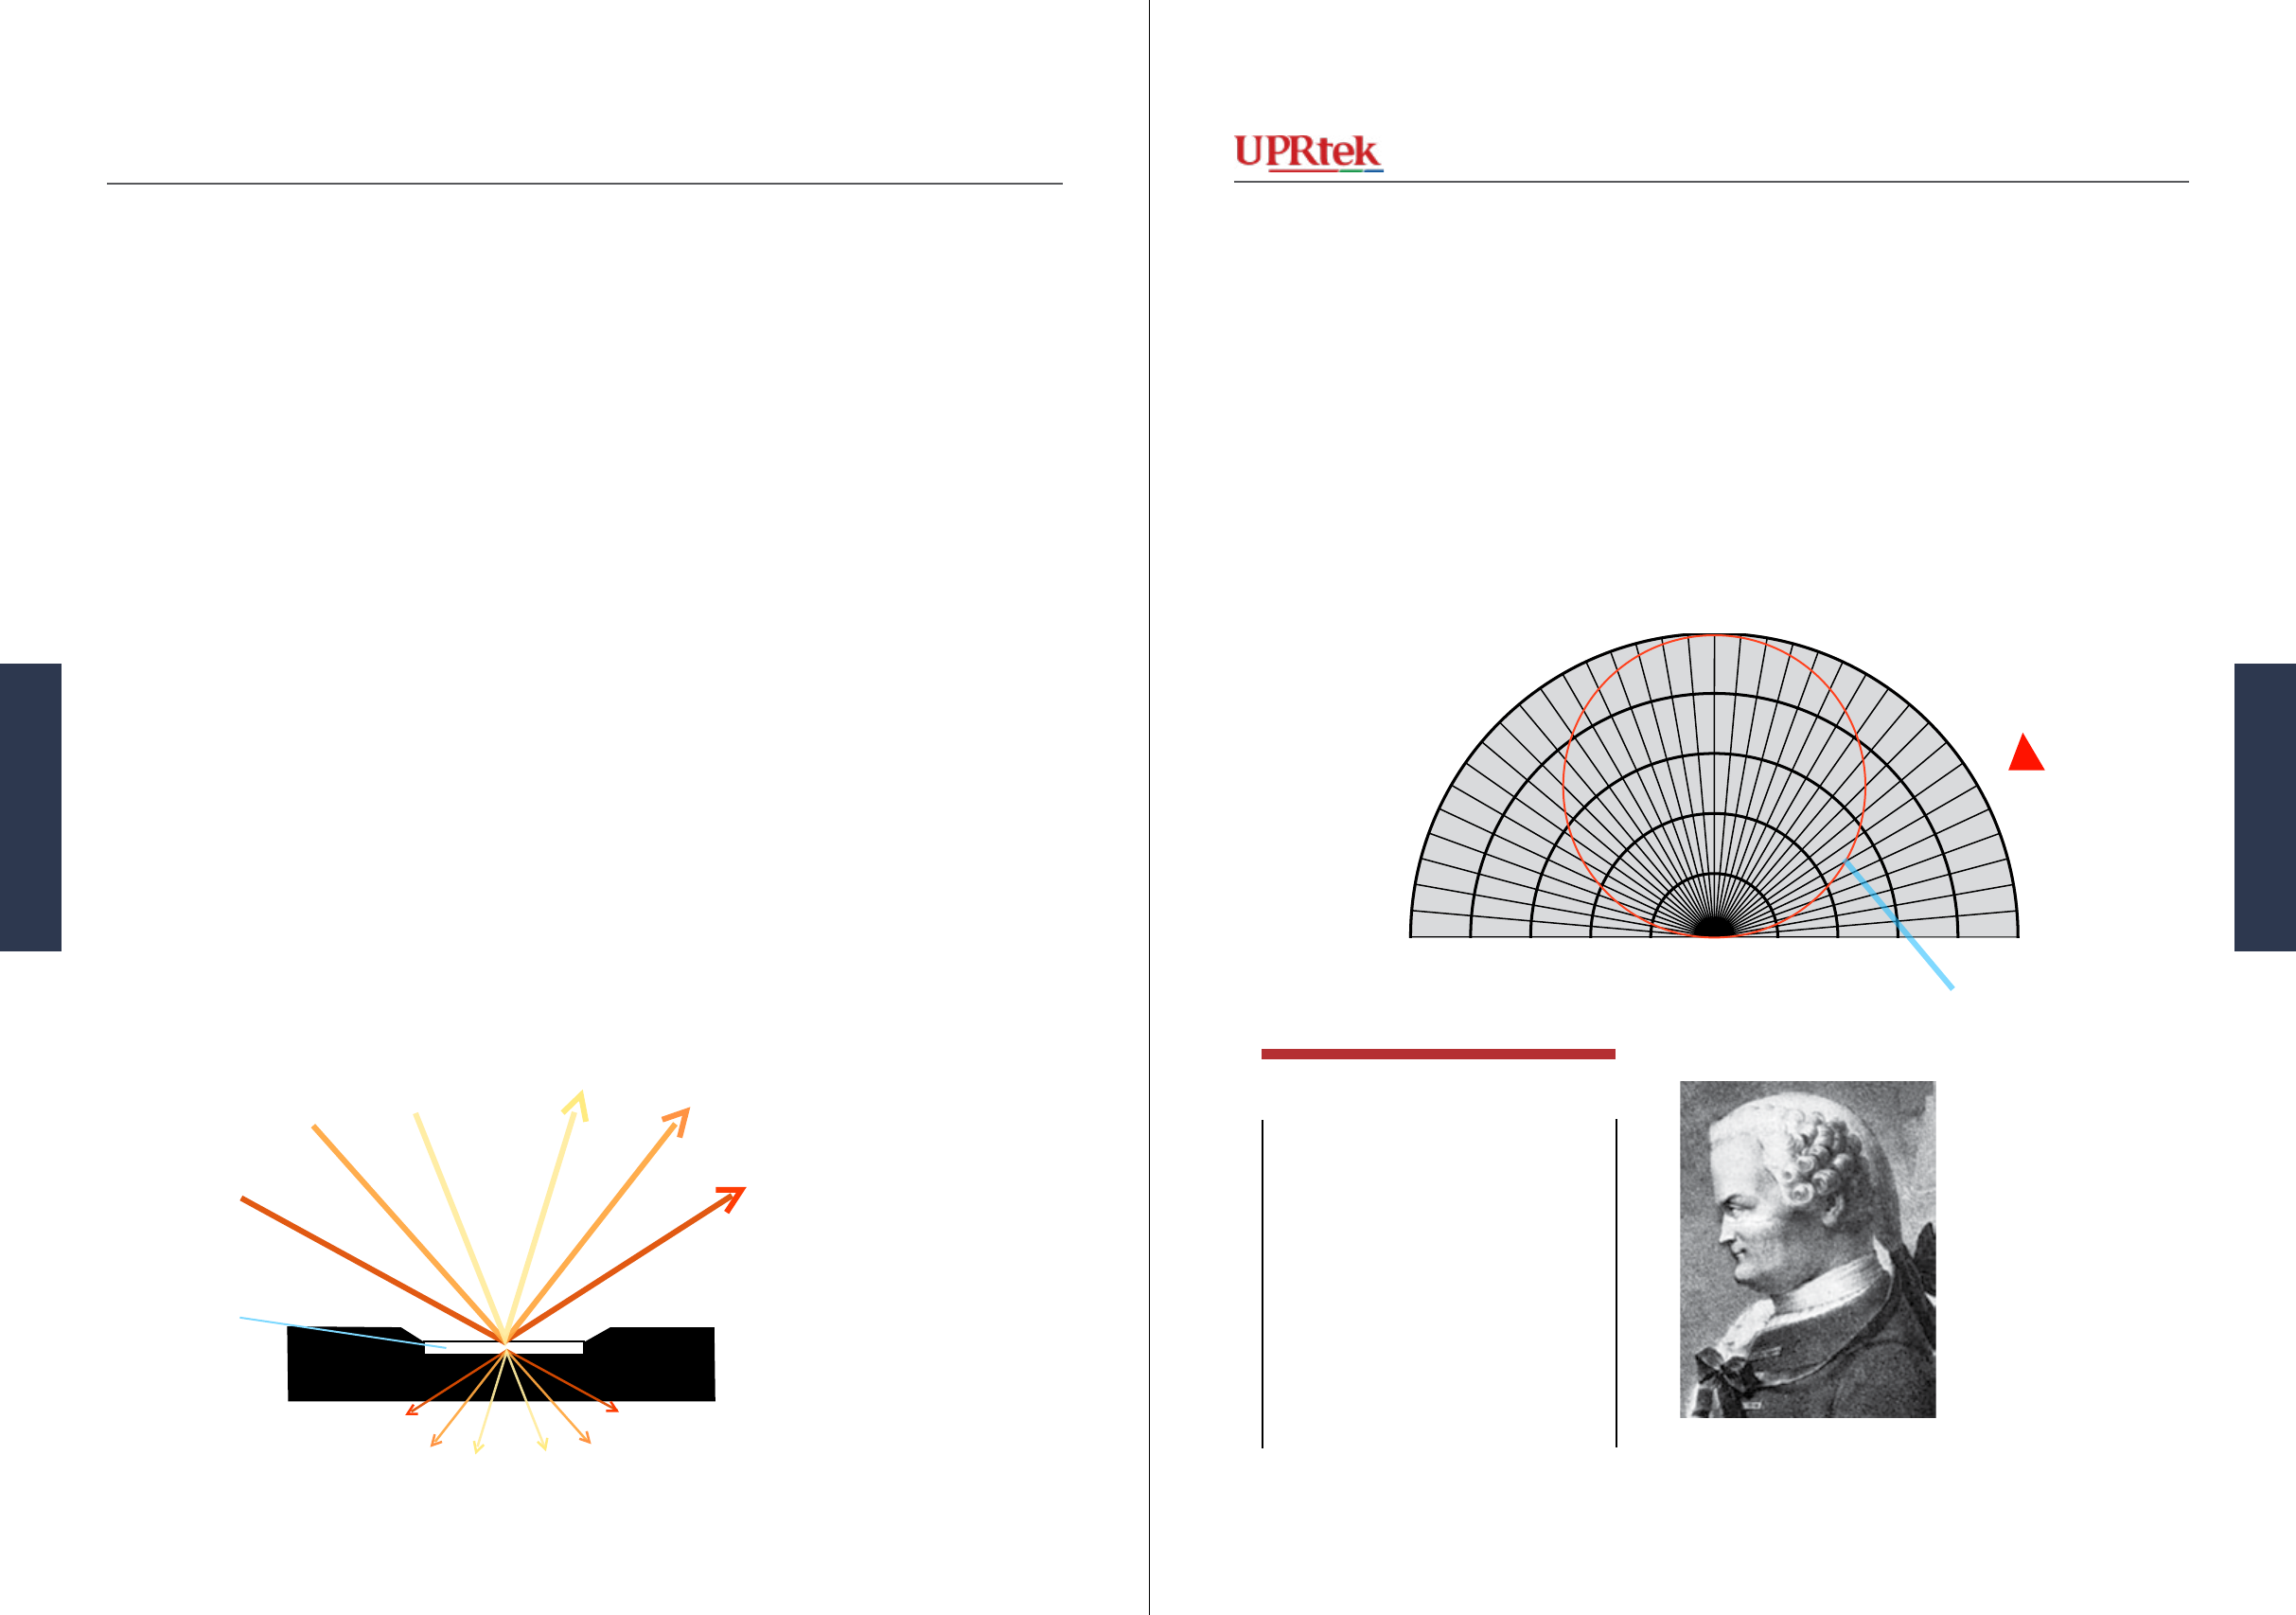
Another term you will run into is Cosine Correction. It is associated with
measuring illuminance or how much light brightens a certain area - it is
measured in LUX which is lumens per sq. meter. A lumen is a unit of mea-
sure that represents an “amount” of visible light.
First, you must know that light coming in at an angle will inuence the
brightness or LUX. A light shining from directly above will shine bright-
er than a light coming in at an oblique angle. In fact there is a direct cor-
relation between the angle of the light and amount of brightness - this was
explained by Johann Heinrich Lambert in 1760.
Measuring light intensity on a at light meter lens is not so straight for-
ward, especially when trying to measure light coming in at angles and then
accurately recording the brightness according to the Lambert’s laws - you
need to make adjustments or innaccuracies will occur. These adjustment are
called Cosine Correction and there is a chart (next page), which is a guide
to measuring brightness according to Lambert’s laws.. The MK350 (as with
most light meters) uses a Diffuser or Cosine Diffuser that “diffuses” the light
to arrive at a more appropriate calculation of LUX. Diffusers are physically
apparant on certain meters where you can see a white opaque material just
under the lens. However, no diffuser is 100% accurate and you can only
attempt to arrive at ideal corrections for light arriving at angles.
Ideally, Cosine Correction for oblique (angular)
light should follow the graph shown below. For
example, a light hitting our surface at 60 degrees
should register radiant intensity in the meter at
around 50%. As the angle becomes less oblique,
the intensity should increase according the circular
orange line in the graph below. A Diffuser is in-
stalled in MK350 devices to get as close to the ideal
pattern (orange circle) as possible.
9
0
8
5
8
0
7
5
7
0
6
5
6
0
5
5
5
0
4
5
4
0
3
5
3
0
2
5
2
0
1
5
1
0
5
0
5
1
0
1
5
2
0
2
5
3
0
3
5
4
0
4
5
5
0
5
5
6
0
6
5
7
0
7
5
8
0
8
5
9
0
80%
60%
40%
20%
100%
Light coming in at 60
degrees should result
in about 50% of it’s
original intensity.
Cosine 60 degrees = .5
or 50%
Cosine is a mathematical function
used to calculate and specify the
characteristics (length & angles)
of triangles (Trigonometry). The
orange circle in the graph above
was described by Johann Hein-
rich Lambert in 1760 and is called
“Lambert’s Cosine Law”. Basically,
it shows how light intensity changes
as the angle of the light changes.
Diffuser
Version 20140410b - Not for distribution - © Copyright 2014 UPRtek All rights reserved
Versio 20140410b - Not for distribution - © Copyright 2014 UPRtek All rights reserved
Cosine Correction
Cosine Correction
TELL ME MORE
8382 MK350 Series Survival Handbook
MK350 Series
MK350 Series
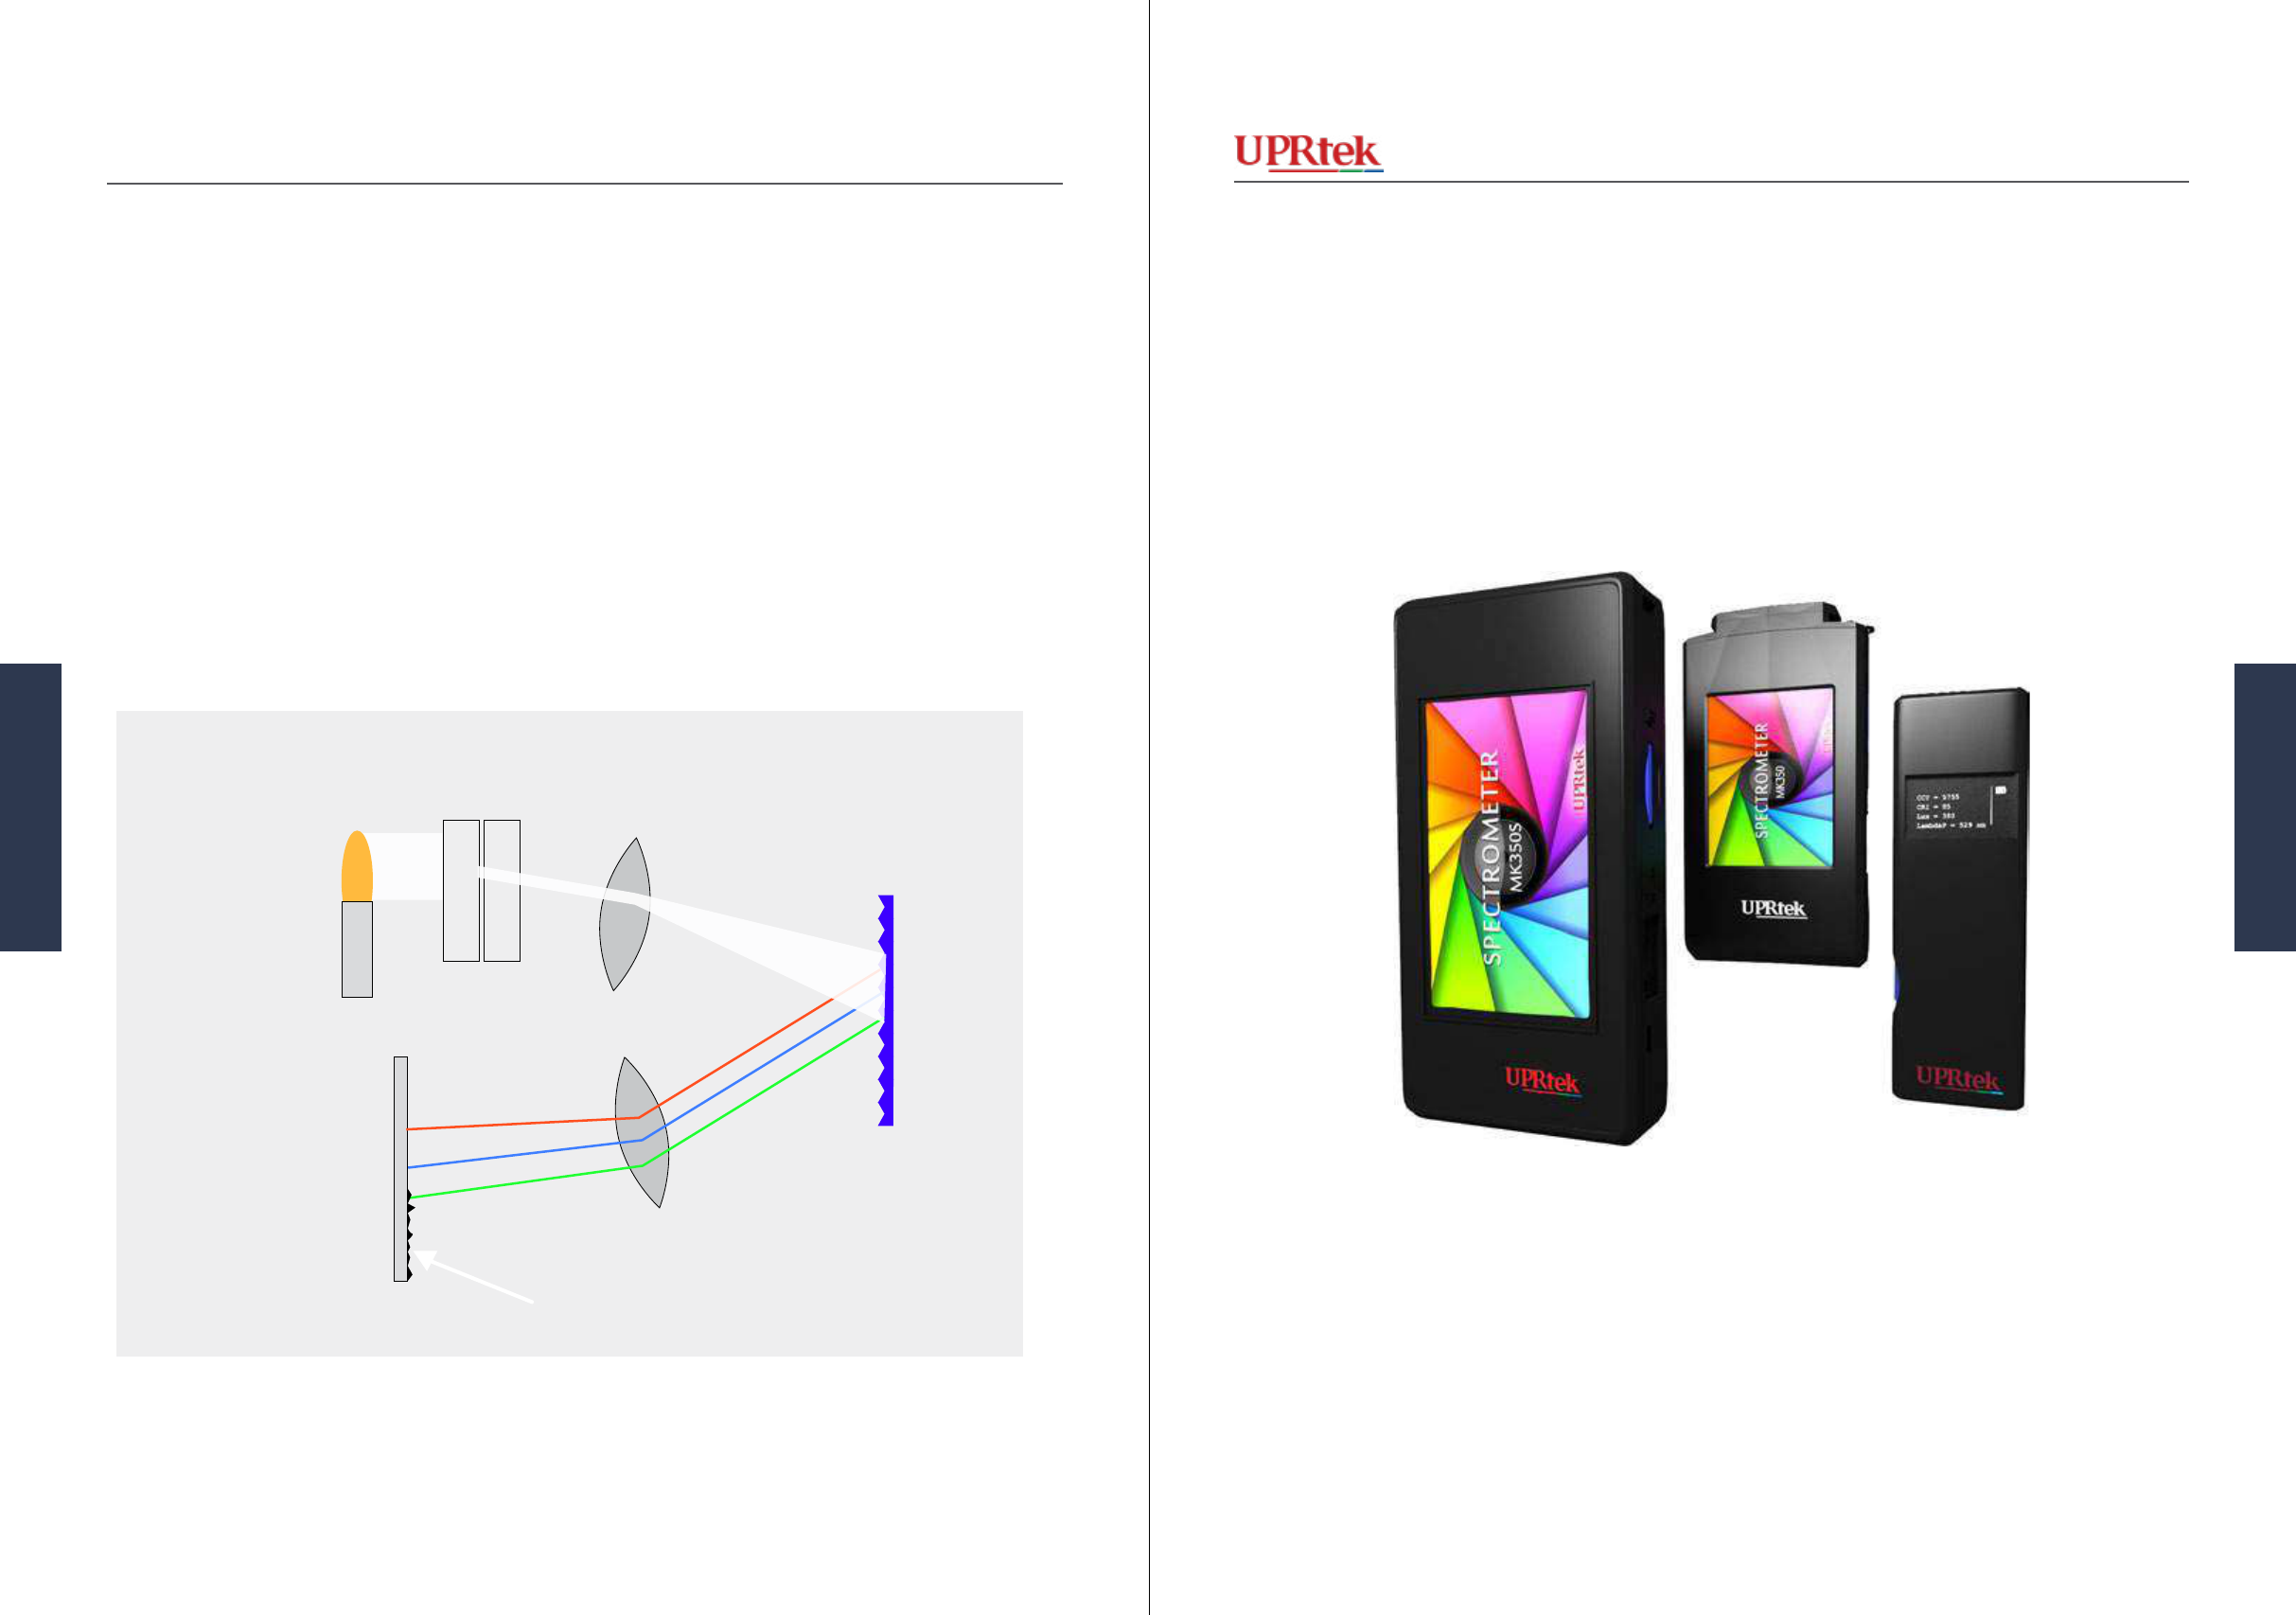
Light Source
Lens
Lens
Diraction Grating
CMOS Sensor
Slit
Electrical charge residue
Version 20140410b - Not for distribution - © Copyright 2014 UPRtek All rights reserved
Versio 20140410b - Not for distribution - © Copyright 2014 UPRtek All rights reserved
Dark Calibration is an optional operation in all of the MK350 devices. The devices will always
ask if you want to perform a Dark Calibration each time you turn on the device. While the device
is in operation, you can also, through the “Options” menu, manually execute a Dark Calibration.
What is Dark Calibration used for? Basically, an electrical residue or “charge” accumulates on
the CMOS sensor and may interfere with accurate measurements. This charge builds up when
the temperatures you are operating in changes signicantly. The other situation is when you
move from lighter to darker environments or vice versa. Also, it is a good time to perform a Dark
Calibration anytime you are experiencing some anomalies in measurements. The MK350 devices
always ask if you want to perform a Dark Calibration when powering on your device because it is
just good practice to do so.
Dark Calibration
Dark Calibration
8584 MK350 Series Survival Handbook
MK350 Series
MK350 Series
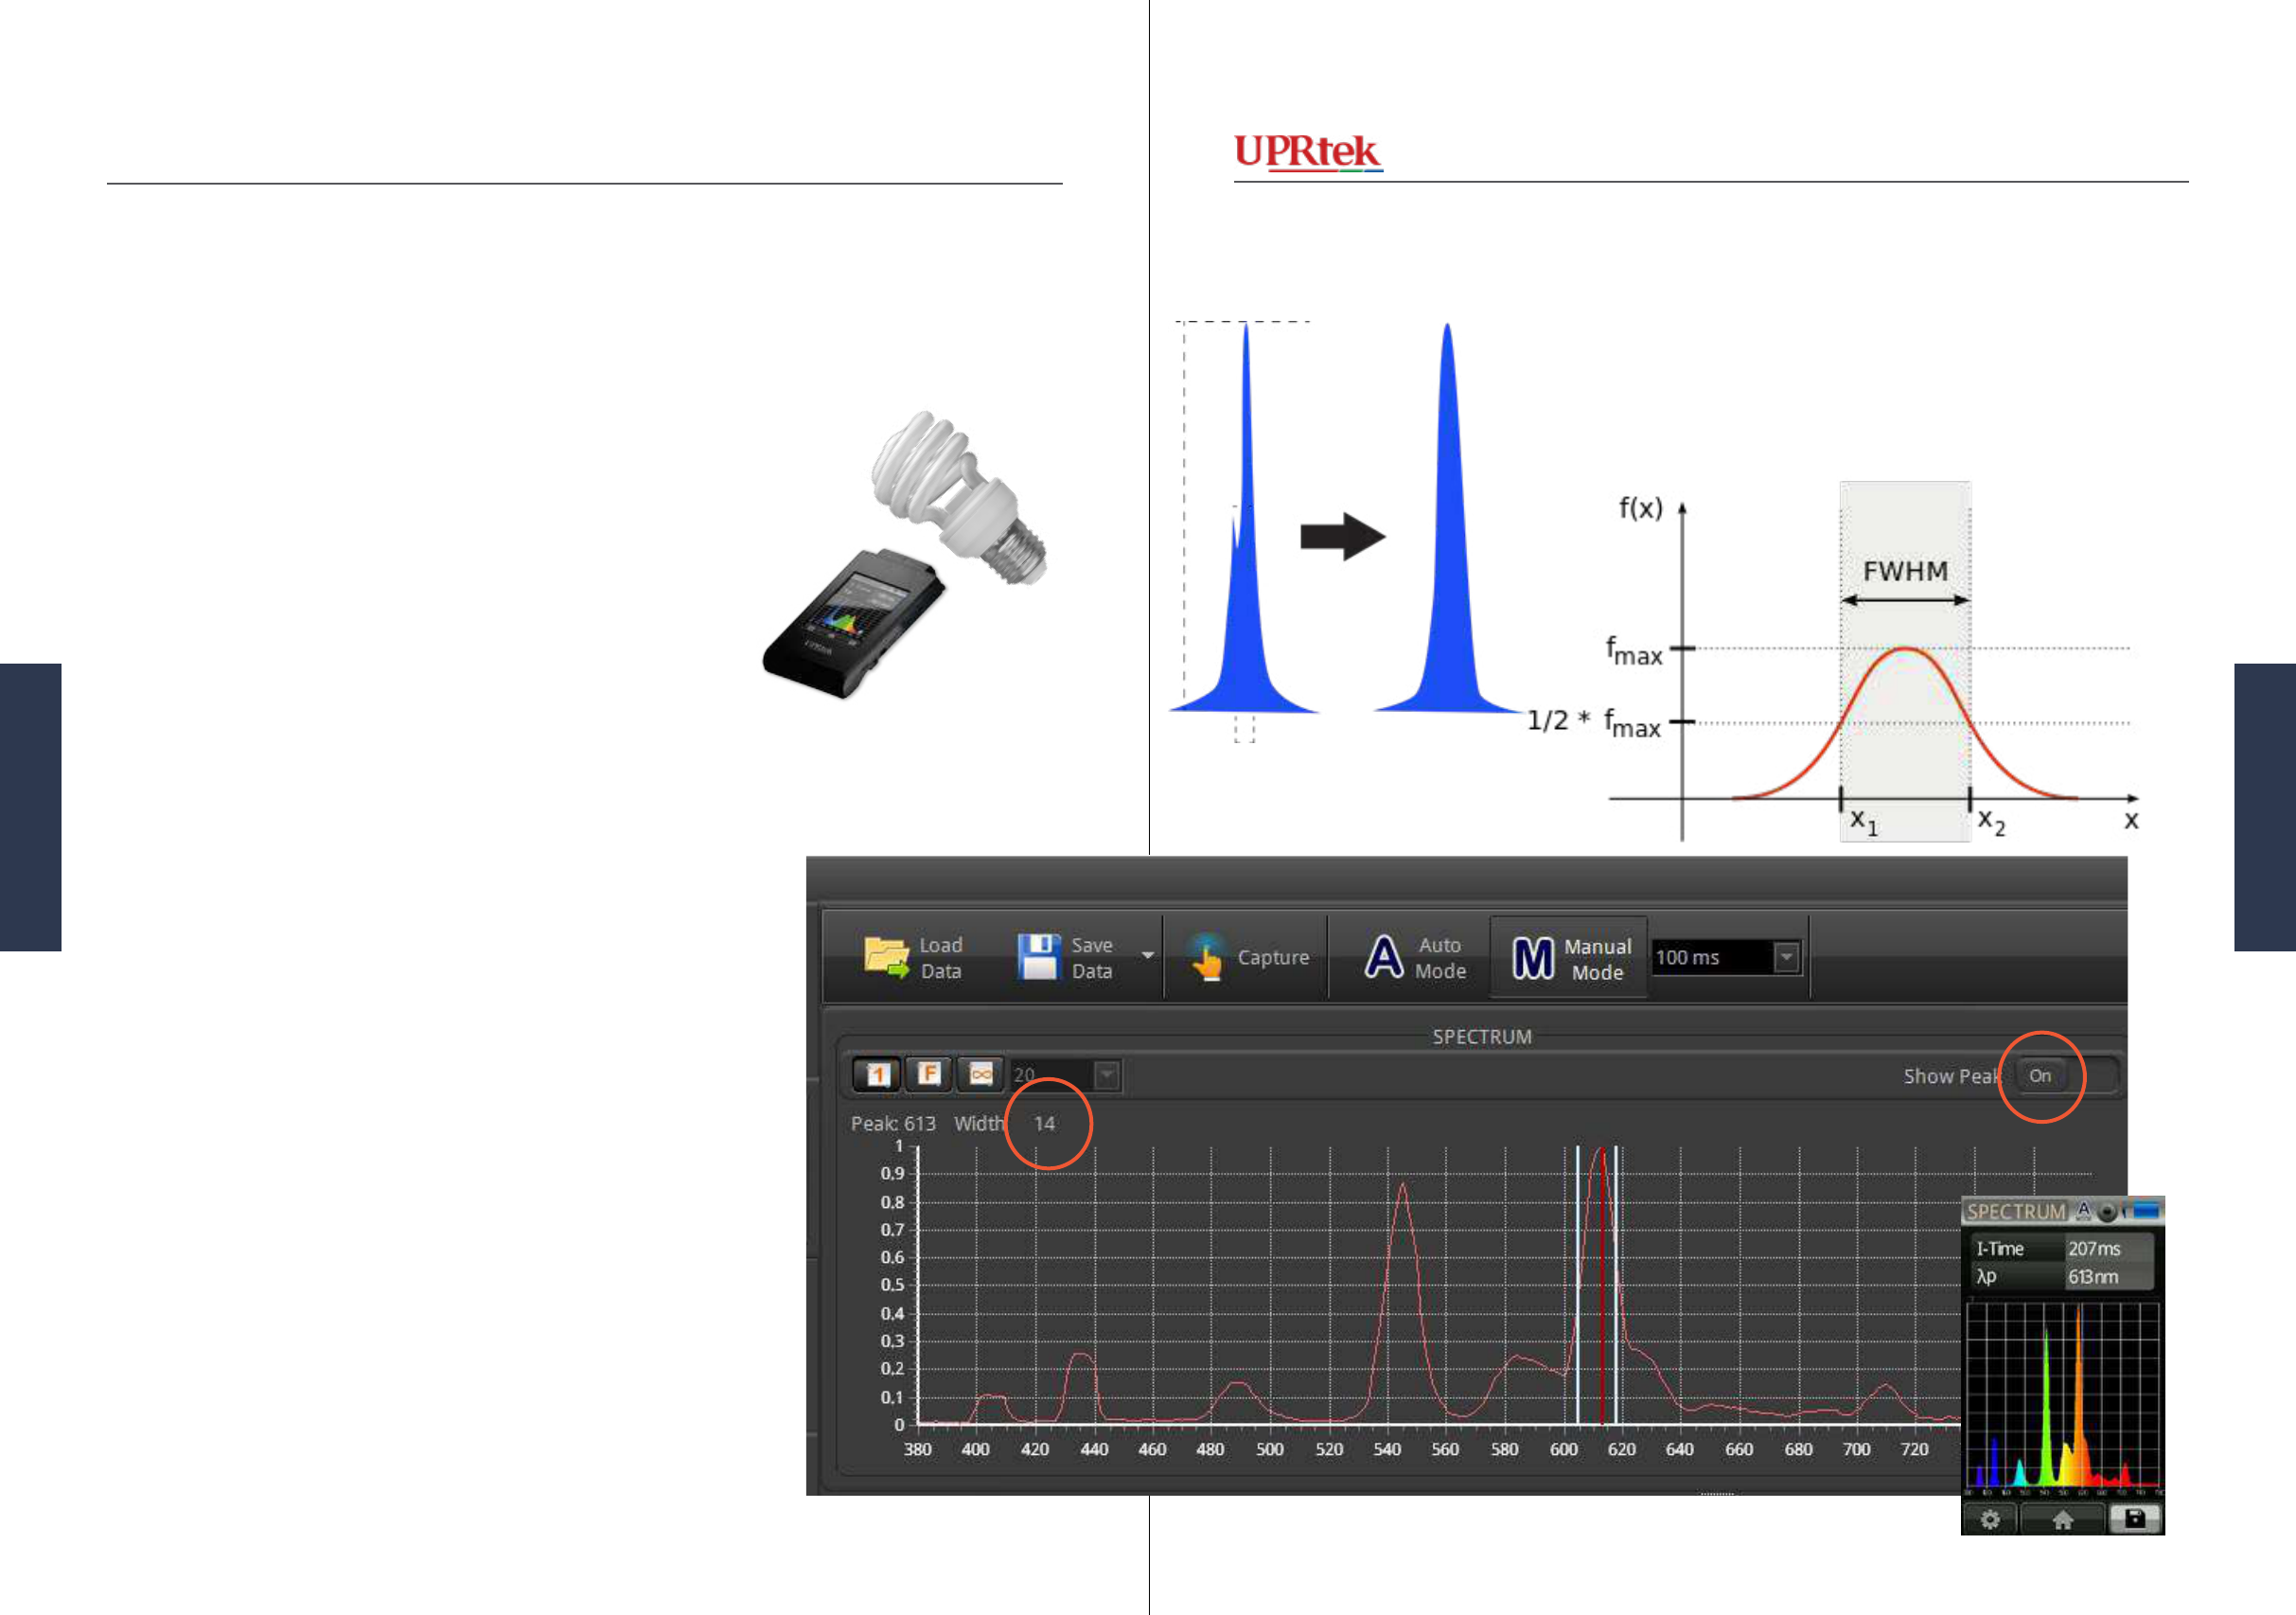
The detail in Spectral peaks for uorescent
lights may be too ne and could be smoothed
out by the Mk350.
Version 20140410b - Not for distribution - © Copyright 2014 UPRtek All rights reserved
Versio 20140410b - Not for distribution - © Copyright 2014 UPRtek All rights reserved
For all intents and purposes, yes it can. However, there is
one aspect of Fluorescent Lights to be aware of. The color
spectrum is NOT a conveniently xed set of individual
wavelengths to measure, but a continuum of wavelengths
(like a rainbow). It’s impossible and impractical for any
light meter to carve up the spectrum into innitely small
wavelengths. So, it carves up the spectrum into sections
and then does some averaging to come up with a continu-
um color spectrum to display on the screen.
However, everything within the width of the carved sec-
tion is averaged and details within are smoothed out. For
LEDs and Incandescents, it isn’t a problem - but for Fluo-
rescent Lights, the individual peaks are so thin, the device
may not have the resolution to catch all the details within.
This is the case with the MK350 and Fluorescent Lights.
The resolution of the MK350 is 12nm - this means that
2 or more peaks that fall within 12nm will be smoothed
out. Fluorescent Lights have peaks that can fall well
within 12nm - and so they are all smoothed. So what we
can determine from the MK350 and Fluorescent Light is a
general wavelength spectrum shape only.
To the right is the uSpectrum software, which can display
the half-bandwidth (Show Peak On). The half-bandwidth
is calculated by taking the λp (peak wave height)
1
and di-
viding it by 2 - next, at that 1/2 height, draw a vertical line
across the wave
2
- the thickness of the wavelength at that
height is called the half-bandwidth
3
. The half-bandwidth
for the peak shown in the diagram (right) is 14nm. How-
ever, since this is a Fluorescent Light, there may be several
sub-peaks within the 14 nm peak that were smoothed out.
Can the MK350 measure Fluorescent?
Measuring Fluorescent Light with MK350
4
5
half-bandwidth
1
2
3
Arne Nordmann (norro) - GDFL- CC-BY-SA-3.0 Wikimedia Commons
Half Bandwidth
On the uSpectrum screen, you have to turn “Show Peak”
On
4
- after a capture, the half-bandwidth will display in
the upper left corner
5
. Any detail within 12 nm sections
of the span will be smoothed out (averaged).
Half bandwidth is used by LED manufacturers to mea-
sure the thickness of the peaks, to try to measure color
consistency - too fat or too slim will obviously alter color
quality.
Sun Ladder - CC-BY-SA 3.0 - Wikimedia Commons
Half Bandwidth
8786 MK350 Series Survival Handbook
MK350 Series
MK350 Series
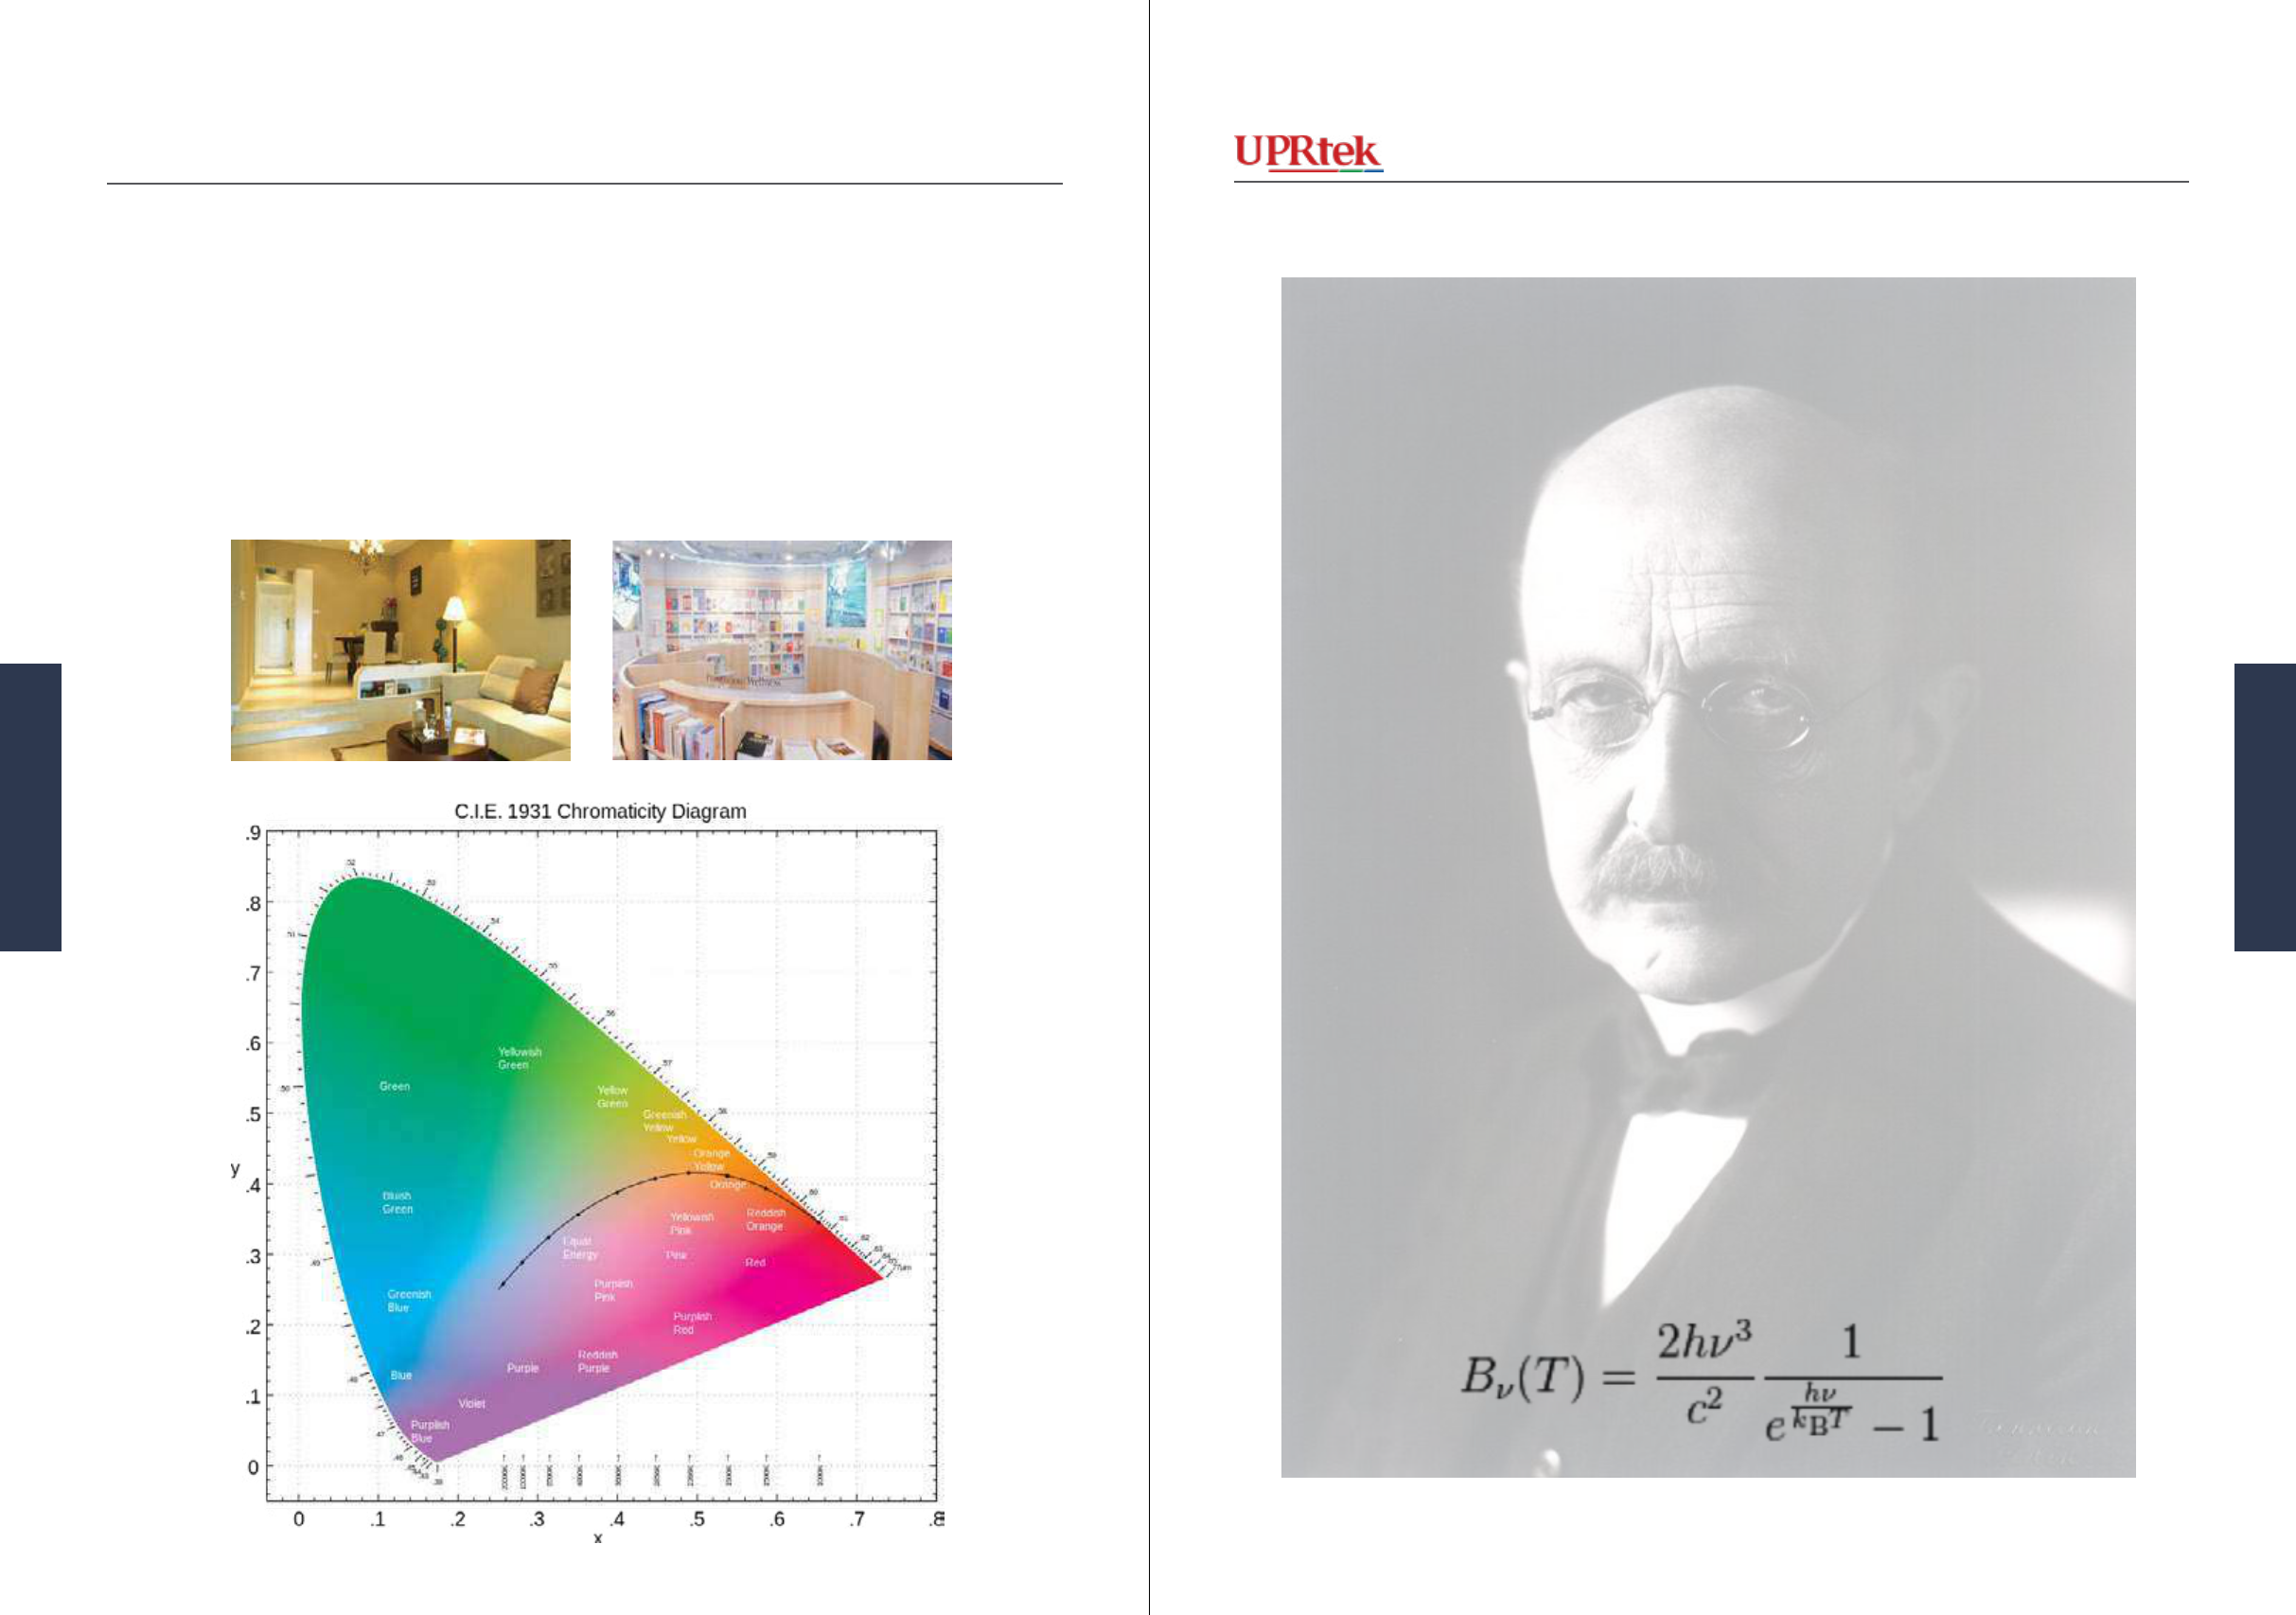
Previously, we discussed Black Body Radiators - basically, it is an object that heats up
and emits different wavelengths of light (color) as the temperature rises - these colors are
identied as Color Temperatures in Kelvin and are indicated on the Chromaticity Diagram
below as the black curved line, otherwise known as the Planckian Locus. Generally, the
Color Temperature (CT) for light bulbs tells designers whether the light emits a warm feel-
ing (inclined to reds) or cool feeling (inclined to blues).
Warm Feeling 2500K Cool Feeling 5600K
Why is it called Planckian Locus? Because Mr. Planck
came up with the mathematical equation (and constant) that explains the rela-
tionship between temperature and color (for incandescent sources of light like the
Sun or a Candle).
10000K
6000K
4000K
3000K
1500K
2000K
2500K
5000K
Planckian Locus
Max Plank 1858-1947
Paulschou at en.wikipedia- CC-BY-SA-3.0
Version 20140410b - Not for distribution - © Copyright 2014 UPRtek All rights reserved
Versio 20140410b - Not for distribution - © Copyright 2014 UPRtek All rights reserved
Planckian Locus
Planckian Locus
8988 MK350 Series Survival Handbook
MK350 Series
MK350 Series
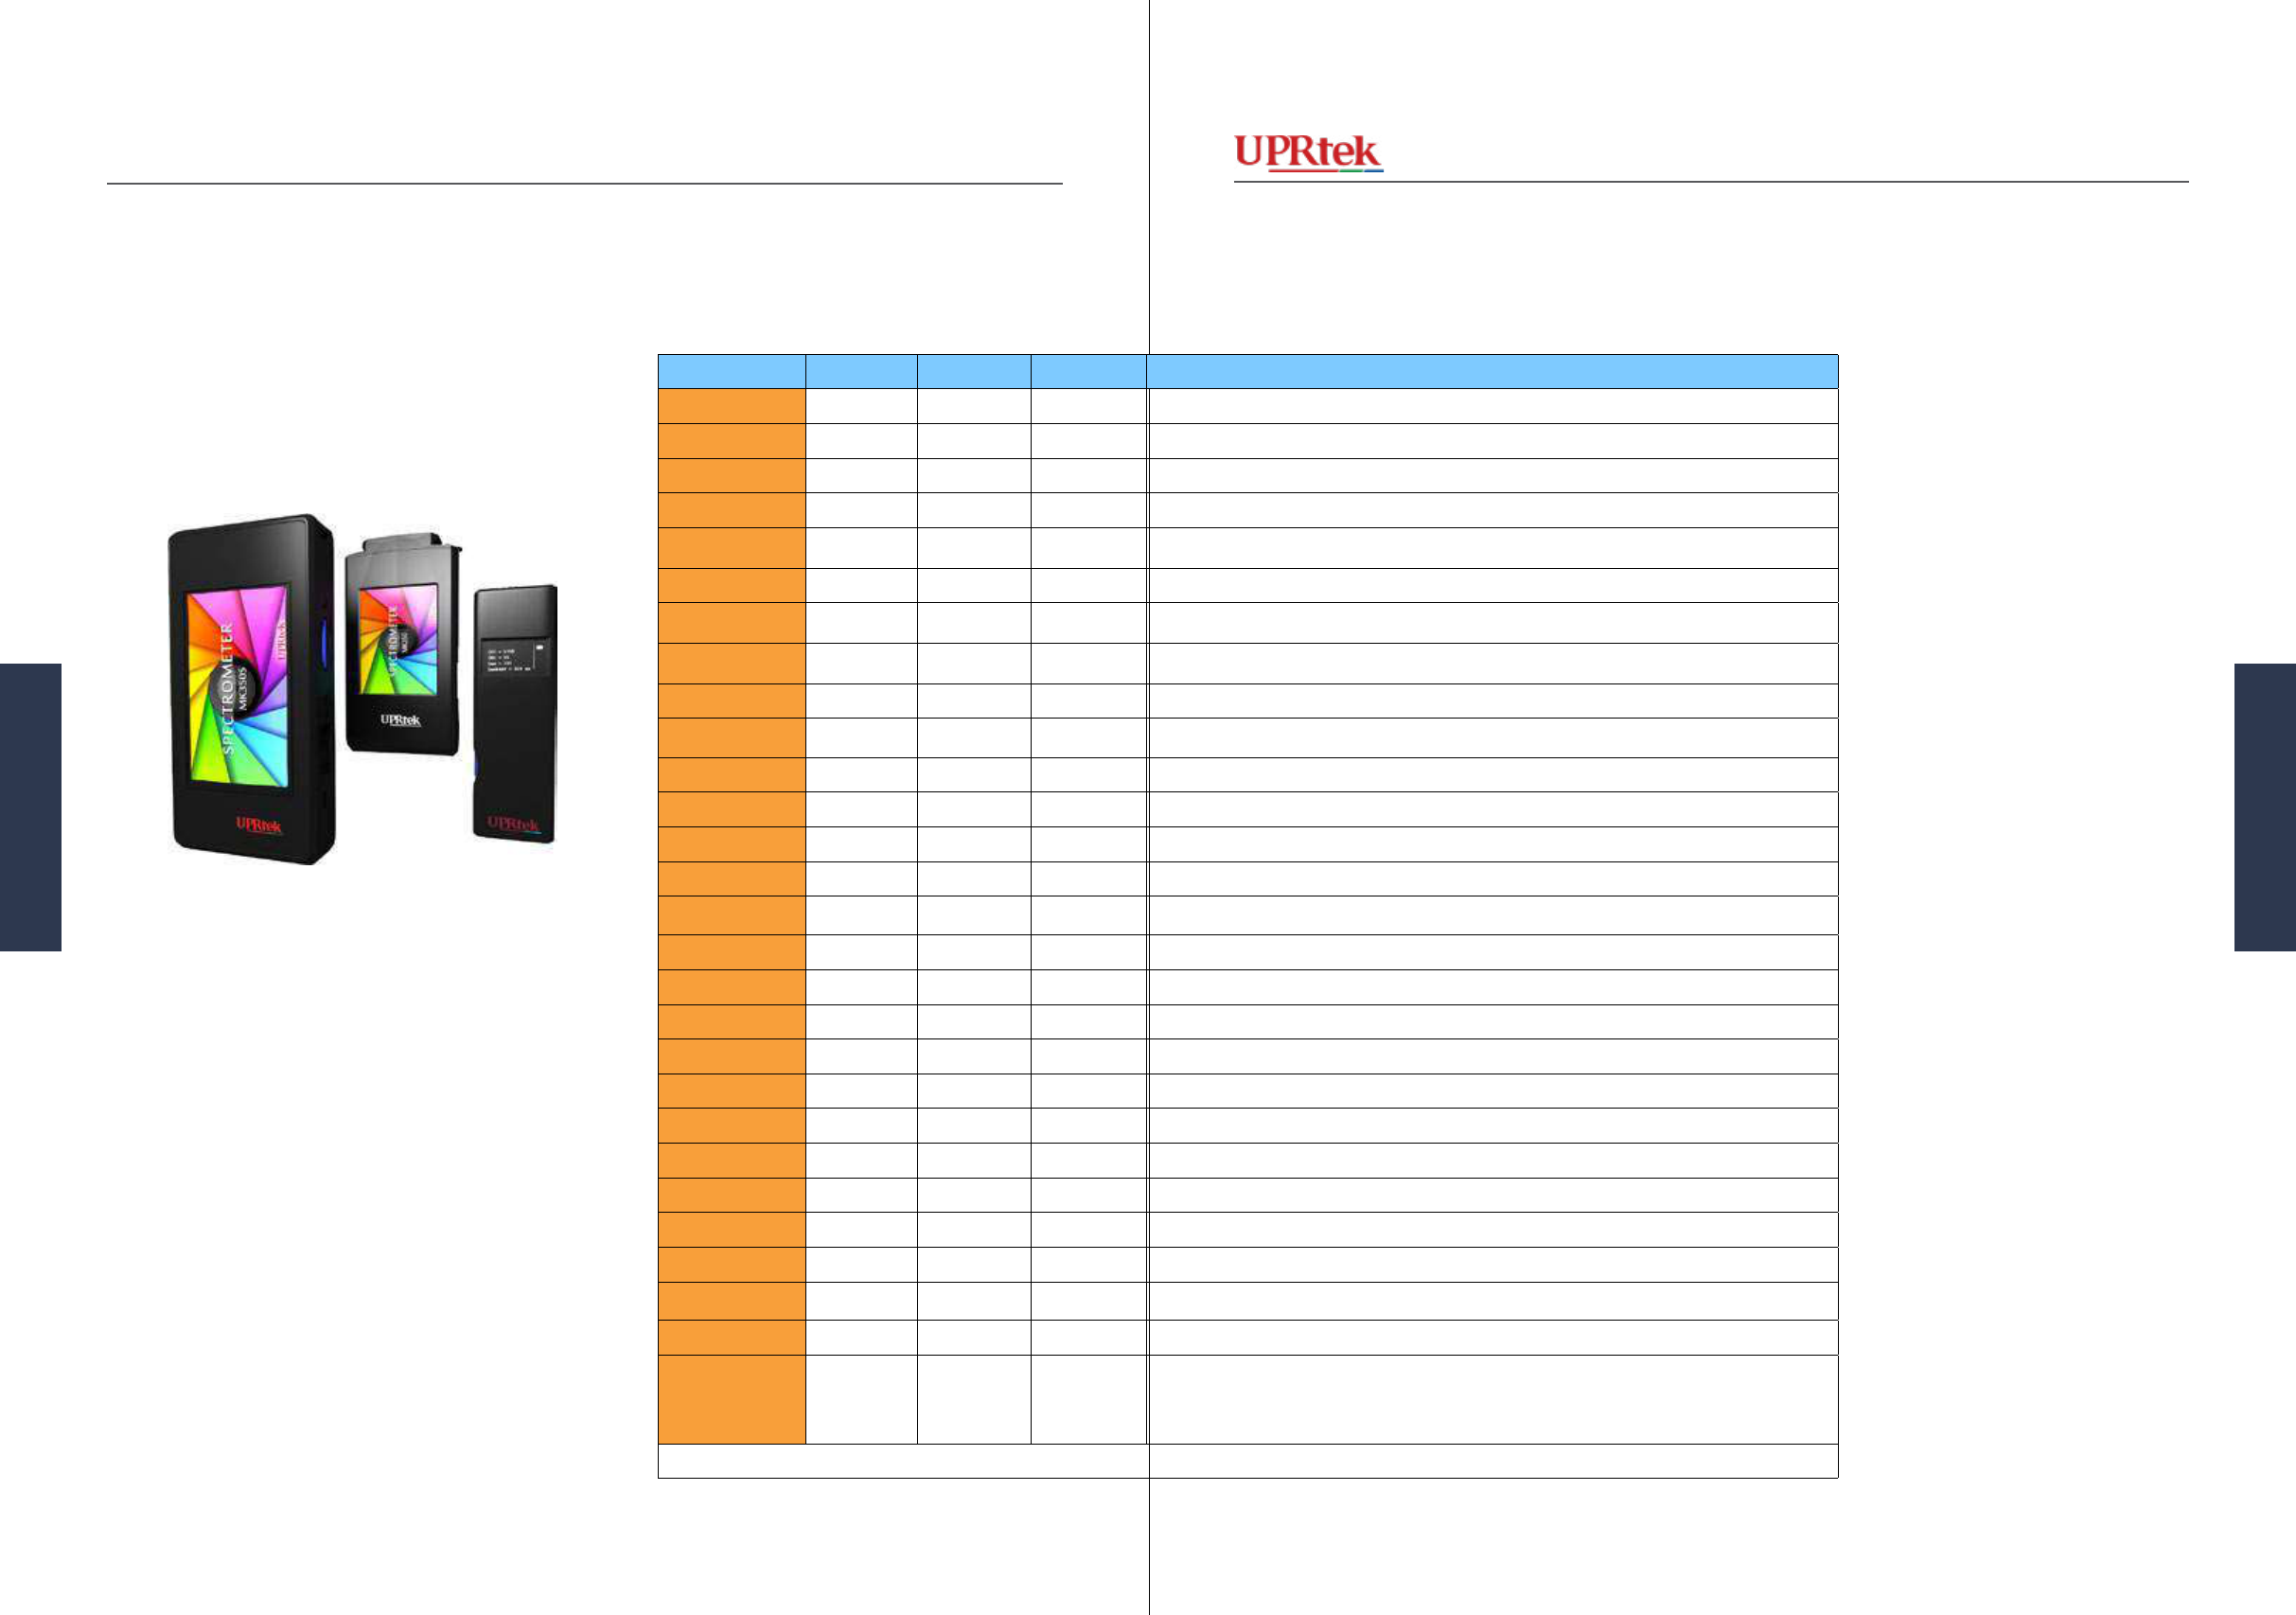
Version 20140410b - Not for distribution - © Copyright 2014 UPRtek All rights reserved
Versio 20140410b - Not for distribution - © Copyright 2014 UPRtek All rights reserved
This section lists the various unit mea-
surements and the page number where an
explanation can be found or a direct expla-
nation.
Rundown of Unit Measurements
Rundown of Unit Measurements
Unit Msr. MK350S MK350N MK350D Explanaon
CRI (Ra)
P P P
Lighng Store Display p130
CCT
P P P
Lighng Designers p107
LUX
P P P
Cosine Correcon p82, Lighng Designers p100
λp
P P P
Tallest peak in the Color Spectrum
I-Time
P P
a
P
a
Integraon me (like exposure me)
λd
P
Tesng and Calibrang LED-based screens and monitors p126
Purity
P
Tesng and Calibrang LED-based screens and monitors p126
R1-R8
P P
a
P
a
Lighng Store Display p 130
R9
P P
Lighng Store Display p 130
R10-R15
P P
a
Lighng Store Display p 130
x
P P P
Part of the Chromacity Explanaon p62
y
P P P
Part of the Chromacity Explanaon p62
u’
P P P
Similar to x coordinate but for CIE 1976 (p77)
v’
P P P
Similar to y coordinate but for CIE 1976 (p77)
Duv
P
Lighng Designers p108
∆x
P
Lighng Designers p108
∆y
P
Lighng Designers p108
∆u’
P
Lighng Designers p108
∆v’
P
Lighng Designers p108
PPF
P
Explained on p99
PPF-UV
P
Explained on p99
PPF-B
P
Explained on p99
PPF-G
P
Explained on p99
PPF-R
P
Explained on p99
PPF-NIR
P
Explained on p99
fc
P P
a
P
Foot Candle - Similar to LUX but is used mostly in the US. 1fc= 10.764 lux
Flicker %
P
Measuring Flicker p116
λp Value
(Lamdba PV)
P
a
P
a
P
a
Irradiance Intensity - “Lambda P” (λp) tells you the wavelength that has
the tallest Peak, “λp Value” tells you how tall that peak is in terms of
intensity.
a - Requires uSpectrum Soware
9190 MK350 Series Survival Handbook
MK350 Series
MK350 Series
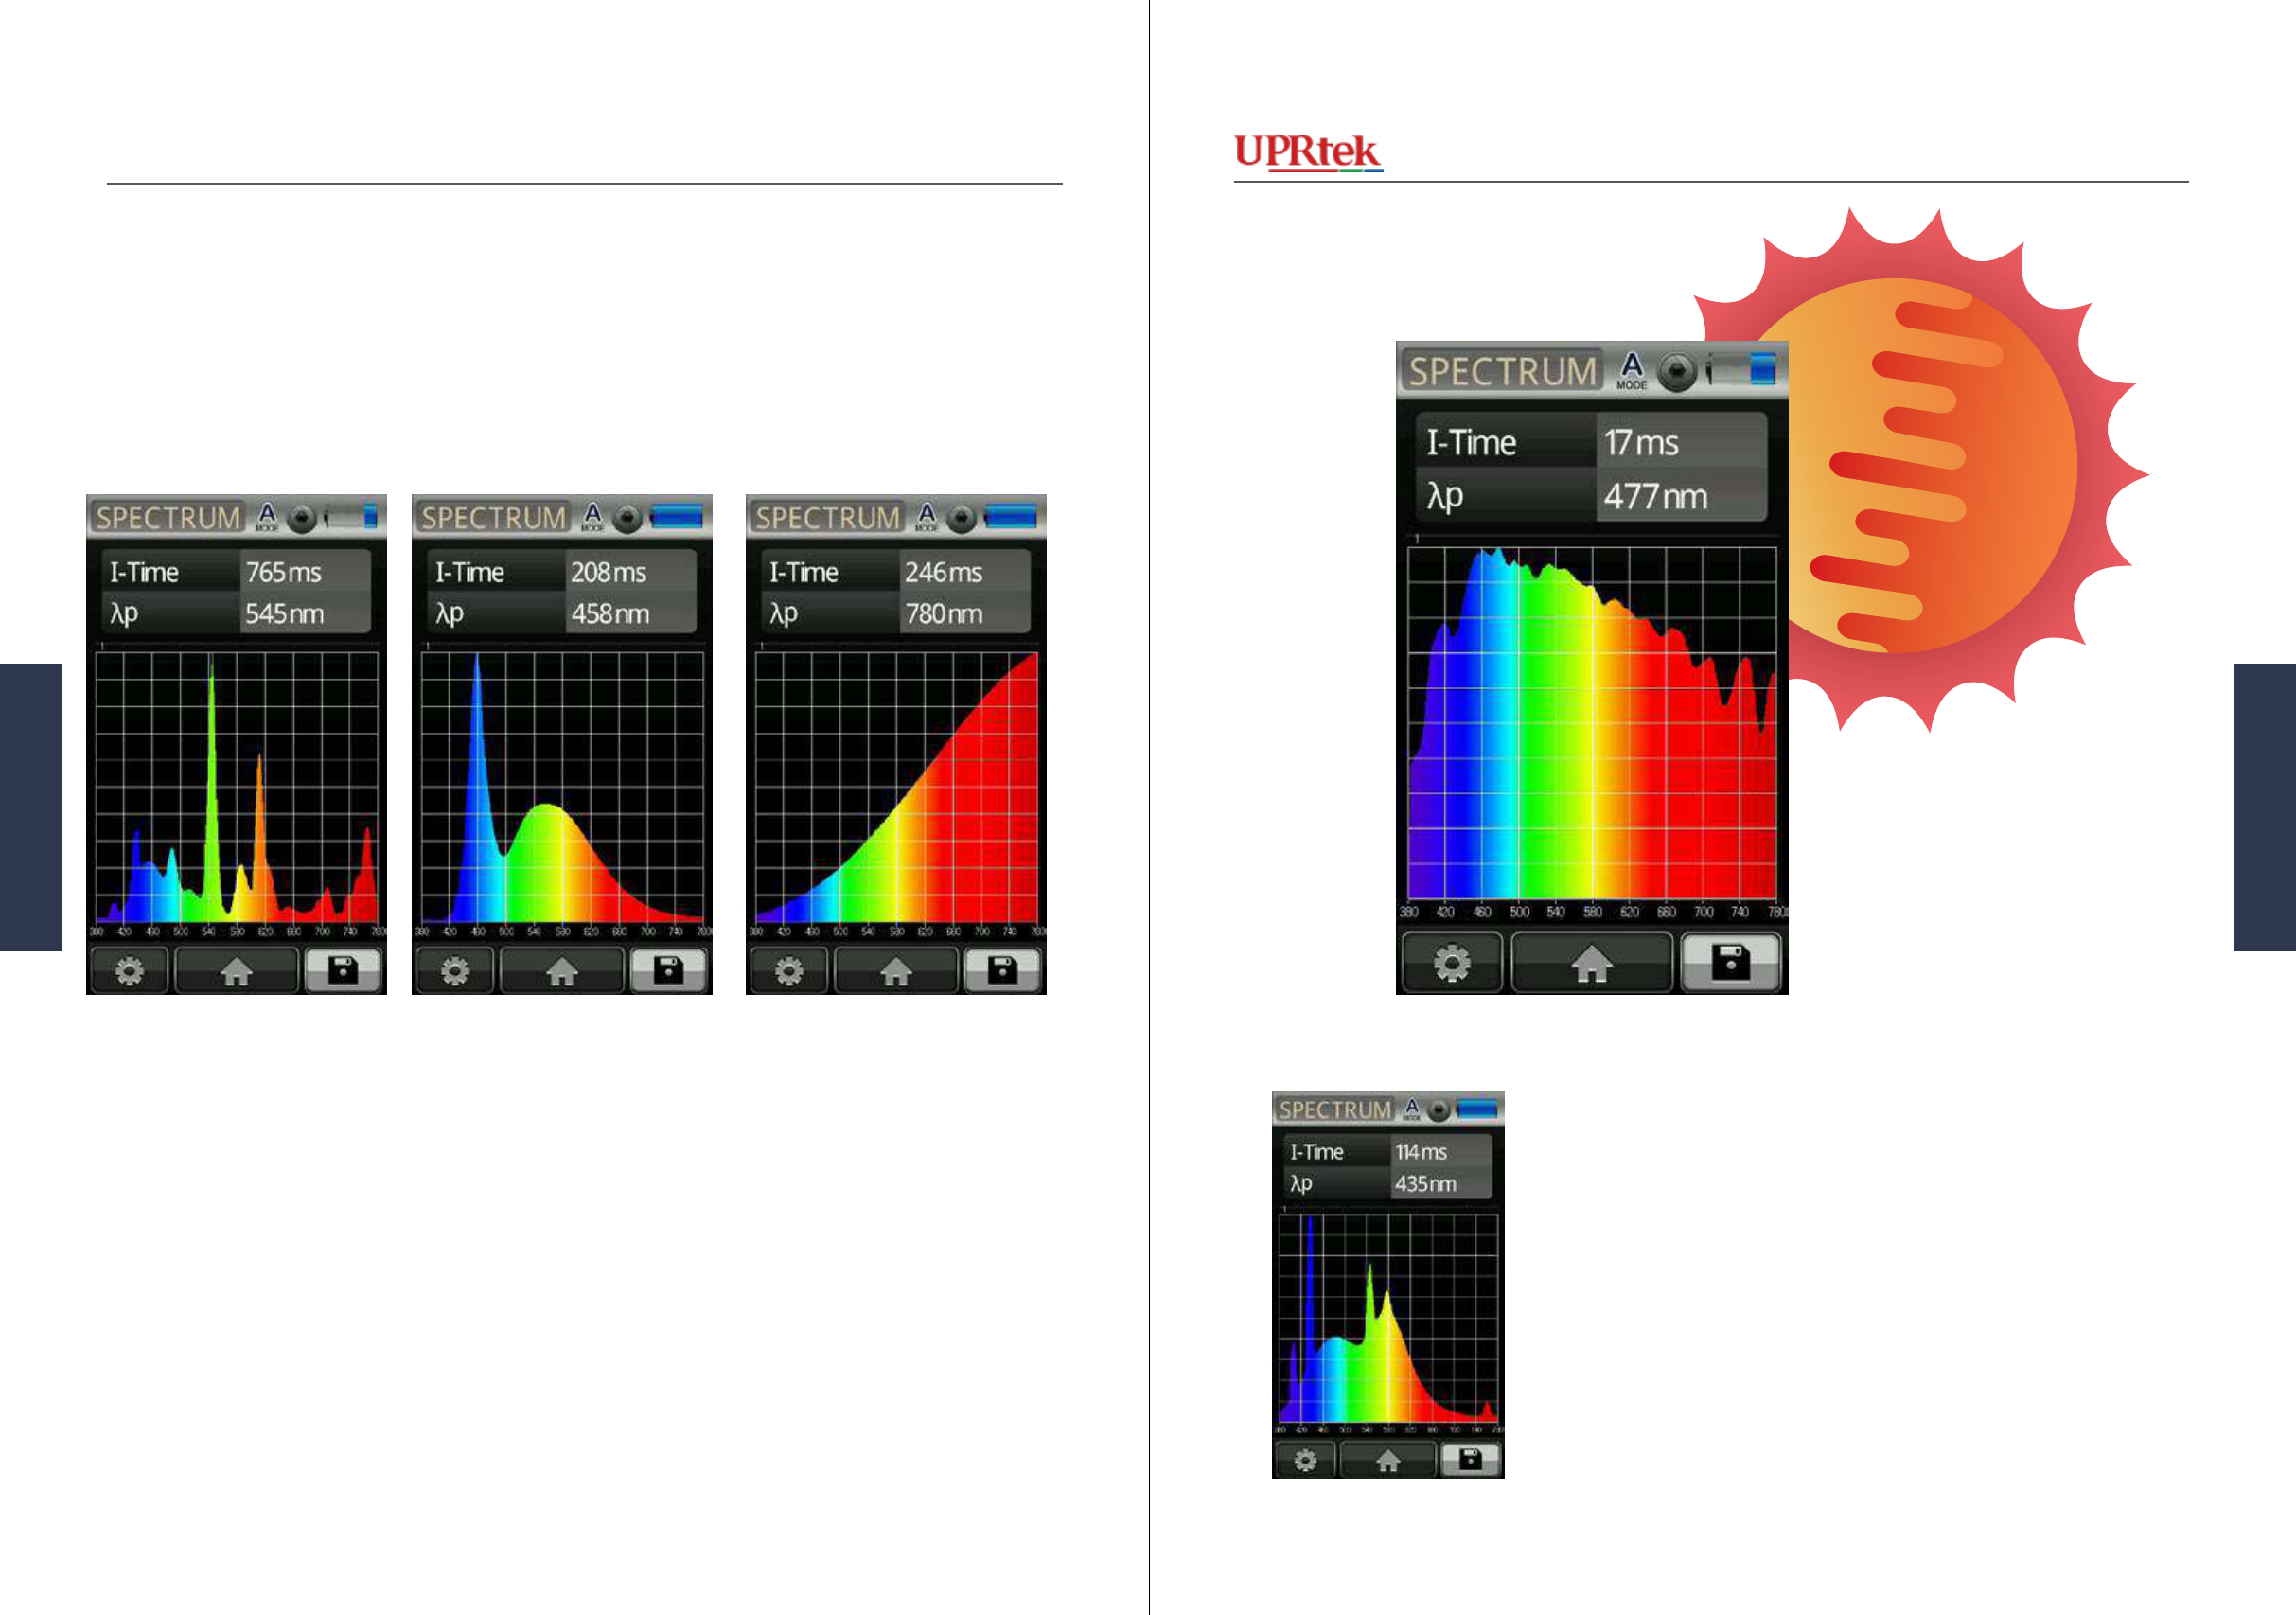
Version 20140410b - Not for distribution - © Copyright 2014 UPRtek All rights reserved
Versio 20140410b - Not for distribution - © Copyright 2014 UPRtek All rights reserved
These are the different color spectrums that you should get to know ...
Recognizing dierent wavelength spectra
Fluorescent Light LED Light Incandescent Light
The important LED character-
istic to understand is that there
are two peaks. The rst peak
represents the bluish light from
the semiconductor. The green-
yellow-red peak indicates the
colors emanating from the yel-
low phosphor layer.
Fluorescent Lights have this
distinctive jagged continuum.
Notice the small amount of UV
radiation (under 400nm) - it’s
presumably from the UV radia-
tion emanating from the Mercu-
ry vapor (CONFIRM).
This is from an Incandescent
bulb. This continuum of color
wavelengths is indicative of a
Black Body radiator. Notice
how it leans more towards the
red colors - that is what makes
incandescent lights feel “warm-
er”. As you increase the tem-
perature of a Black Body Ra-
diator, the color should change
from reds to more blues (see
Sun Light on next page).
Recognizing Dierent Wavelength Spectra
Sun Light
Can you guess where this was
captured? Hint - notice the
jagged peaks, but also notice
the distinctive blue peak and
green-yellow-orange peaks.
Taken between LED and Fluorescent Lights.
Sunlight is the gold standard for
light. Notice that it has the most
even continuum of colors, which
means it renders all colors very
vividly. Also notice the relative-
ly high amounts of UV radiation
(< 400 nm) which is harmful to
the eyes and skin.
9392 MK350 Series Survival Handbook
MK350 Series
MK350 Series
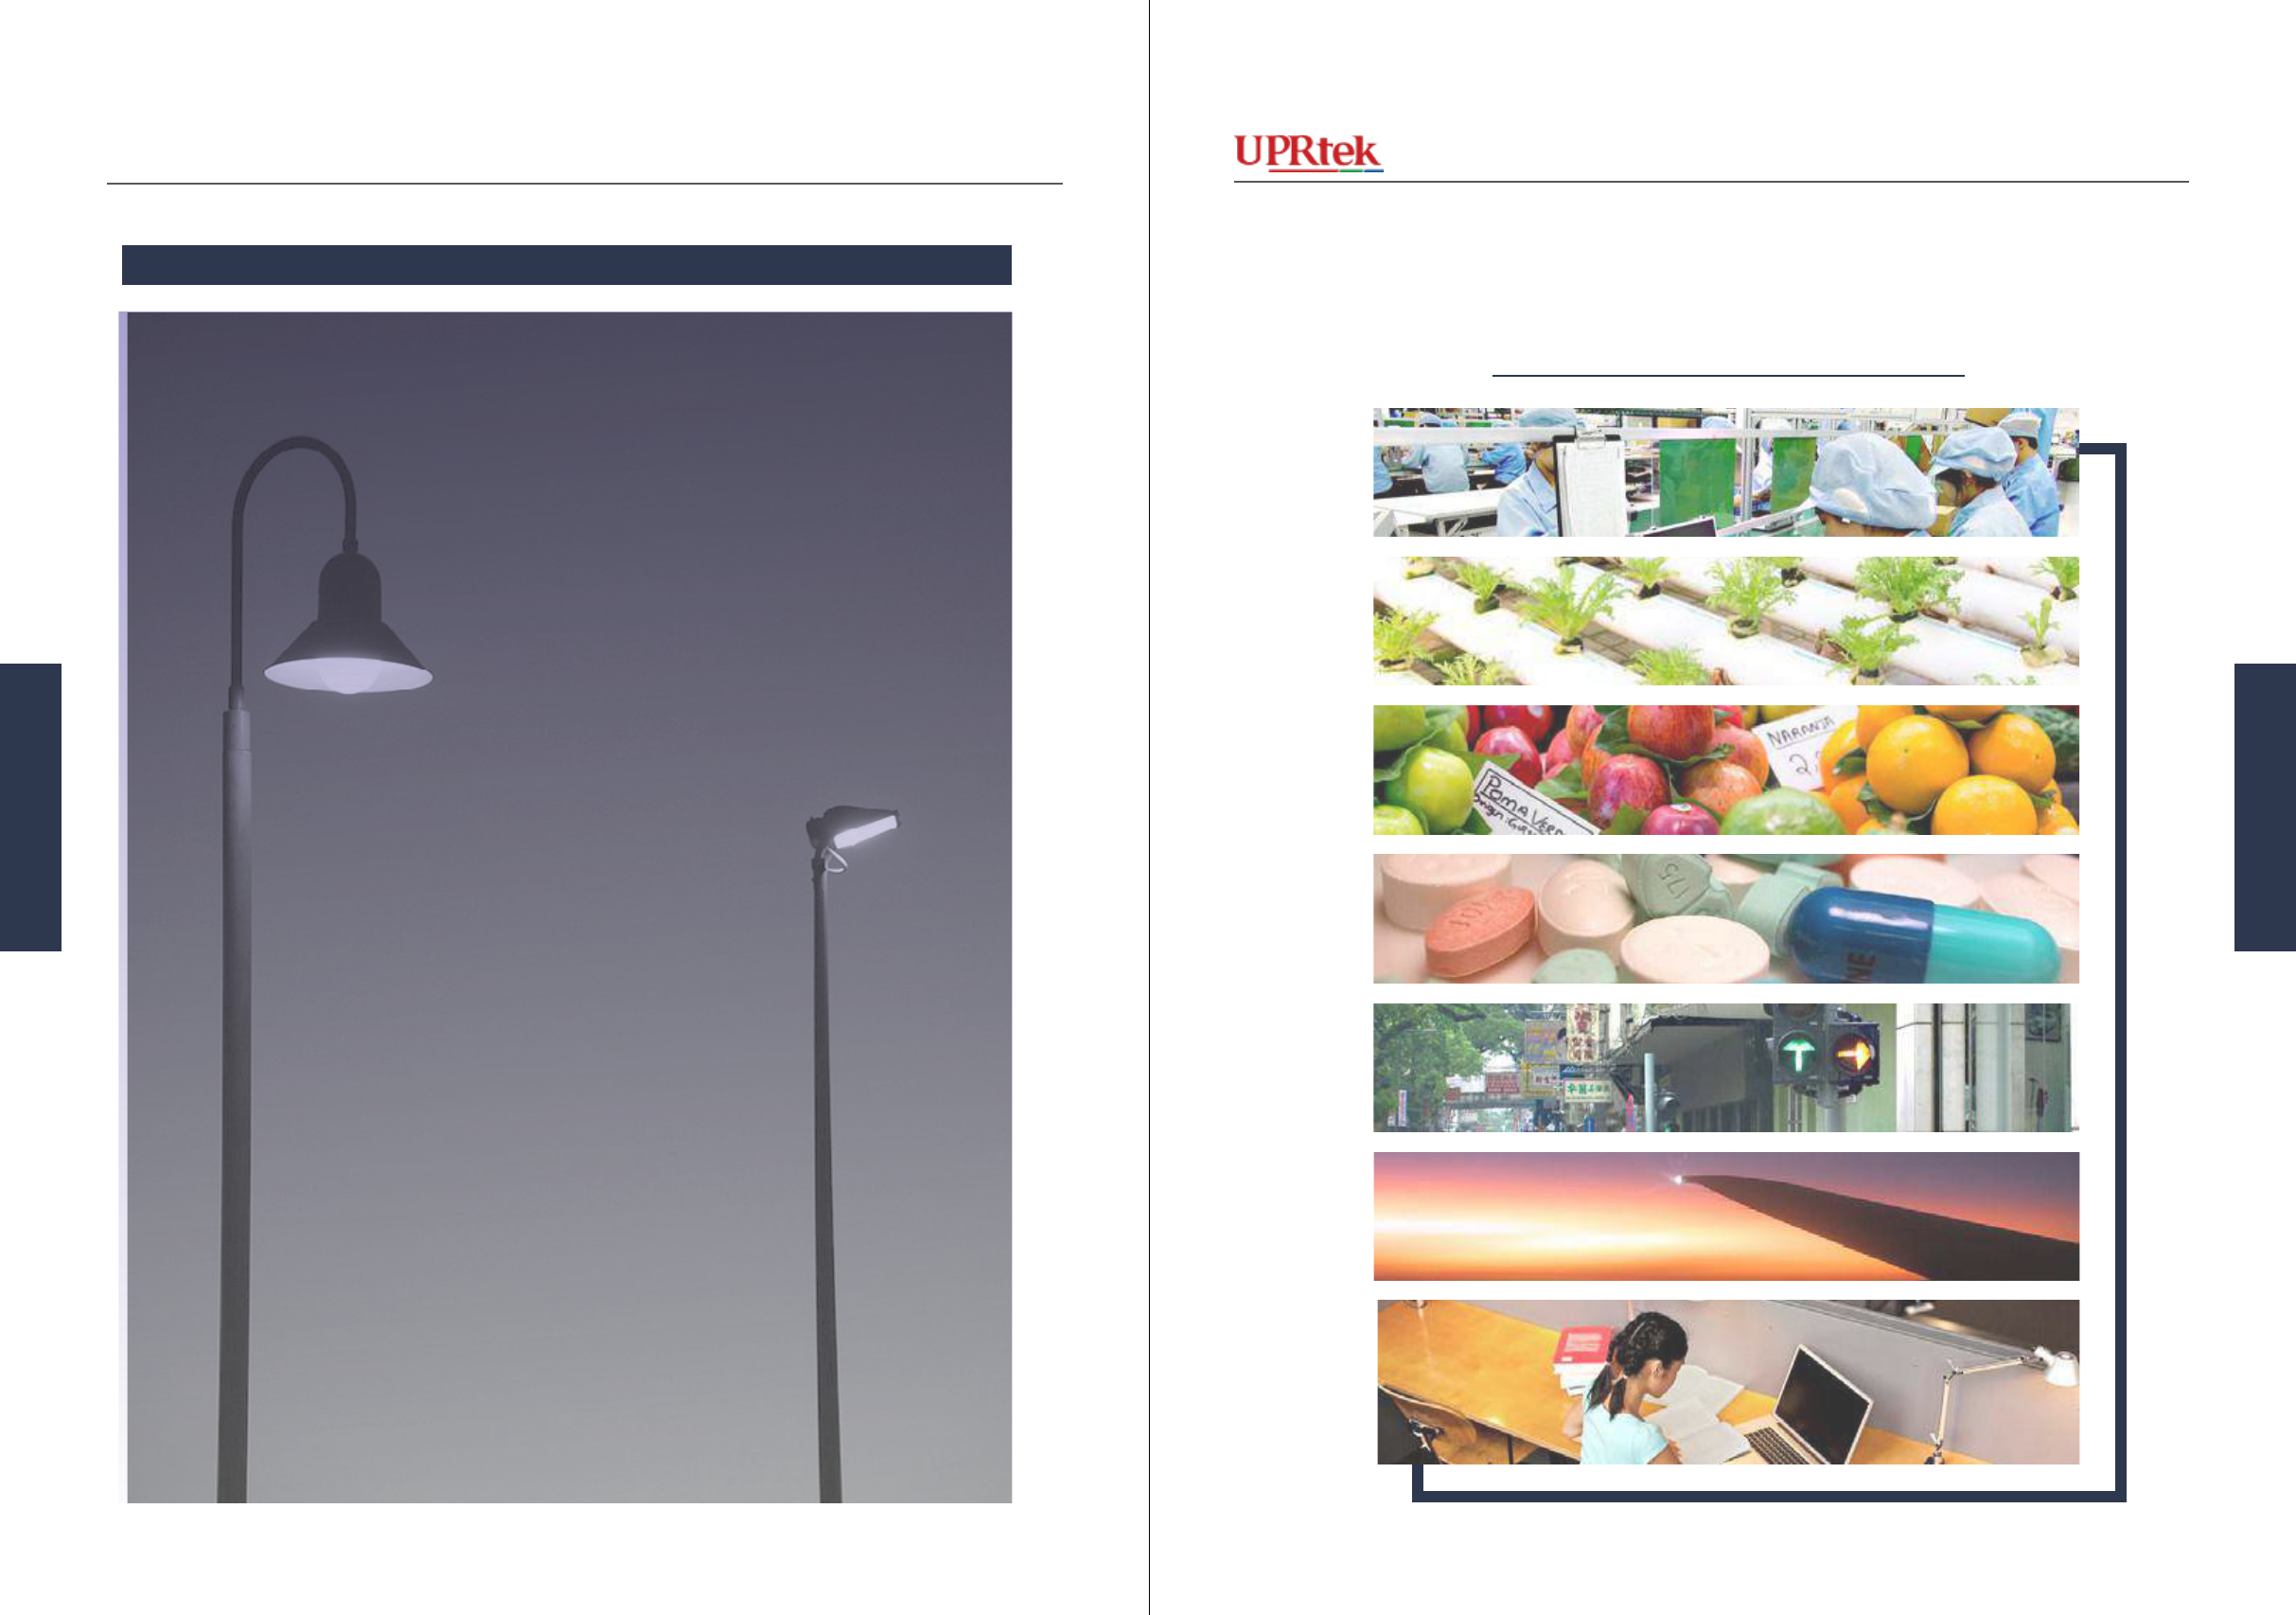
Version 20140410b - Not for distribution - © Copyright 2014 UPRtek All rights reserved
Versio 20140410b - Not for distribution - © Copyright 2014 UPRtek All rights reserved
MK350
Wikipedia Creative Commons Attribution-Share Alike 3.0 Unported - no author
Applications
App
Applications
Wikipedia Creative Commons Attribution-Share Alike 2.0 Geeric - Tony Hisgett
9594 MK350 Series Survival Handbook
Applicaons
Applicaons
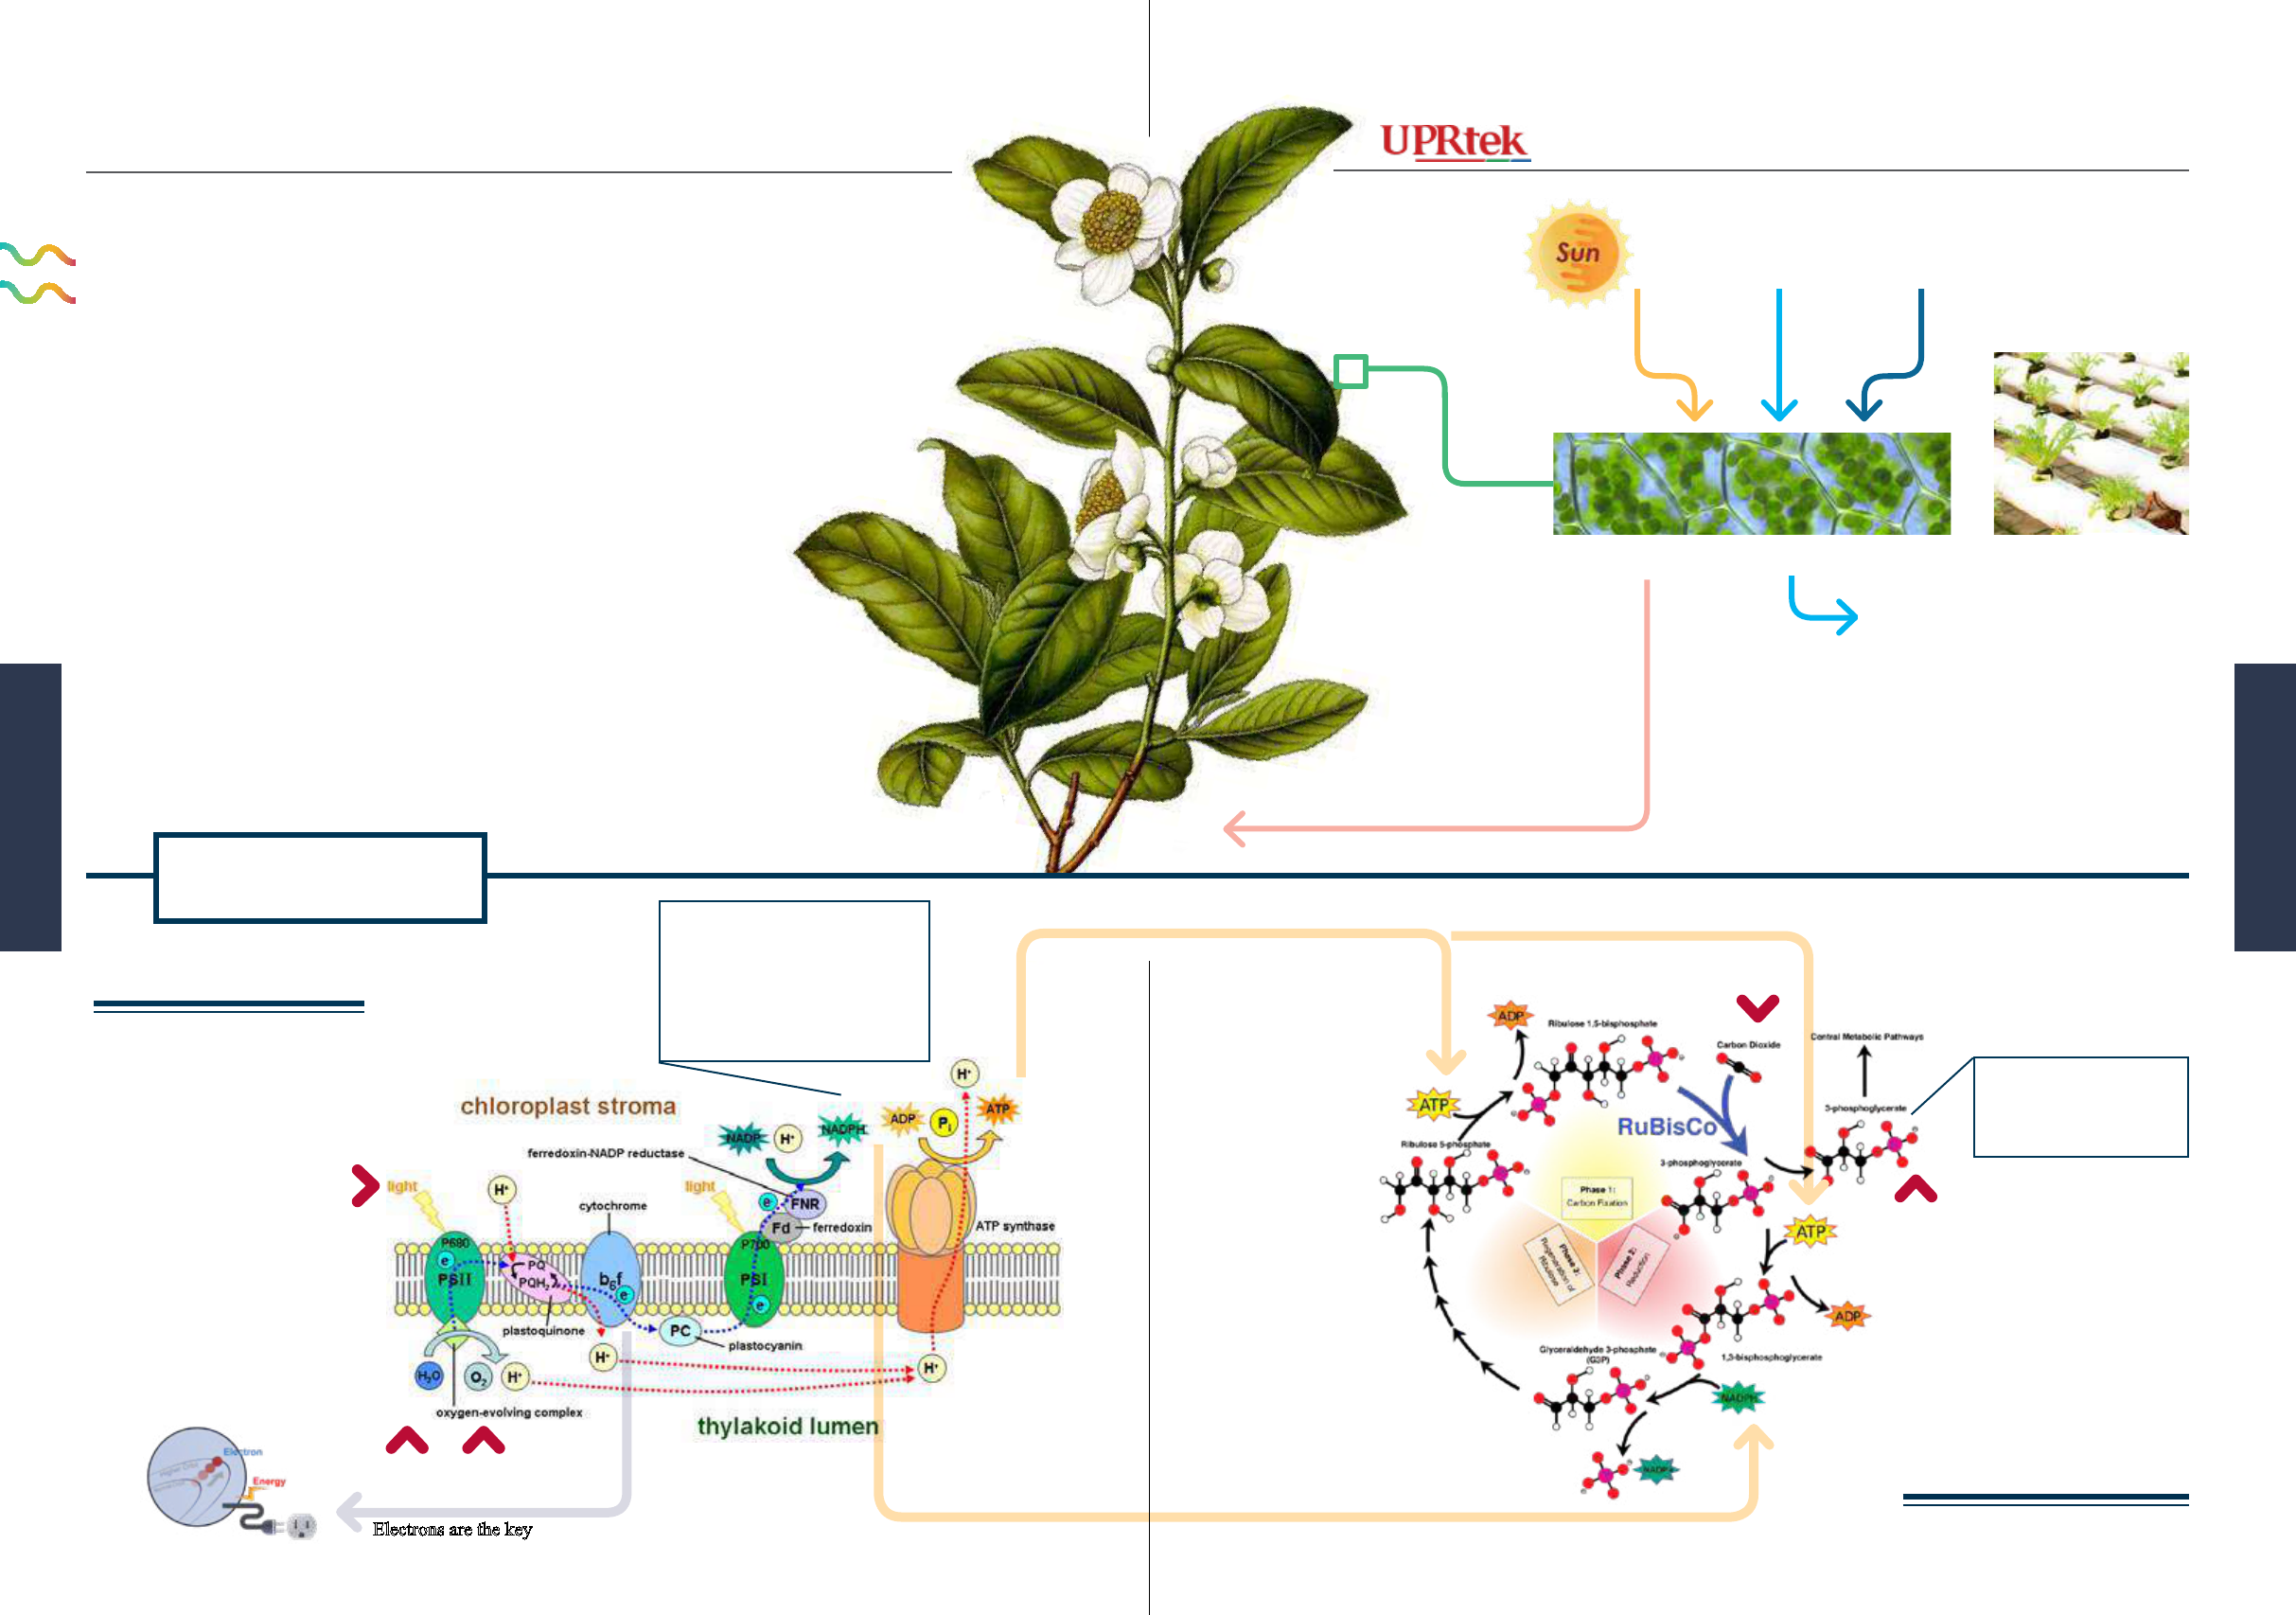
Watch a Video
Version 20140410b - Not for distribution - © Copyright 2014 UPRtek All rights reserved
Versio 20140410b - Not for distribution - © Copyright 2014 UPRtek All rights reserved
Indoor Agriculture has been in-
creasingly gaining interest as a
means for plant-assisted growth
using articial light. This has
ramications for supplemental
food production during winter
months, especially in regions
with short-days and reduced
sunlight. This technology also
has the commercial potential for
1
Light Reactions
Light
H
2
O
O
2
ornamental plants as well and even perhaps
for growing plants 24 hours / day.
Plant assisted growth using articial
light uses wavelengths described as PAR
(photosynthetically active radiation). It
is measured in PPF (Photosynthetic Photo
Flux), which is the amount of light in the 400-
700 nm range that falls on a square meter in 1
second: µmol m-2 s-1 (micromoles of photons
per meter squared per second).
Photosynthesis
Electrons are the key
By Kristian Peters -- Fabelfroh, GNU Free Documentation,
Creative Commons Attribution-Share Alike 3.0 Unported
Plants use Sunlight, Carbon Dioxide and Water to
make sugars used to fuel the plant’s activities (e.g.
growth, germination) - this is called Photosynthe-
sis. This process can be simplied into 2 steps -
Light Reactions and the Calvin Cycle (sometimes
called Photosystem II & Photosystem I).
Sugars are used for
growth, germination,
owering etc.
2 Calvin Cycle
Light
CO
2
CO
2
H
2
O
O
2
Sugar
Sugar
ATP and NADPH are very
important energy stores (like
batteries) that can be used for
many processes. In fact, the
human body also uses ATP
and NADPH everywhere.
Light and
Agriculture
Light and Agriculture
http://www.youtube.com/watch?v=g78utcLQrJ4
Mike Jones - CC-BY-SA-3.0
9796
Applicaons
Applicaons
MK350 Series Survival Handbook
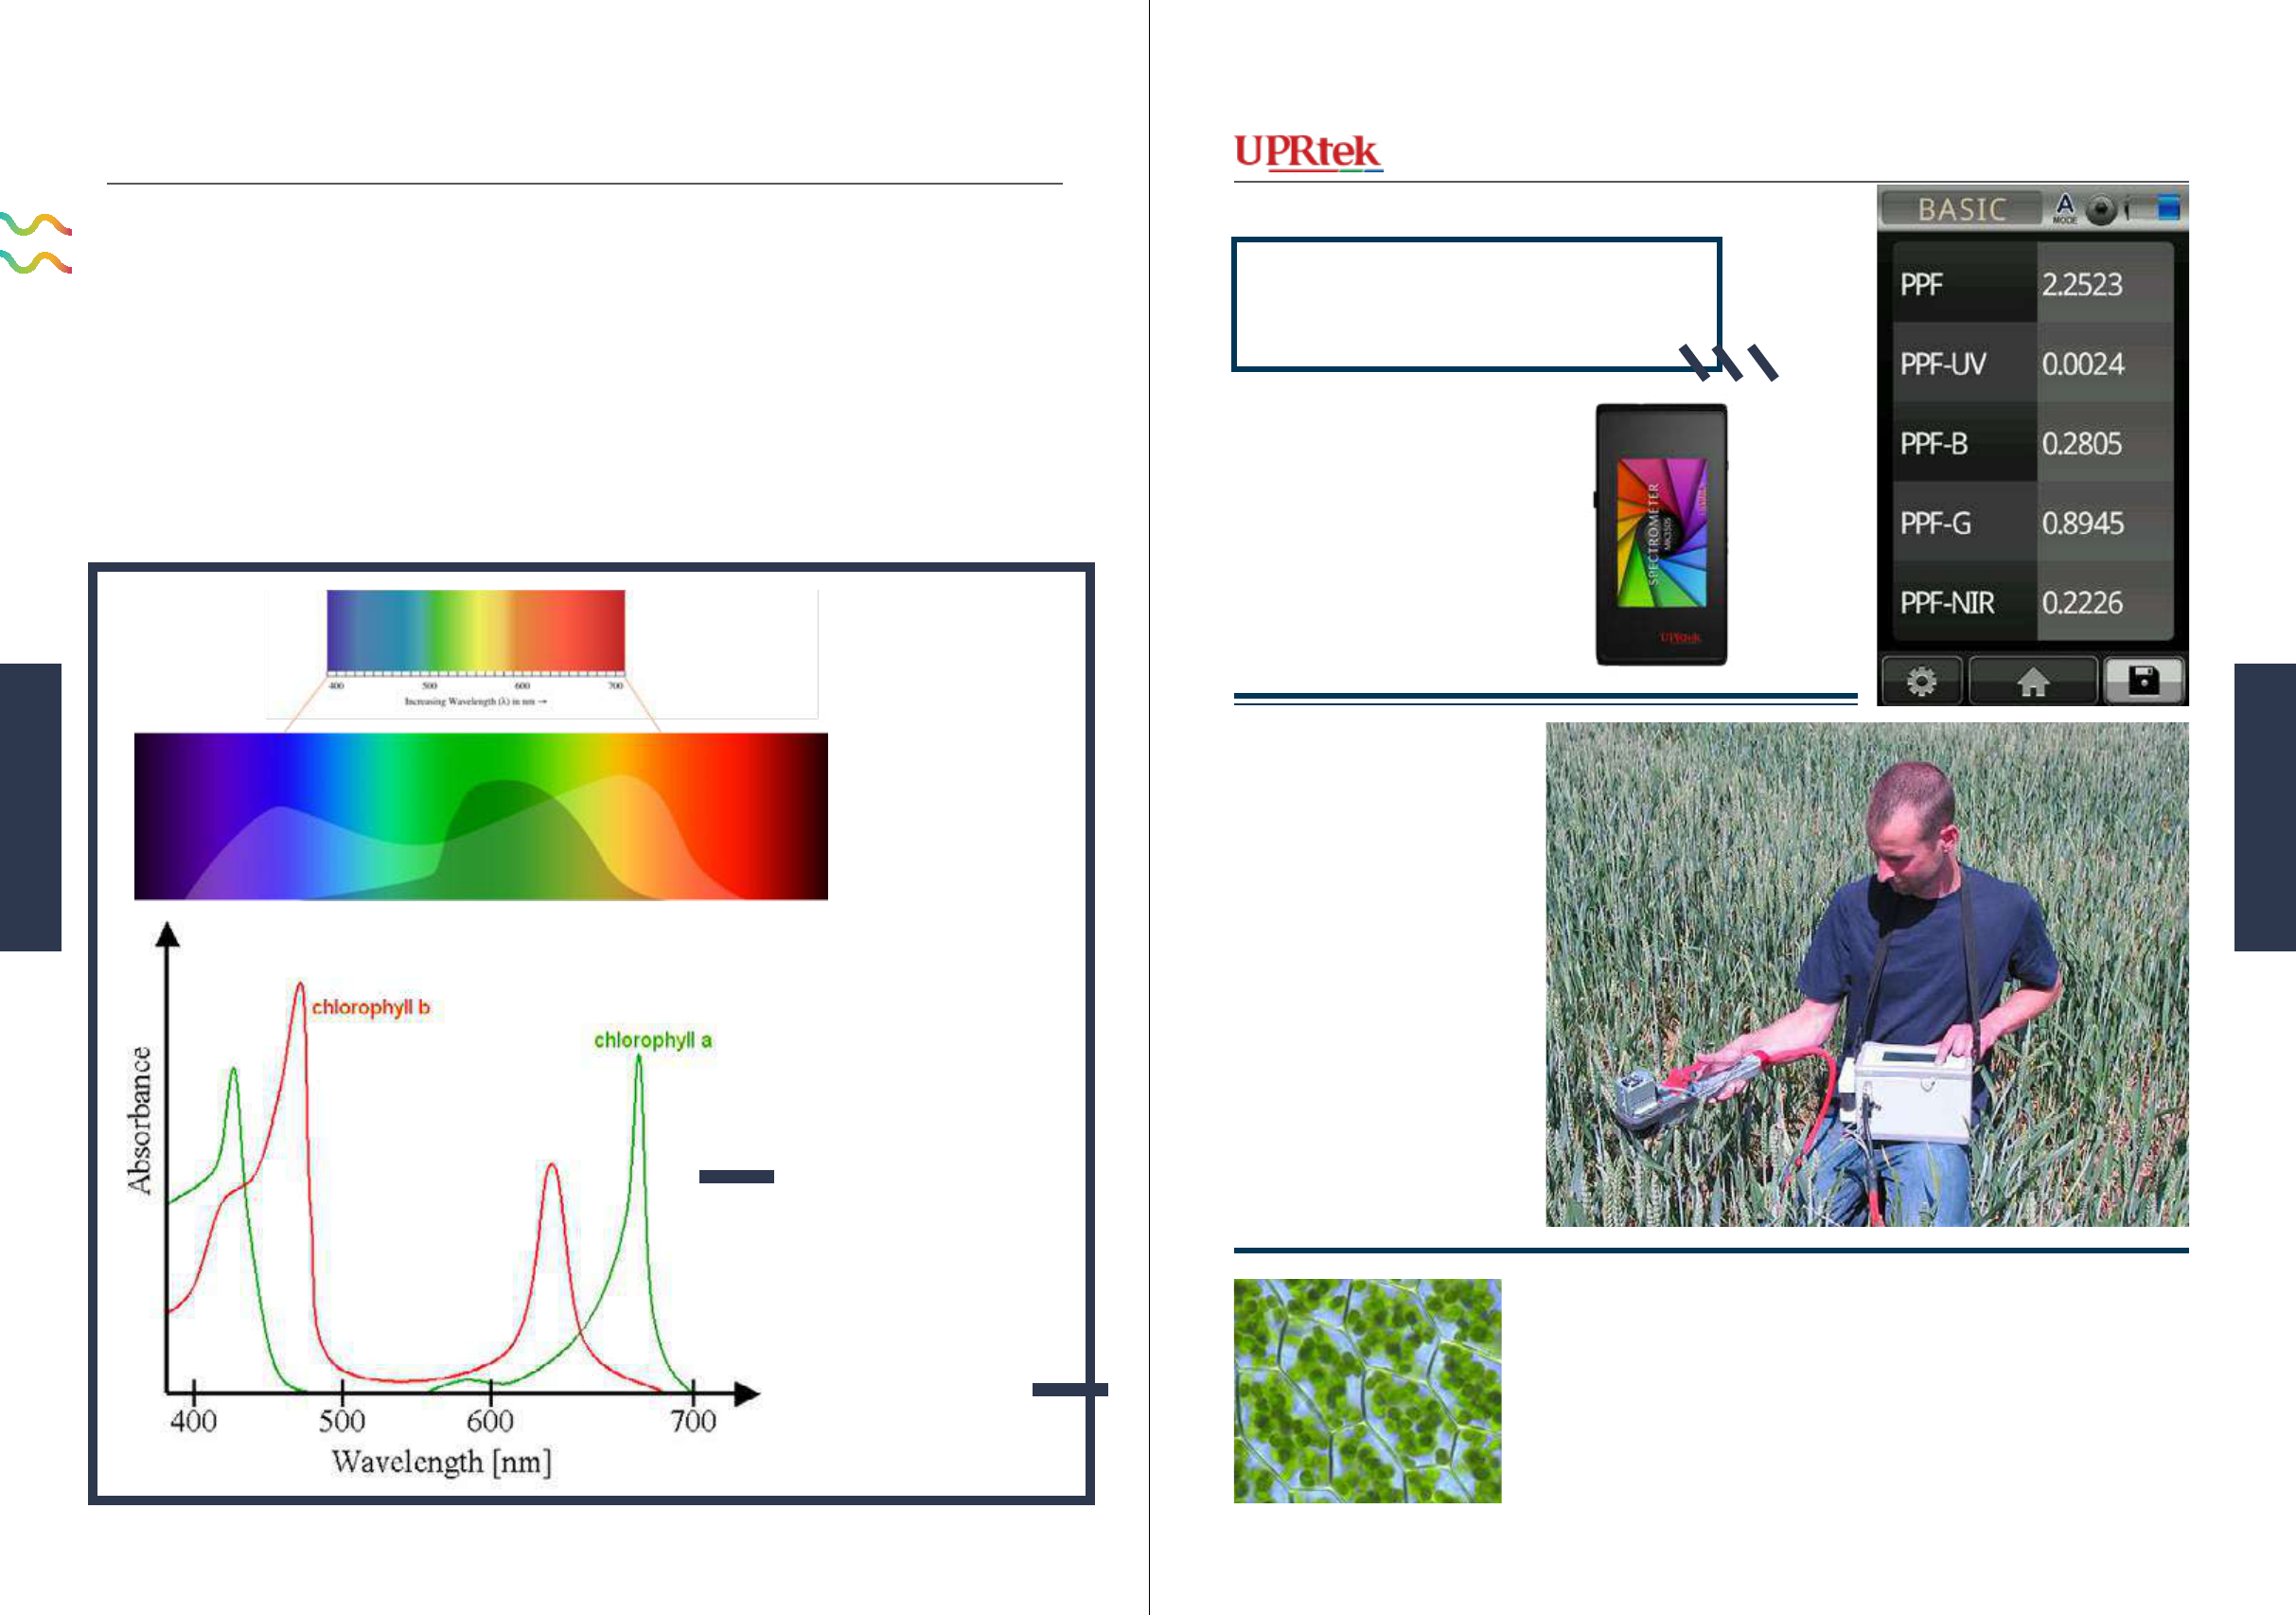
Version 20140410b - Not for distribution - © Copyright 2014 UPRtek All rights reserved
Versio 20140410b - Not for distribution - © Copyright 2014 UPRtek All rights reserved
Human VisionPAR PAR
Plants photosynthesize at wider
range of wavelengths than what
we can see, mostly at the red and
blue ends of the color spectrum
and less in the greens. However,
not all plants synthesize in the
same way - different plants need
Why are most
plants green?
PAR sensors are also used out-
doors for agriculture or foresta-
tion to measure the amount and
quality of sunlight reaching veg-
etation, which could be affected
by cloud cover, forest canopy
cover, building shade or pollu-
tion.
PPF (full spectrum 400~700 nm)
PPF-R (Red 600-699 nm)
PPF-G (Green 500~599)
PPF-B (Blue 400-499)
PPF-NIR (near infra red 700~780)
PPF-UV (ultraviolet 380~400)
Chlorophyll a -430 nm and 664 nm;
Chlorophyll b - 460 nm and 647 nm;
Chlorophyll c1 - 442 nm and 630 nm;
Chlorophyll c2 - 444 nm and 630 nm;
Chlorophyll d - 401 nm, 455 nm and 696 nm
different wavelengths of light and even the same plant will require
different wavelengths depending on its development phase.
Chloroplasts are a subunit within a plant cell and contain Chlorophyll
- different plants have different types of chlorophyll and thus respond
to different wavelengths of light. The MK350S can measure PPF at
different ranges of wavelengths to determine if certain plants are re-
ceiving the appropriate amounts of light at the right colors.
The Advanced MK350S can
measure PPF
(photosynthetic photo ux)
Chlorophyll Peak Sensitivities
Measuring PAR
Measuring PAR
PPF Values
By Kristian Peters -- Fabelfroh, GNU Free Documentation,
Creative Commons Attribution-Share Alike 3.0 Unported
Aushulz - GFDL - CC-BY-SA-3.0
Because the molecular structure is such that it reects green colors.
9998 MK350 Series Survival Handbook
Applicaons
Applicaons
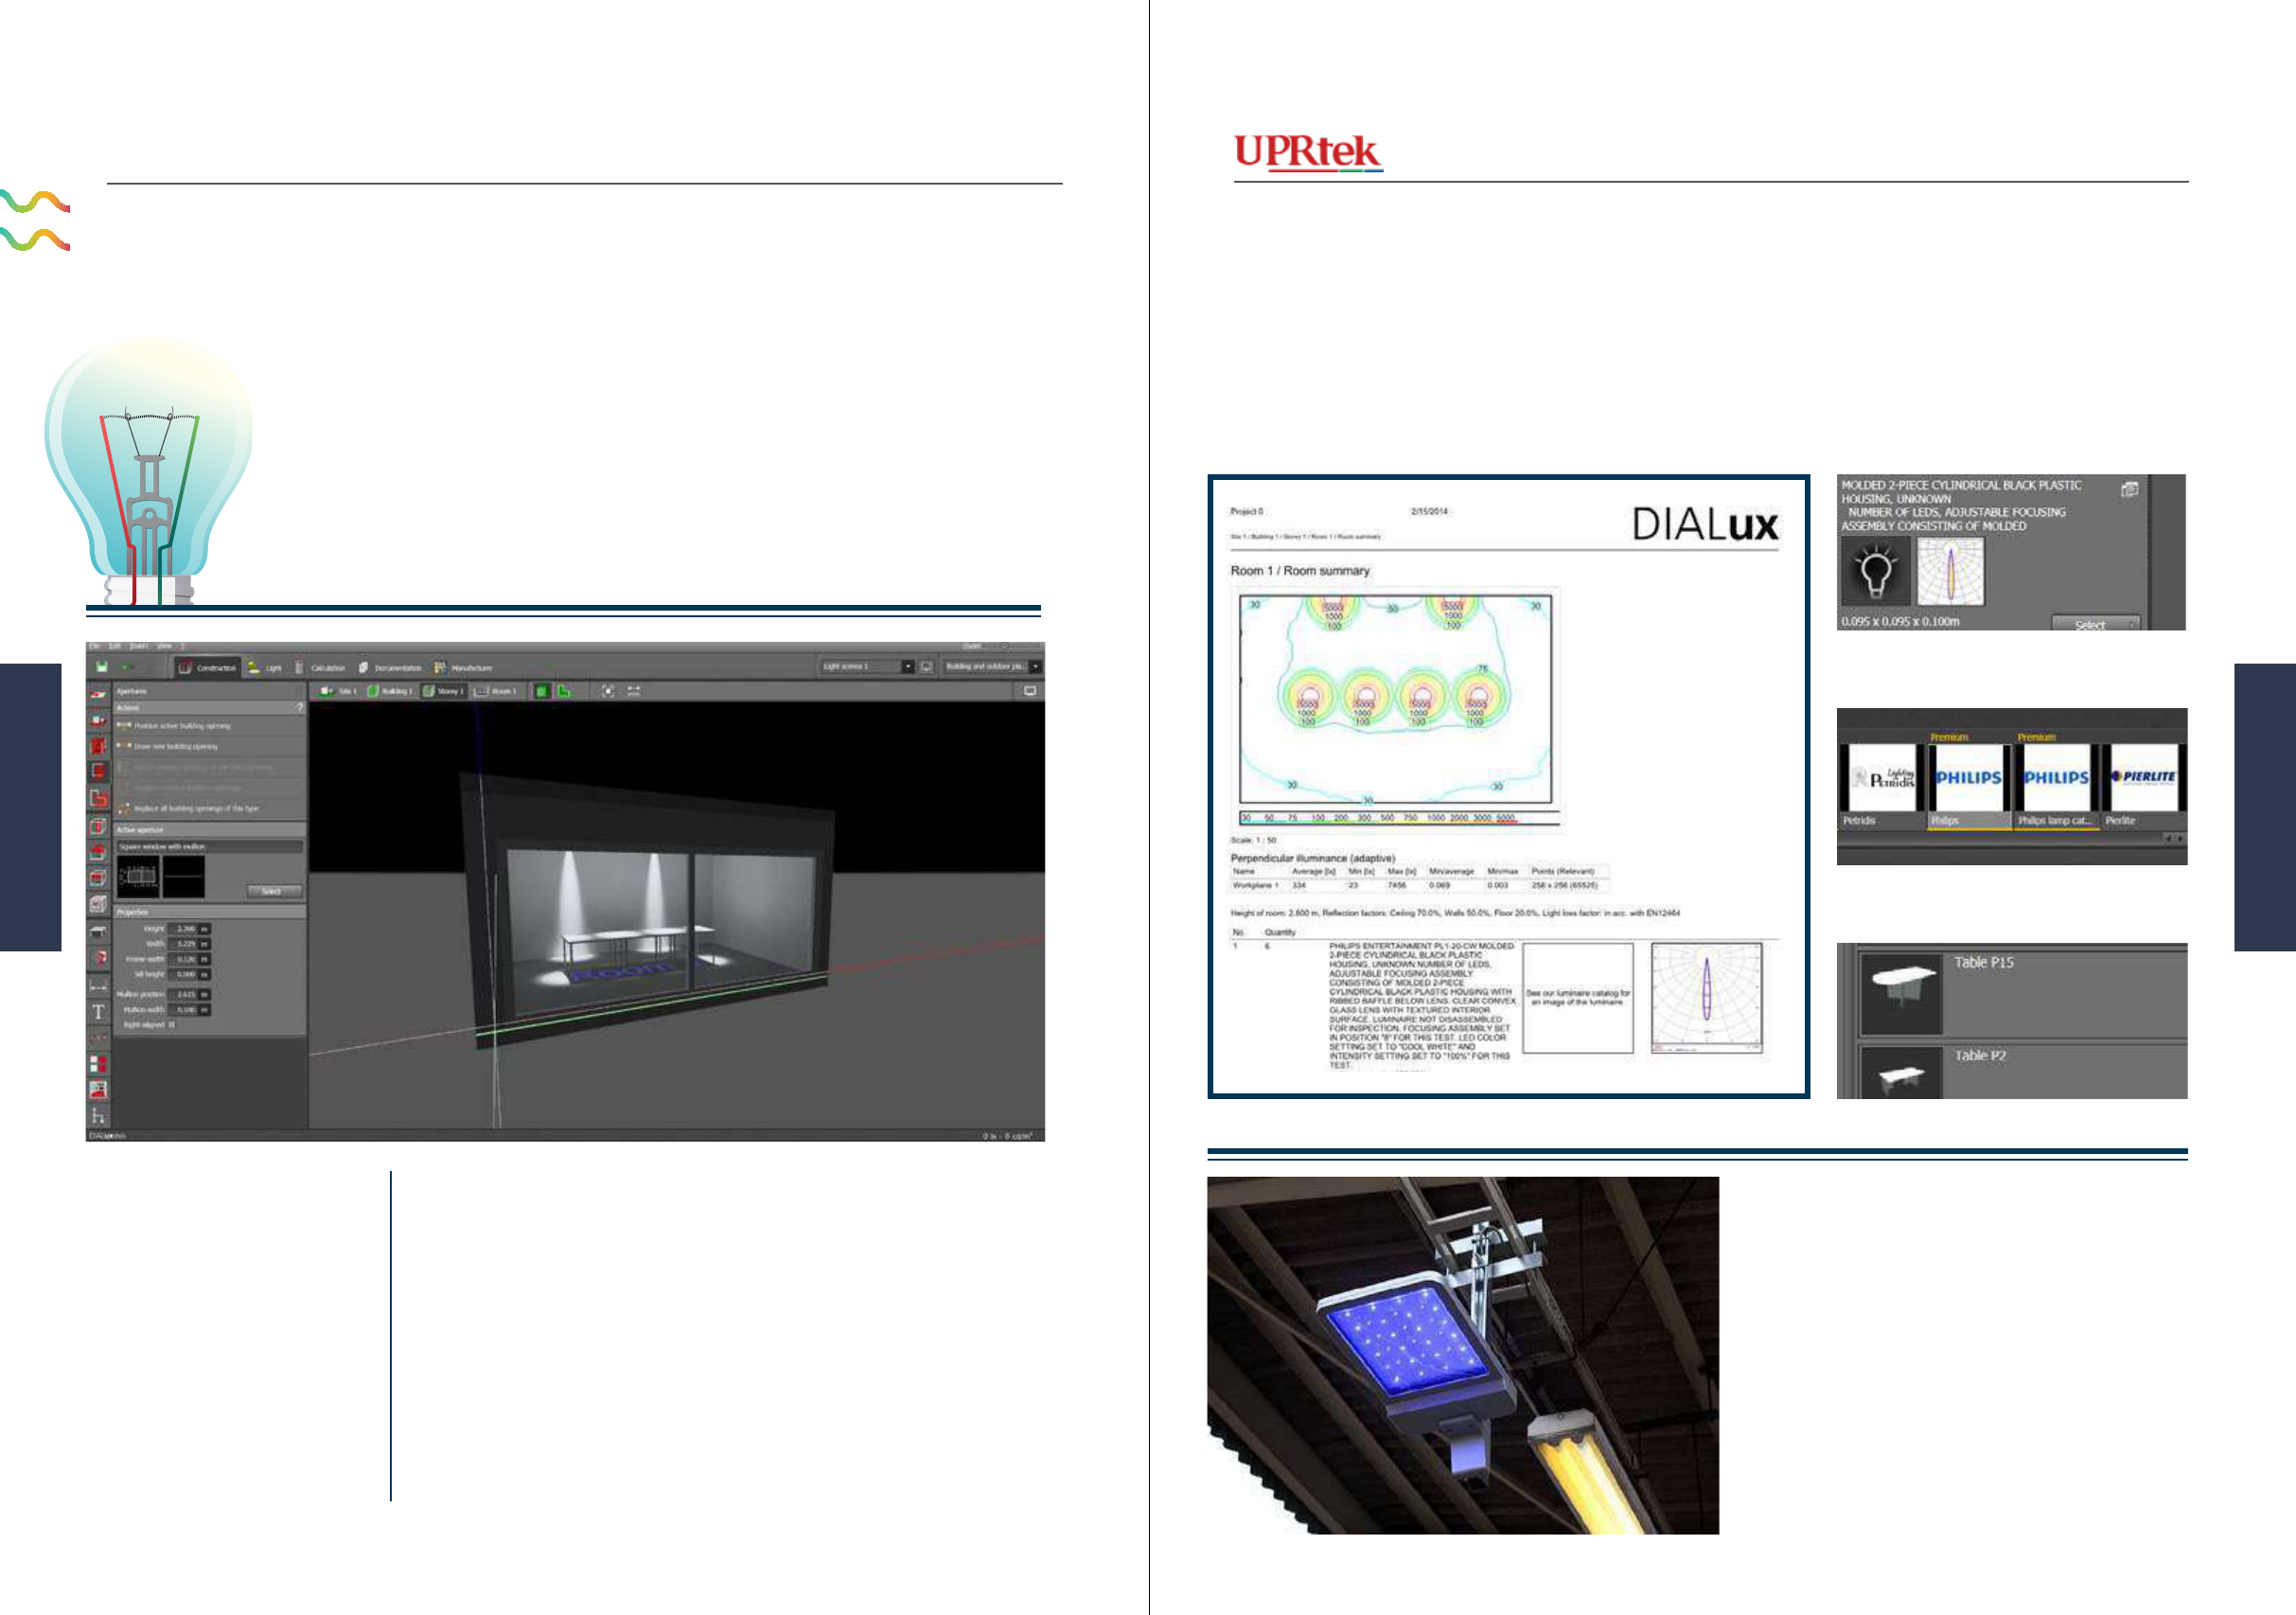
Version 20140410b - Not for distribution - © Copyright 2014 UPRtek All rights reserved
Versio 20140410b - Not for distribution - © Copyright 2014 UPRtek All rights reserved
Dialux is 3D software used
by Lighting Designers to help
plan luminaire lighting for
almost any situation includ-
ing building lighting, home
lighting, street lighting. The
designer receives an AutoCad
premises layout from a client,
which can be imported into
Dialux as a oor-plan - from
there, the designer can recon-
Luminaires
A Luminaire is sometimes called a Light
Fixture and is a complete lighting unit that
consists of one or more bulbs and every-
thing else needed for end-user installation
- encasement, sockets, connectors, reec-
tors, and power sources.
Lighting Designers
D
ialux
struct the entire client environment complete with colors, windows,
walls, ceilings, roof, doors and furniture. Finally, the designer is able
to select a set of simulation luminaires, which are ready to install
simulation light bulbs from vendors all around the world. In order
to do this, the vendor must have an IES le to download - these les
contain light specications about their lighting products. Finally, lu-
minaires are installed and light simulation can be evaluated. From
here designers check brightness or LUX, which is lumens per sq.
meter. A lumen is a unit of measure that represents an “amount” of
visible light. The Dialux software produces reports that show LUX
levels in every room, on oors, tables and walls.
Lighting Designers
Dialux
Bulb Selector
Lighting Vendor Selector
Furniture Selector
Tennen-Gas - CC-BY-SA-3.0
101100 MK350 Series Survival Handbook
Applicaons
Applicaons
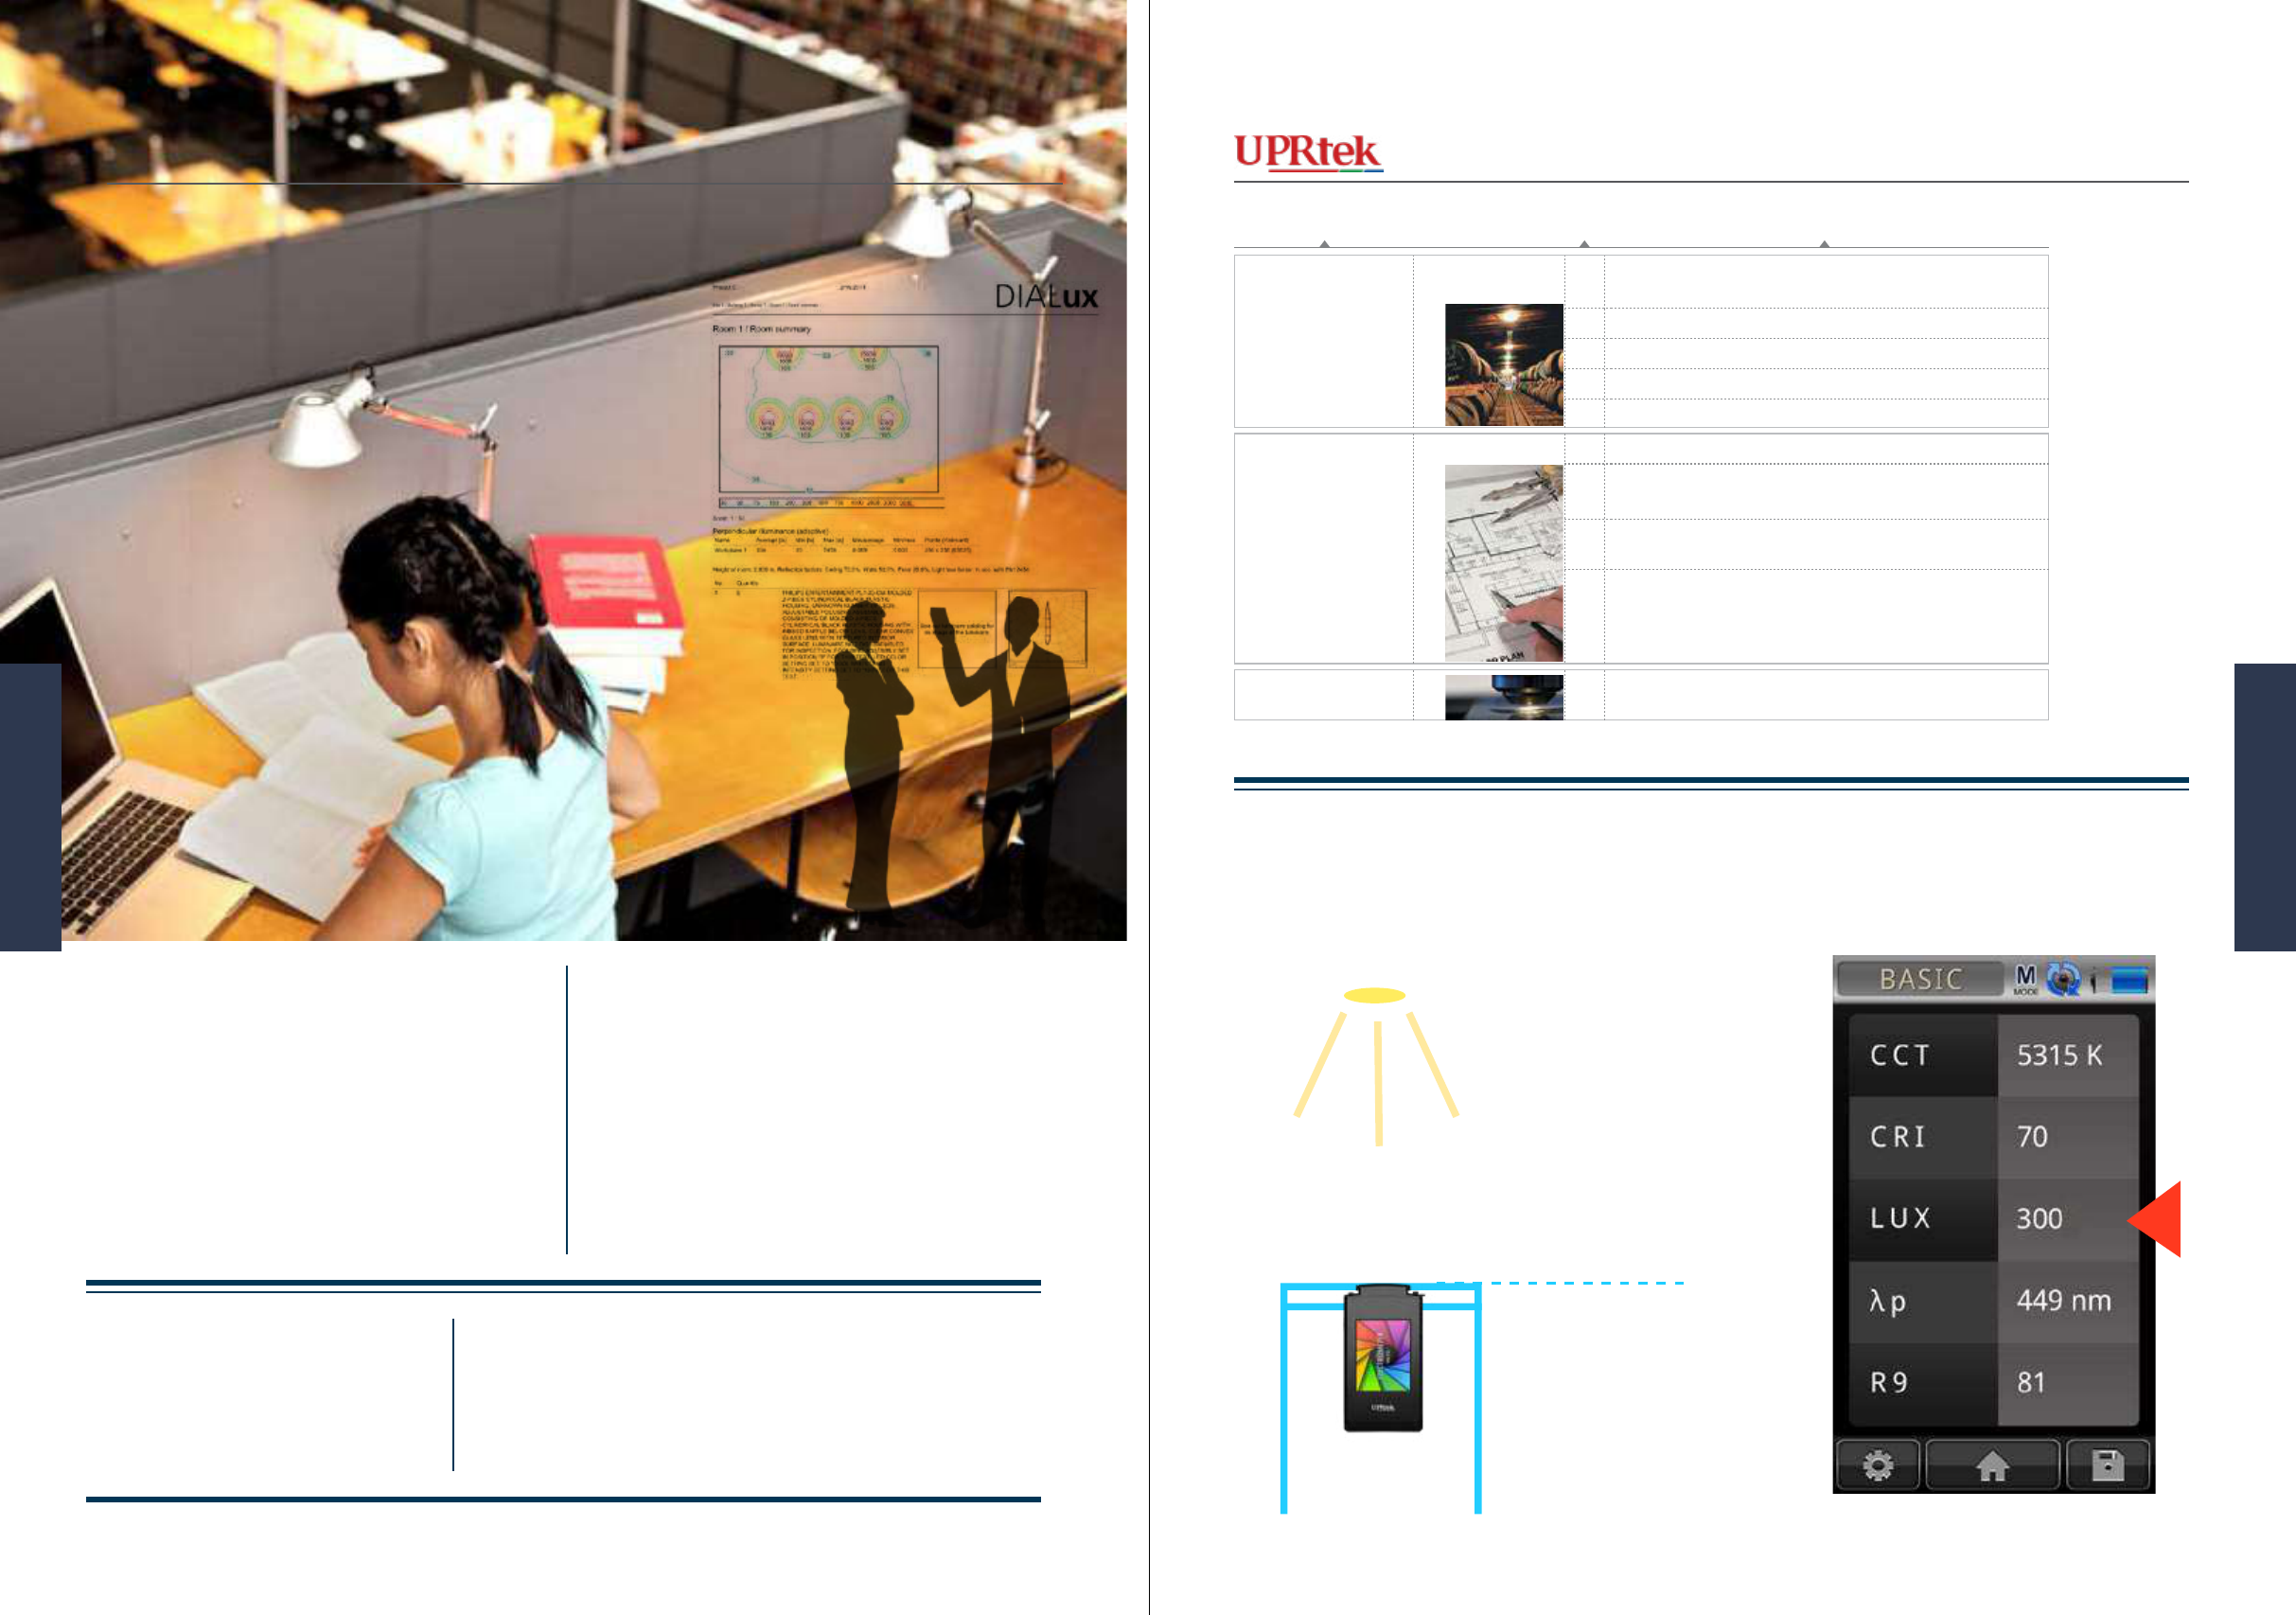
Version 20140410b - Not for distribution - © Copyright 2014 UPRtek All rights reserved
Versio 20140410b - Not for distribution - © Copyright 2014 UPRtek All rights reserved
102
Software simulations and reports are one thing,
but actual implementation and results are anoth-
er matter. Once all the real lighting has been in-
stalled, other than visual, there is no quantitative
way to show the client that your lighting instal-
lation meets original specications. This is im-
portant, because sometimes it’s necessary to meet
regulations for public spaces, such as libraries and
schools. The lighting designer uses the MK350 to
You can nd many guidelines on
the Internet from different organi-
zations, but the “word” is that most
of them are very similar. Some of
these organizations include:
show clients that, in fact, LUX levels on tables,
walls and workspaces do meet regulations.
Lighting regulations for public spaces is some-
times mandated and sometimes just guidelines,
but no matter, most developed countries are be-
ginning to pay attention to the importance of
proper, appropriate illumination and light color.
US - OSHA (Occupational Safety and Hazard Association)
UK - HSE (Health and Safety Executive)
EU - CEN (European Committee for Standardization)
When the Lighting Designer is using the MK350 to validate LUX for a library client, he/she positions the
device at just the height of the table, which is where you will normally be placing a book. The height is
important because even a short difference in distance of 33 cm can make a difference of 30-40 LUX.
Light Source
Table
Importance of mea-
suring LUX from the
right height.
Reading Level
typical areas of applicationIlluminance Level (lux)category
Minimum service illuminance in exterior circulation areas,
outdoor stores, stockyards
Exterior walkways and platforms
Boiler house
Transformer yards, furnace room etc.
Circulation areas in industry, stores and stock rooms.
Minmum service illuminance on the task
Medium bench & machine work, general process in chemical
and food industries, casual reading and filing activities.
Hangers, inspection, drawing offices, fine bench and machine
assembly, color work, critical drawing tasks.
Very fine bench and machine work, instrument & small
precision mechanism assembly; electronic components,
gauging & inspection o f small intricate p arts ( may be partly
provided by local task lighting)
Minutely detailed and precise work, e .g very small parts of
instruments, watch making, engraving.
General lighting for interiors
Additional localized lighting
for visually exacting tasks
General Lighting for rooms
and areas not frequently
used and /or used for
casual or simple v isual
tasks
3000
20
50
70
100
150
200
300
450
1500
103102 MK350 Series Survival Handbook
Applicaons
Applicaons
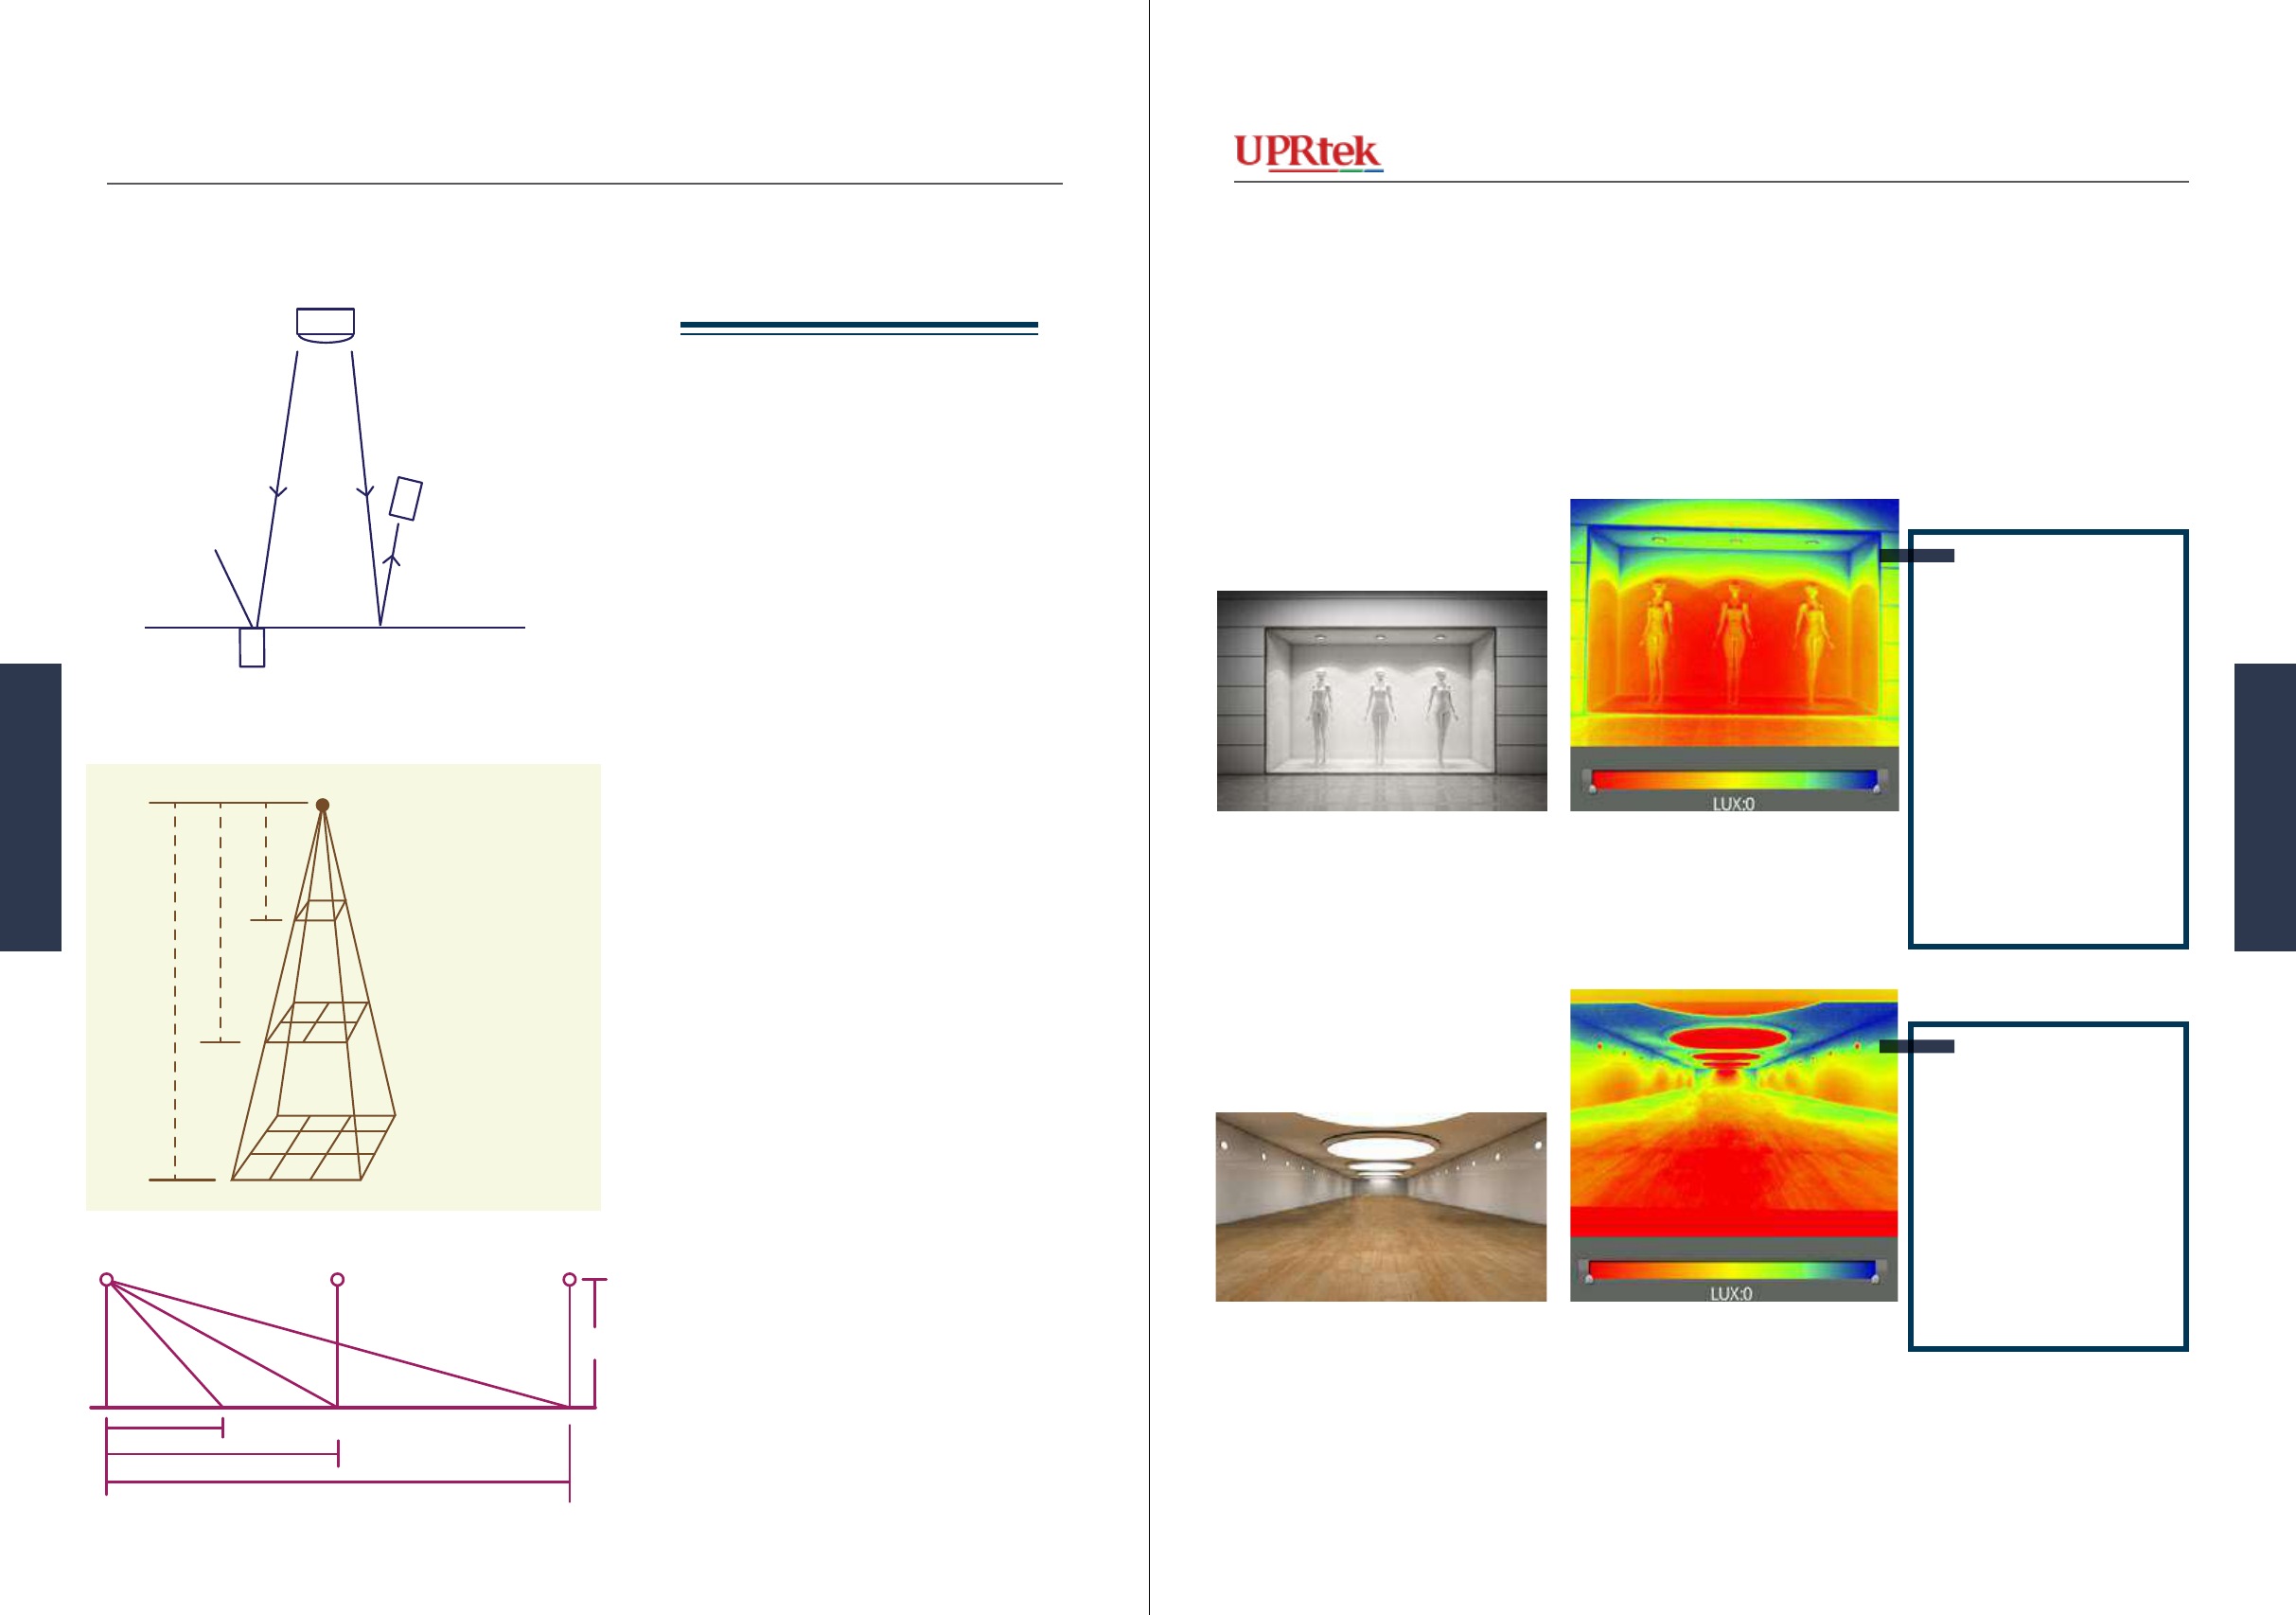
Version 20140410b - Not for distribution - © Copyright 2014 UPRtek All rights reserved
Versio 20140410b - Not for distribution - © Copyright 2014 UPRtek All rights reserved
Measuring LUX
Uniformity
LuxG view also allows a
lighting designer to gauge
the even-ness or uniformi-
ty of light, which is hard to
otherwise do with the dis-
traction of objects, colors
and textures.
Here are some other simple things
that you should know. There is “Illu-
minance” which was the light we just
measured with the library example -
it is measured in LUX. Then there is
“Luminance”, where you measure LUX
that is reected off the table surface.
Of course, Luminance also depends on
the surface material - a black table top
would show a lower LUX than a white
table top.
In measuring Illuminance, if you move
the light source farther from the table
top, the area of illumination naturally
increases - this increase is proportion-
al to the square of the distance. At the
same time the LUX also is reduced
proportionally (at “2d”, LUX is 1/4 of
what it is at “d”, at “3d” LUX is 1/9 of
what it is at “d”).
As you move farther away laterally
from the center of the light, the LUX
also diminishes in proportion to dis-
tance. These are some of the items to
consider in lighting design.
Objective Luminance
Lighting Designers use
the MK350 LuxG view
to get a more objective
view of where luminance
is and where adjustments
are necessary. The red
areas indicate intense
light which, in this LuxG
image, falls mostly on the
oor and background.
area
4 x area
9 x area
Distance
2 x Distance
3 x Distance
6m
8m
16m
32m
MK350 (500lux)
MK350 (250lux)
Working plane
Measuring the LUMINANCE
of the light reflected off of the
working plane
Measuring the
ILLUMINANCE directly
from the light at the level
of the working plane
105104 MK350 Series Survival Handbook
Applicaons
Applicaons
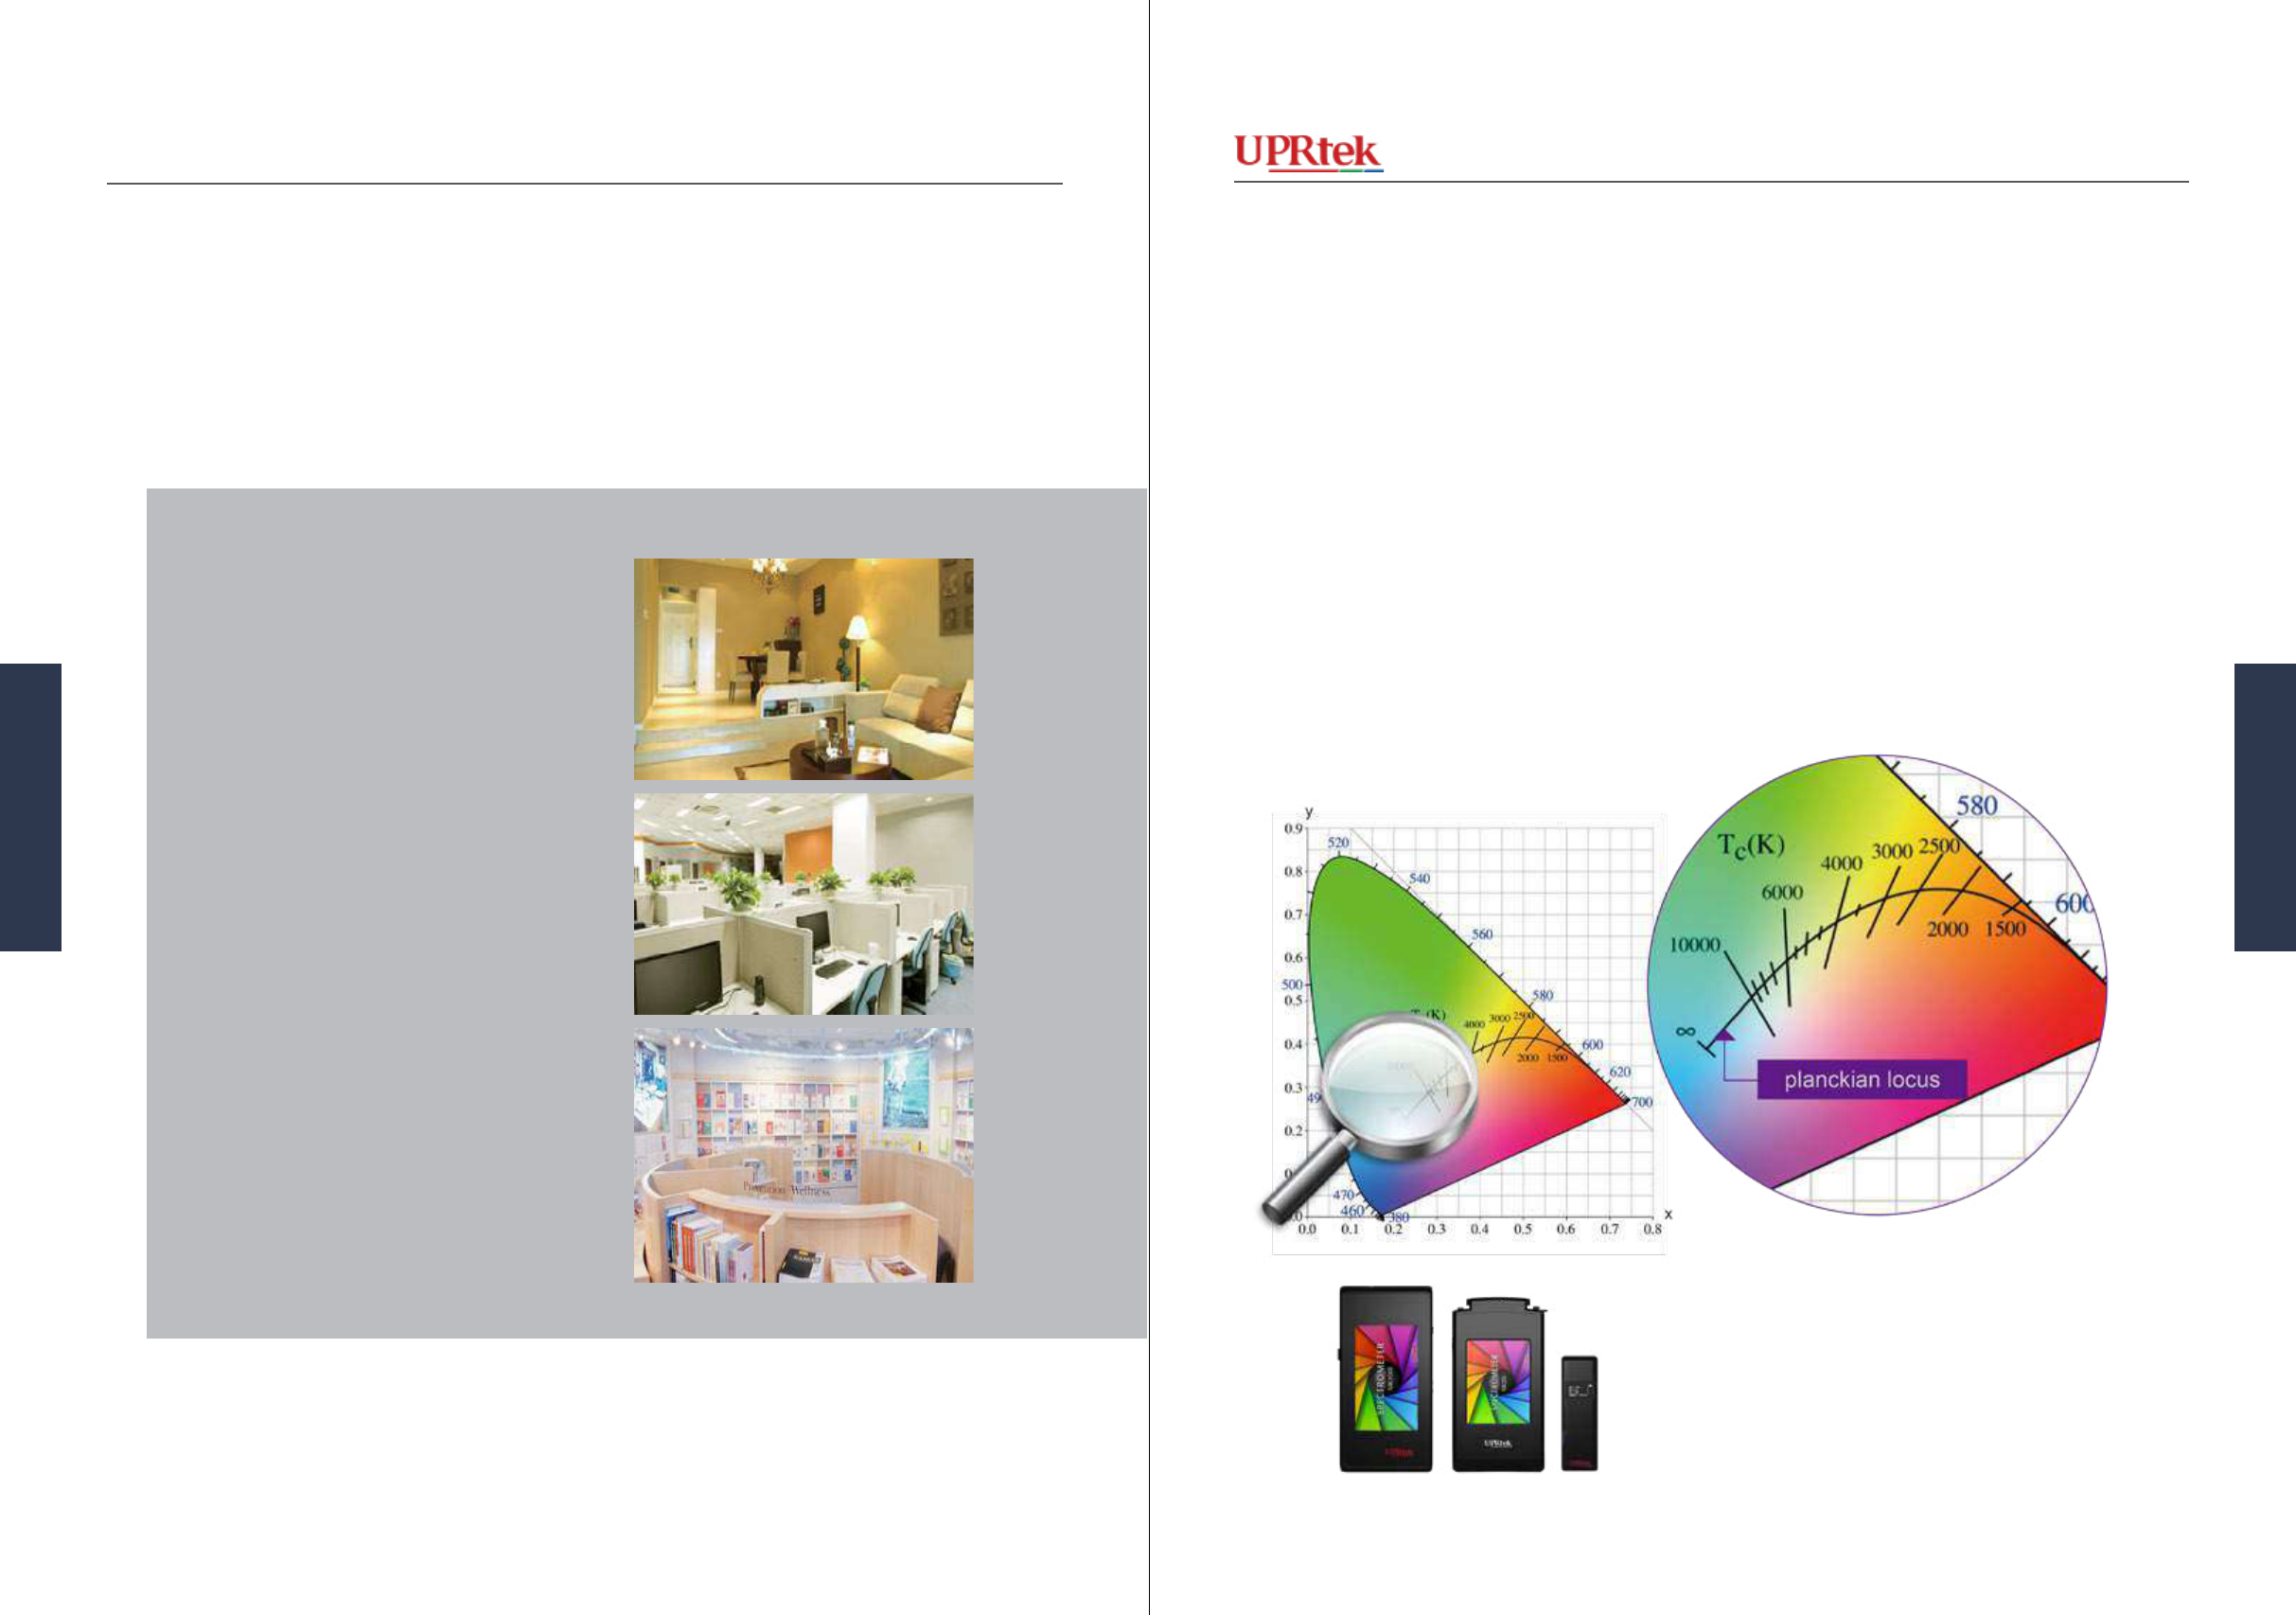
Version 20140410b - Not for distribution - © Copyright 2014 UPRtek All rights reserved
Versio 20140410b - Not for distribution - © Copyright 2014 UPRtek All rights reserved
Cool vs Warm - Color Temperature
Lighting designers are telling us that most of their clients are not familiar with the Color
Temperature. However, they do understand the concepts of warm and cool environments.
With Incandescent lights, the color temperature is used by designers to determine ranges
for Warm, Neutral and Cool as shown below.
Remember that color temperature is based on a theoretical model called a Black Body Radiator
(heat to make light) and the Sun and Incandescent Lights are fairly accurate representations of that
because they use heat to emit light. However, as we know, LED and Fluorescent lights are based
on semiconductors and mercury/phosphors respectively, so a Black Body Color Temperature real-
ly makes little sense.
However, a Correlated Color Temperature was devised to estimate a color temperature for LEDs
and Fluorescents. However, this correlation can only give a broad range estimate. Remember that
the Planckian locus is the theoretical Black Body Color Temperatures on our Chromaticity Dia-
gram. The slash marks acrros this locus (shown below) indicate the Correlated Color Temperature
ranges for Fluorescents and LEDs. In other words, an LED spec’ed for a CCT of 4000 could be
a yellow-green to yellow-blue-orange or anything in between. Therefore, the CCT can be ambigu-
ous for estimating the warmth or coolness of light for a designer.
x
x
Cool vs Warm - Color Temperature
Correlated Color Temperature
Correlated Color Temperature
Warm Light
3300K or below
Neutral Light
Around 3300K to 5300K
Cool Light
5300K or above
107106 MK350 Series Survival Handbook
Applicaons
Applicaons
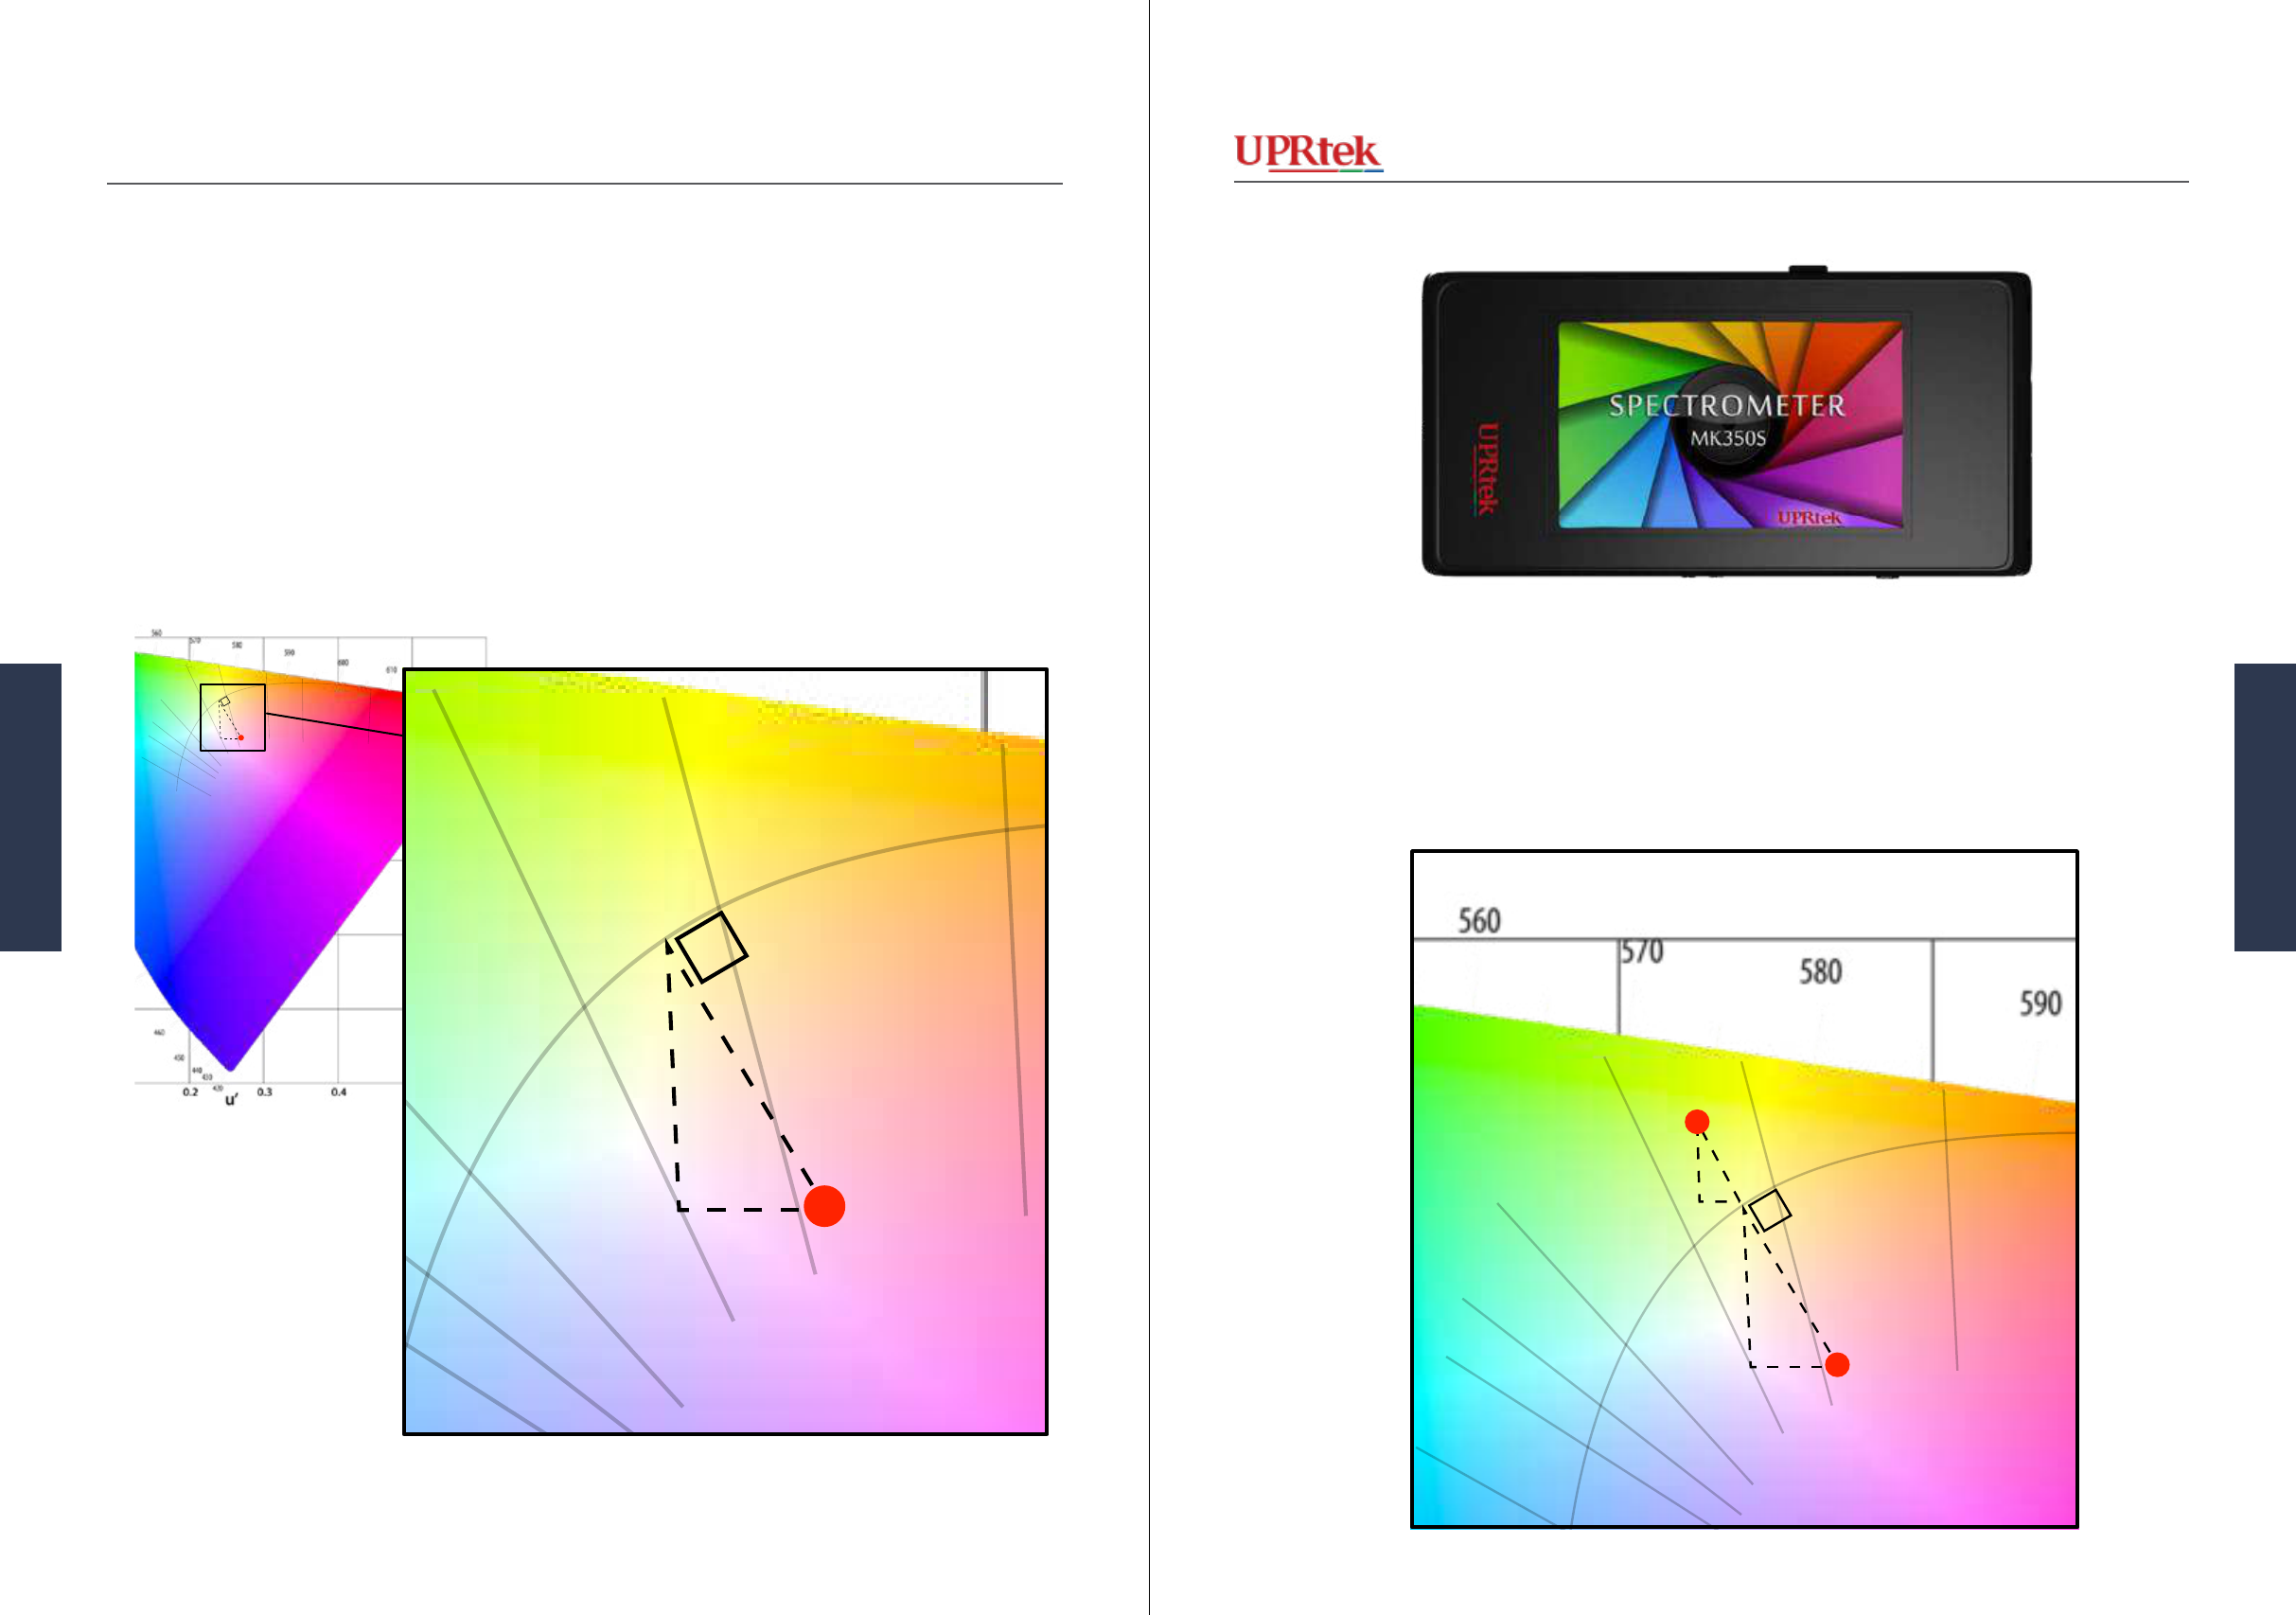
Version 20140410b - Not for distribution - © Copyright 2014 UPRtek All rights reserved
Versio 20140410b - Not for distribution - © Copyright 2014 UPRtek All rights reserved
∆v
∆u
Duv
For CFLs and LEDs, there are other unit measures that the MK350S provides to help the
designer estimate “warmth” or “coolness”. Let’s say your light falls on the point marked
with a red dot (below) - rst of all, the closer the red dot is to the Planck’s locus (blue dot),
the more true the CCT is for determining the “warmth/cooling” feel of the light. This dif-
ference is called the Duv (or Delta uv) for CIE 1976 diagram. More specically you can
get the Delta u (∆u) and Delta v (∆v).
That’s why we have Duv ∆u ∆v ∆y ∆x
Duv ∆u ∆v ∆y ∆x
∆v
∆u
Duv
So how does this help you determine real “coolness (blue)” or “warmth” (red)? It depends
on which side of the Planckian locus you are on, and the positive and negative values of
∆u and ∆v give you this indication. In general, a positive ∆u and negative ∆v leans more
towards the warm colors, and a negative ∆u and positive ∆v pushes the color towards the
cooler colors.
∆v
∆u
Duv
∆u+
∆v-
∆u-
∆v+
warmer
cooler
109108 MK350 Series Survival Handbook
Applicaons
Applicaons
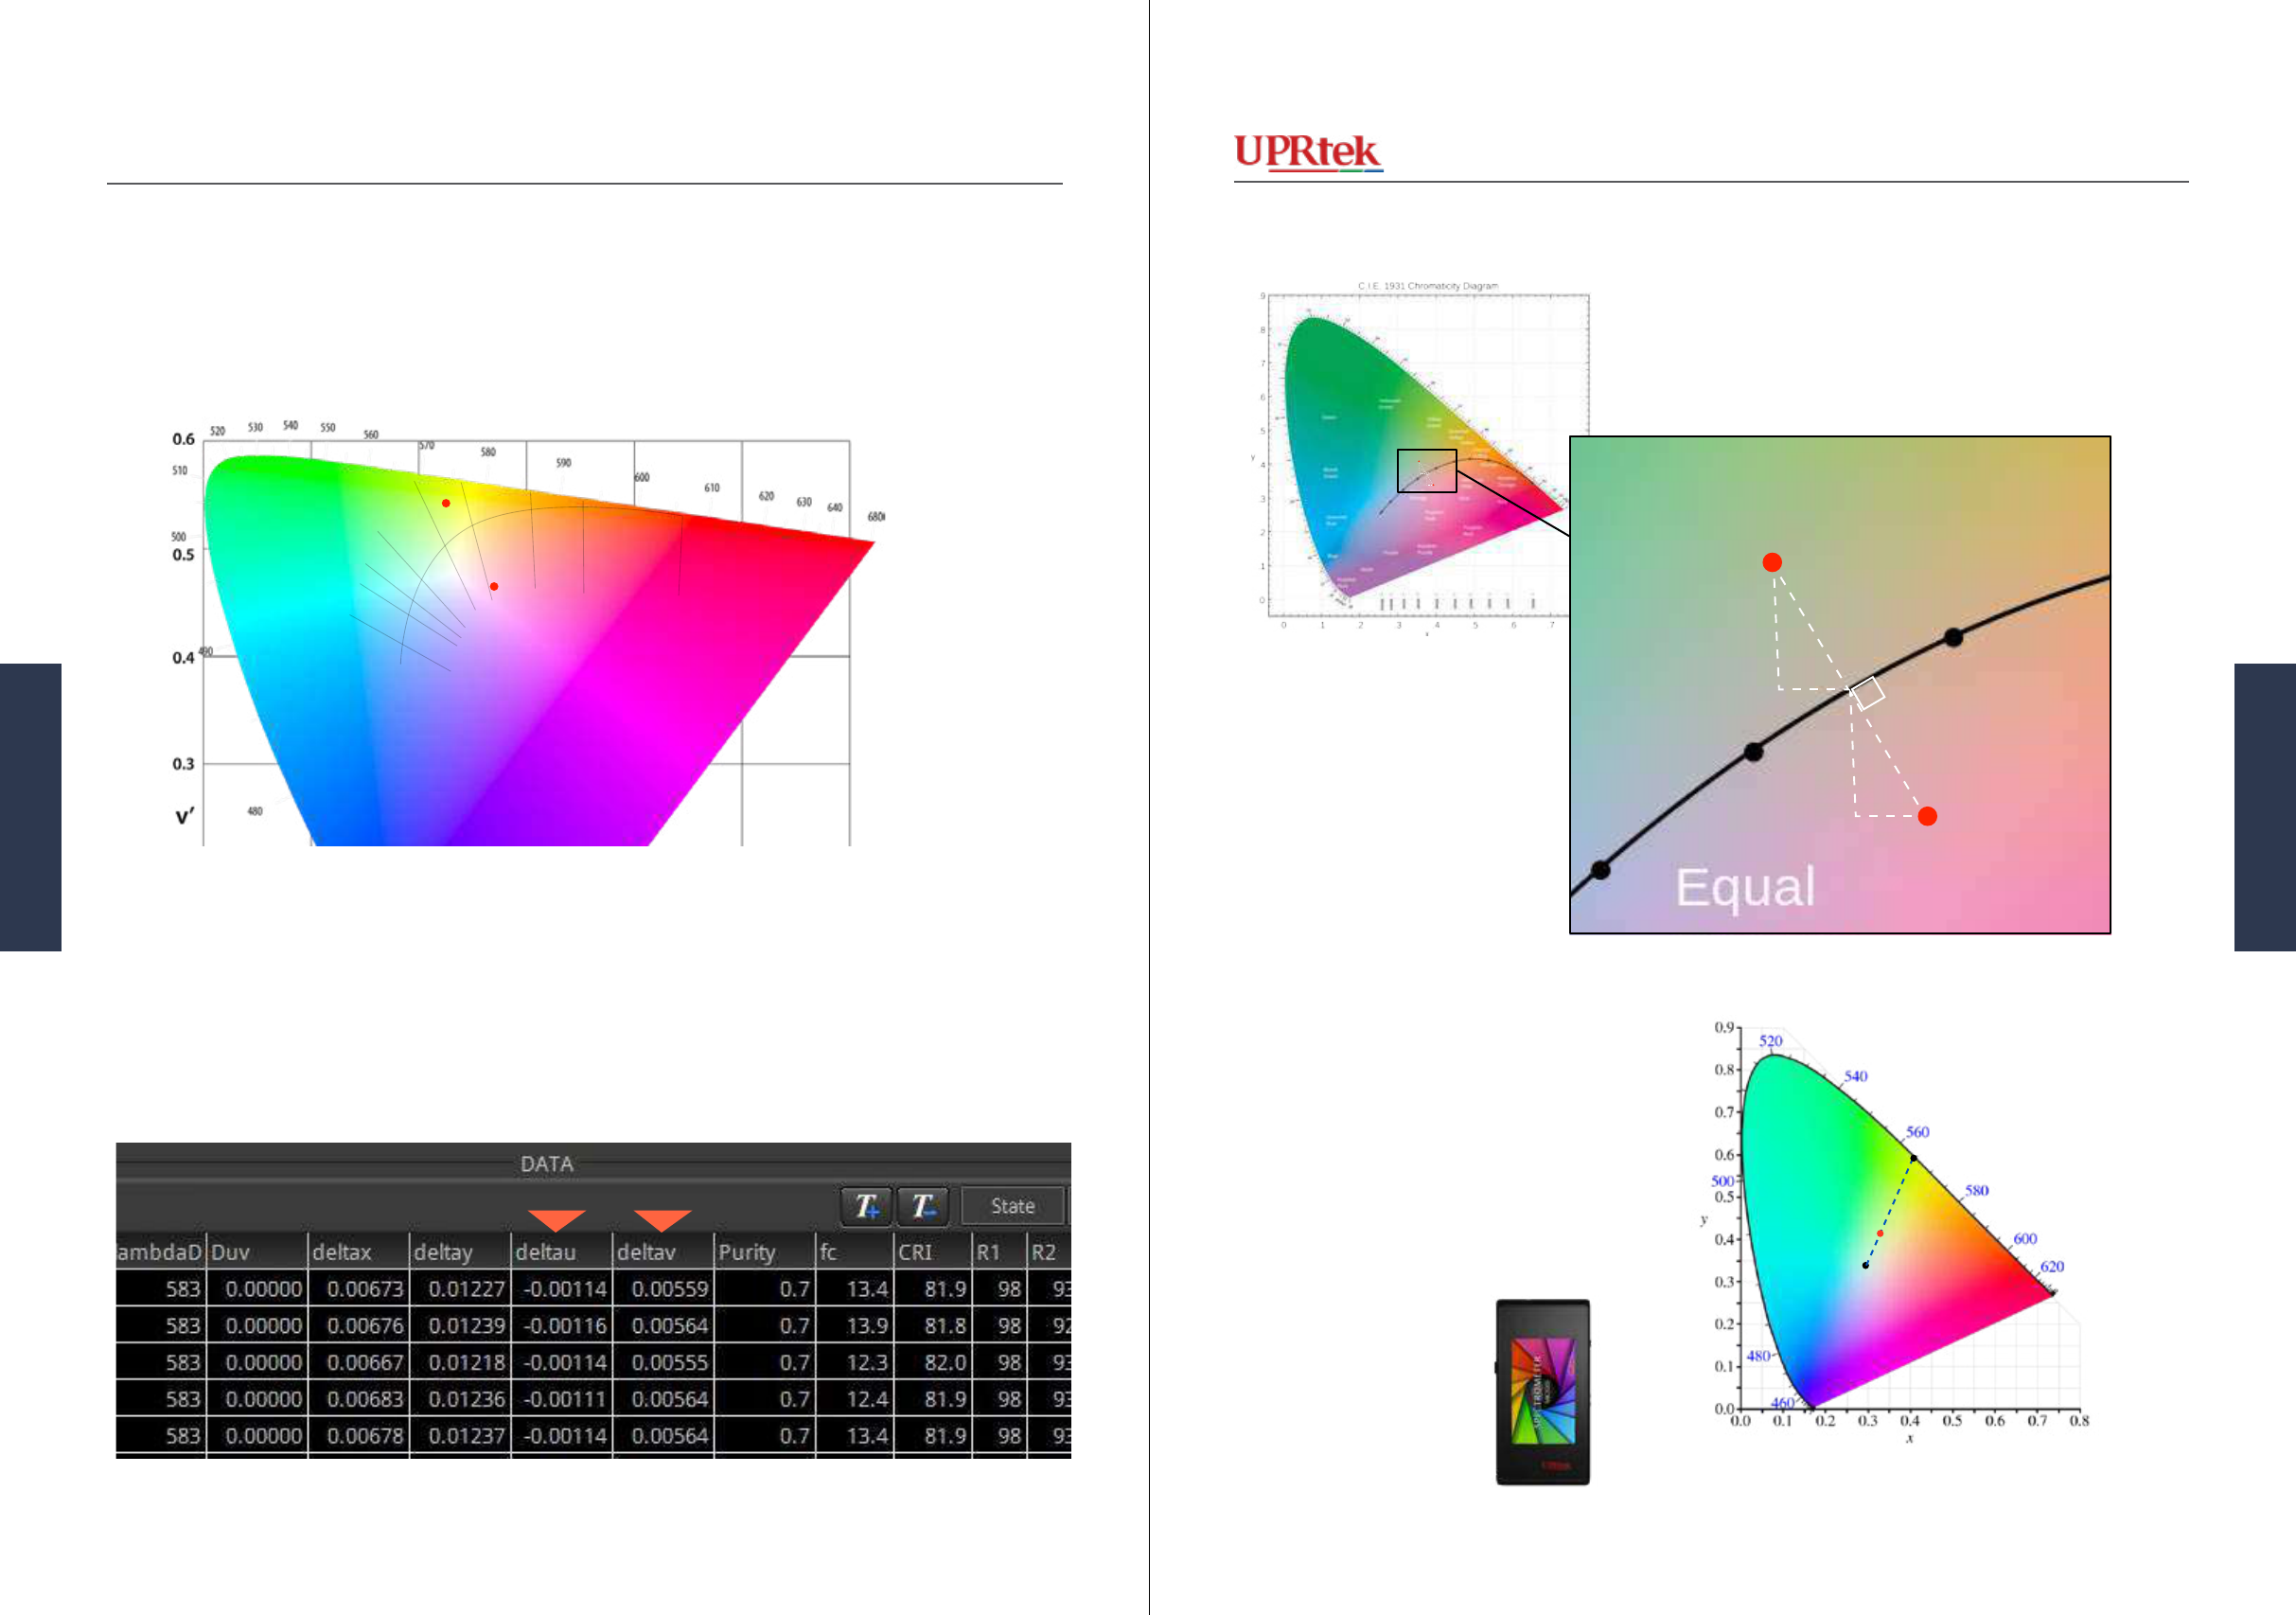
Paulschou at en.wikipedia- CC-BY-SA-3.0
Version 20140410b - Not for distribution - © Copyright 2014 UPRtek All rights reserved
Versio 20140410b - Not for distribution - © Copyright 2014 UPRtek All rights reserved
Why not just look at the coordinates on the Chromaticity Diagram? - you can quickly see
where the colors are inclined to (warm or cool) - so you don’t really need ∆u and ∆v right?
Why not just look at the Chroma Diagram?
For a lighting designer, it may be enough to look at the Chromaticity Diagram. However, there are
advantages to working with numbers like ∆u and ∆v, particularly when you are working with lots
of data. With a list of ∆u and ∆v values, you can observe trends and deviations much more clearly
than you can by looking at a diagram. Furthermore you can take these numbers and calculate useful
statistical data, such as averages, means, and standard deviations.
Strength in Numbers
From data window of MK350 uSpectrum PC Software
∆y
∆x
∆y
∆x
∆x+
∆y-
∆x-
∆y+
warmer
cooler
∆y
∆x
∆y
∆x
∆x+
∆y-
∆x-
∆y+
warmer
cooler
The CIE 1931 also has delta values but they are in terms of delta x and y (∆x and ∆y)
λd
x,y
Still another way of determining “Cool”
or “Warm” is by running a line from the
white point (.33, .33) through your x,y
coordinate - where it hits the outer contour
is where the dominant wavelength (λd)
is and from that wavelength you can get
a sense of “cool or warm”. The MK350S
can display λd, without all of the fuss of
guring it out yourself.
111110 MK350 Series Survival Handbook
Applicaons
Applicaons
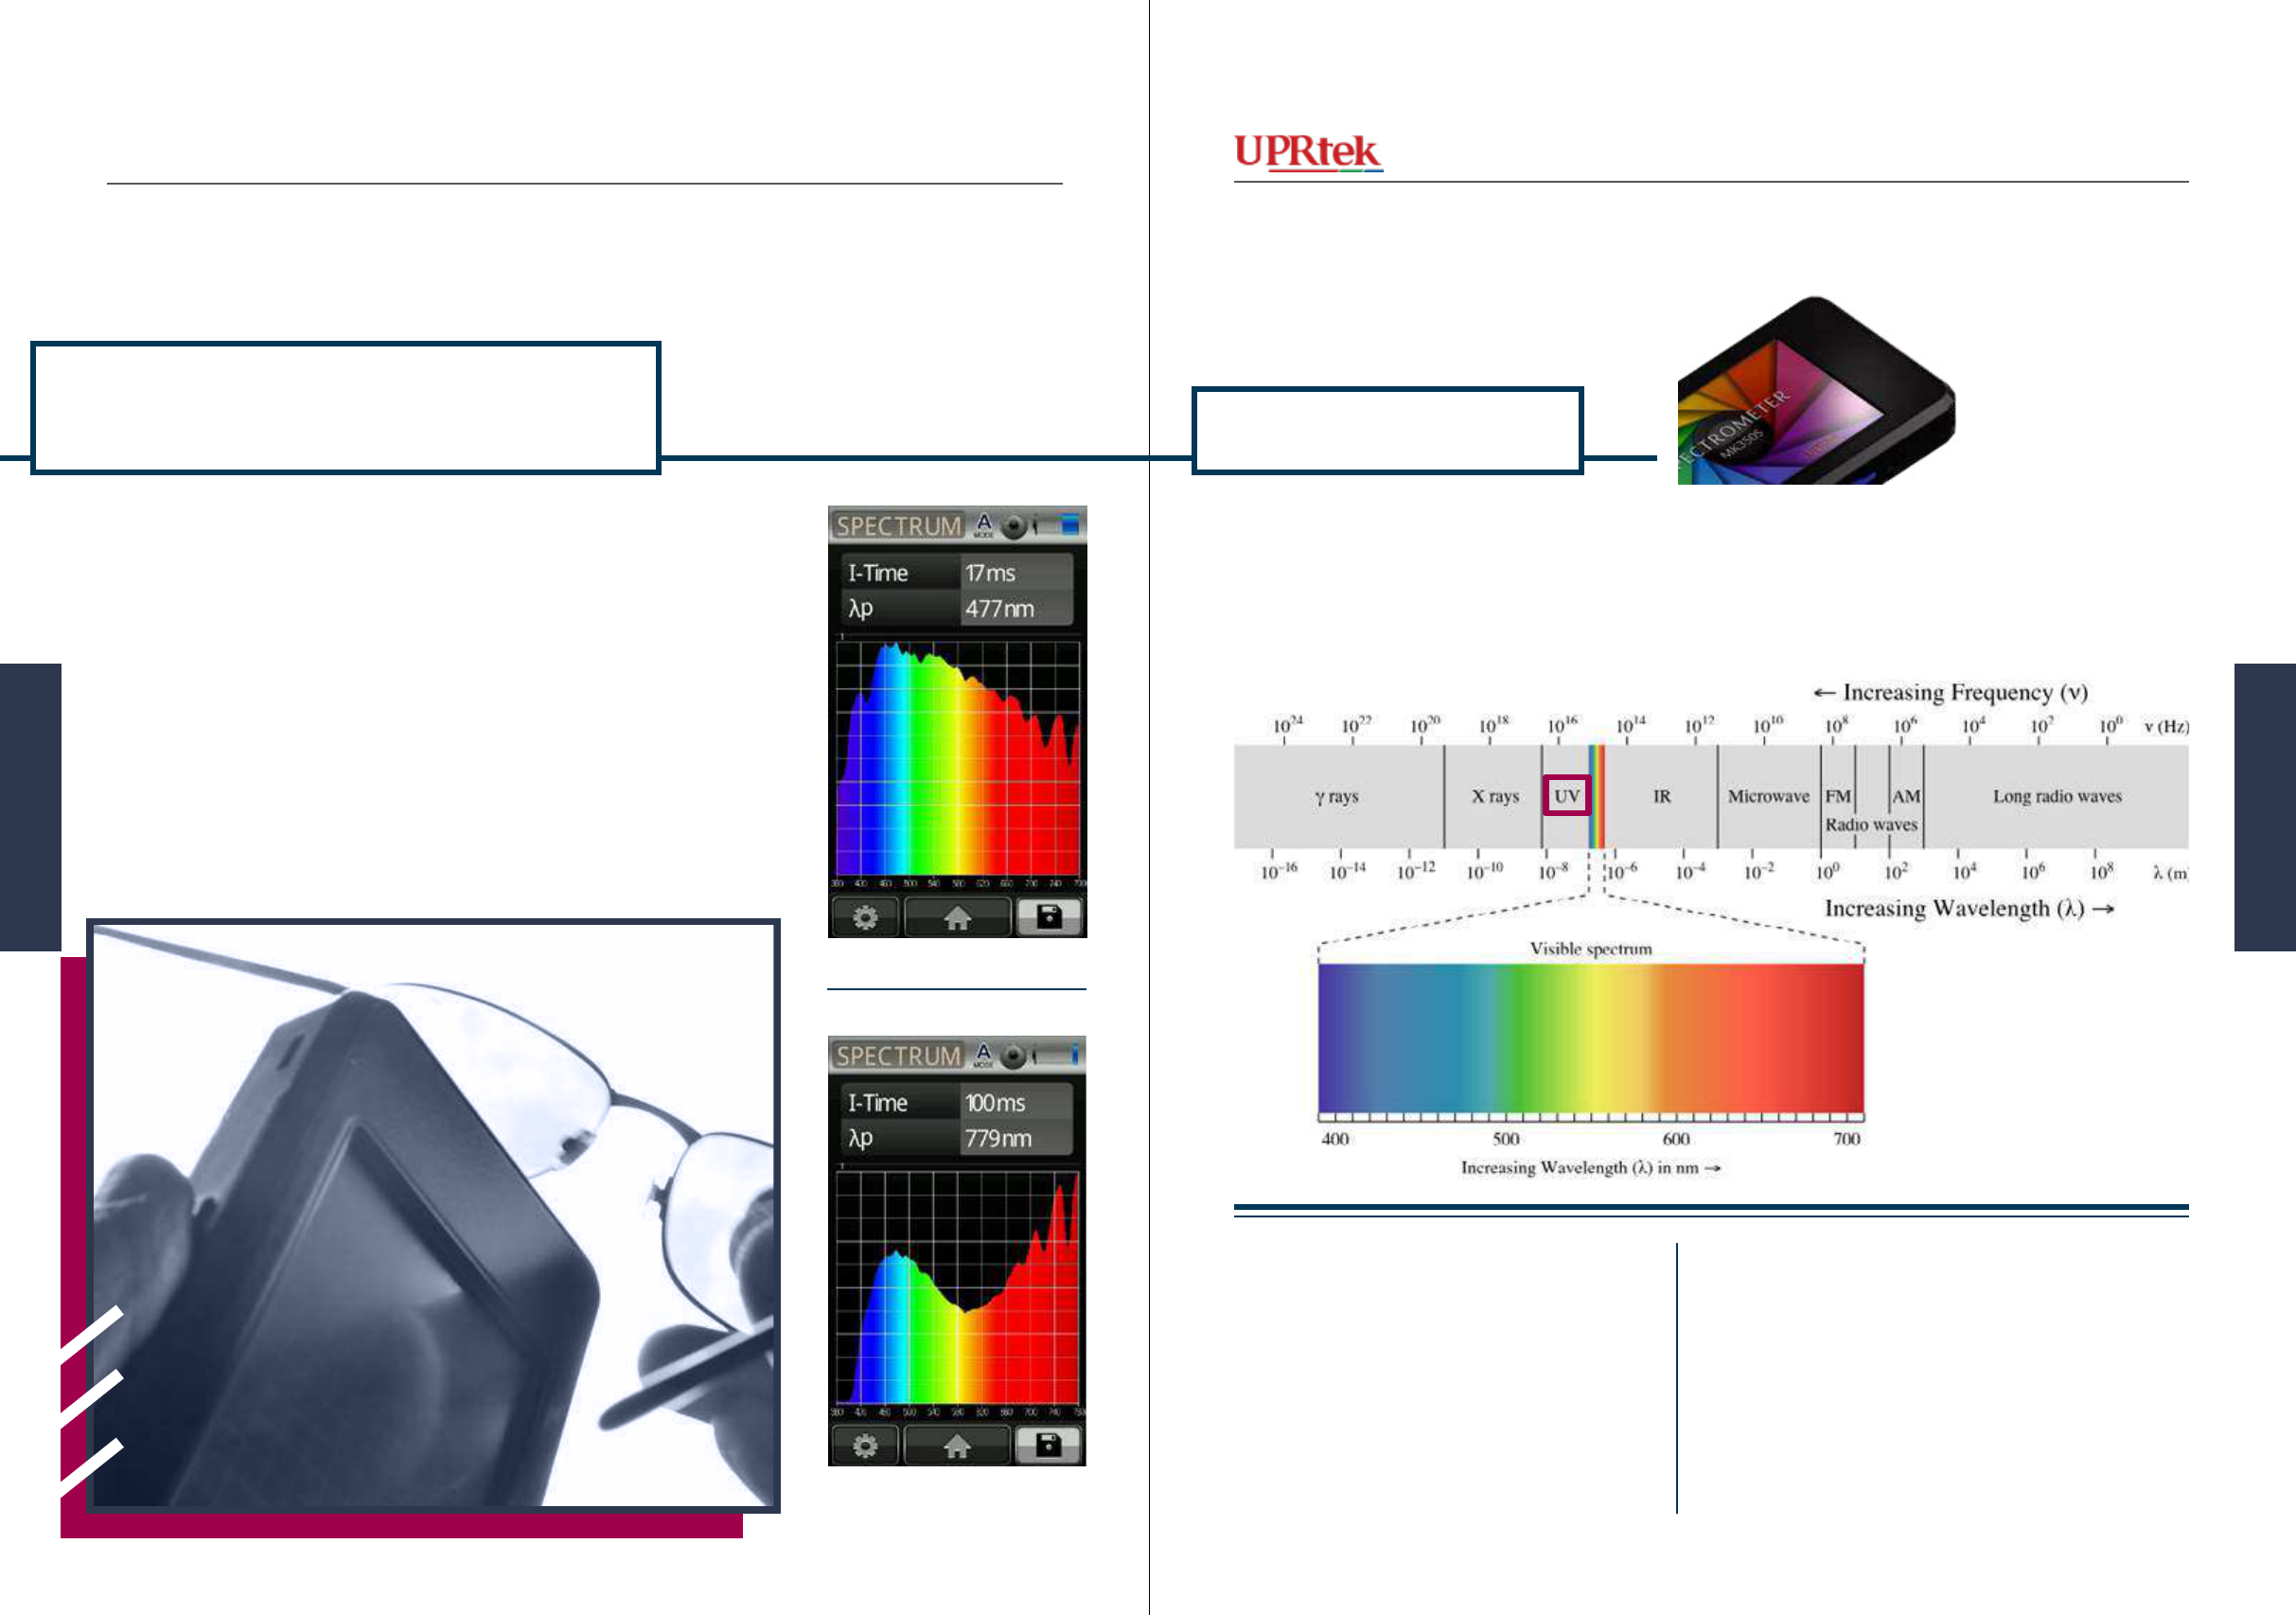
Version 20140410b - Not for distribution - © Copyright 2014 UPRtek All rights reserved
Versio 20140410b - Not for distribution - © Copyright 2014 UPRtek All rights reserved
UV light or more accurately UV
radiation is harmful to the eyes
and skin. There many products
that offer UV Protection includ-
ing sunglasses, windows, and
sunscreen. The danger in sun
glasses is that if they are not
properly UV protected, your
eyes will open wider because the
intensity of the sun is mitigated
by the colored glass - however,
MK350 pointed at Sun
MK350 pointed at Sun
through Sunglasses
Note:
The range of UV Light is actually 10 nm to 400 nm,
but the MK350 only can measure down to 380 nm
- and so it only measures only the very top end of
UV radiation. Suntan lotion protects against harmful
UVB radiation whose wavelengths are 280 to 315,
which are too low for the MK350 to detect. All this
is to say MK350 cannot speak to UV protection de-
vices under 380 nm.
This image comes from the English Wikipedia
(Original author : Philip Ronan) -
GNu Free Documentation license Creative
Commons Attribution-Share Alike 3.0 Unported
at the same time, it will allow more UV
light to enter your eyes, without protect-
ing your eyes.
You can use the MK350 devices to
test sunglasses. From the two MK350
captures on the right, you can see the
dramatic reduction of UV region (380-
400) when using properly coated UV
protected Sunglasses. We should note
that UV protection is not only offered in
sun glasses but can be coated onto clear
glasses as well.
CFL UV light
See article below
http://ee.ret.gov.au/energy-efciency/lighting/incan-
descent-light-bulbs-phase-out/health-questions/mini-
mising-uv-light-exposure-articial-lighting
If you remember, Fluorescent Lights use UV radiation
to excite the phosphor coating inside the tube. Most
of the harmful UV light is absorbed by the phosphor
(UVC), but a small amount of UV light in the higher
UV region can be seen (UVA 380-400) by the MK350.
Measuring UV
light (radiation)
Light Health and
Safety
Light Health and Safety
Measuring UV Light
113112 MK350 Series Survival Handbook
Applicaons
Applicaons
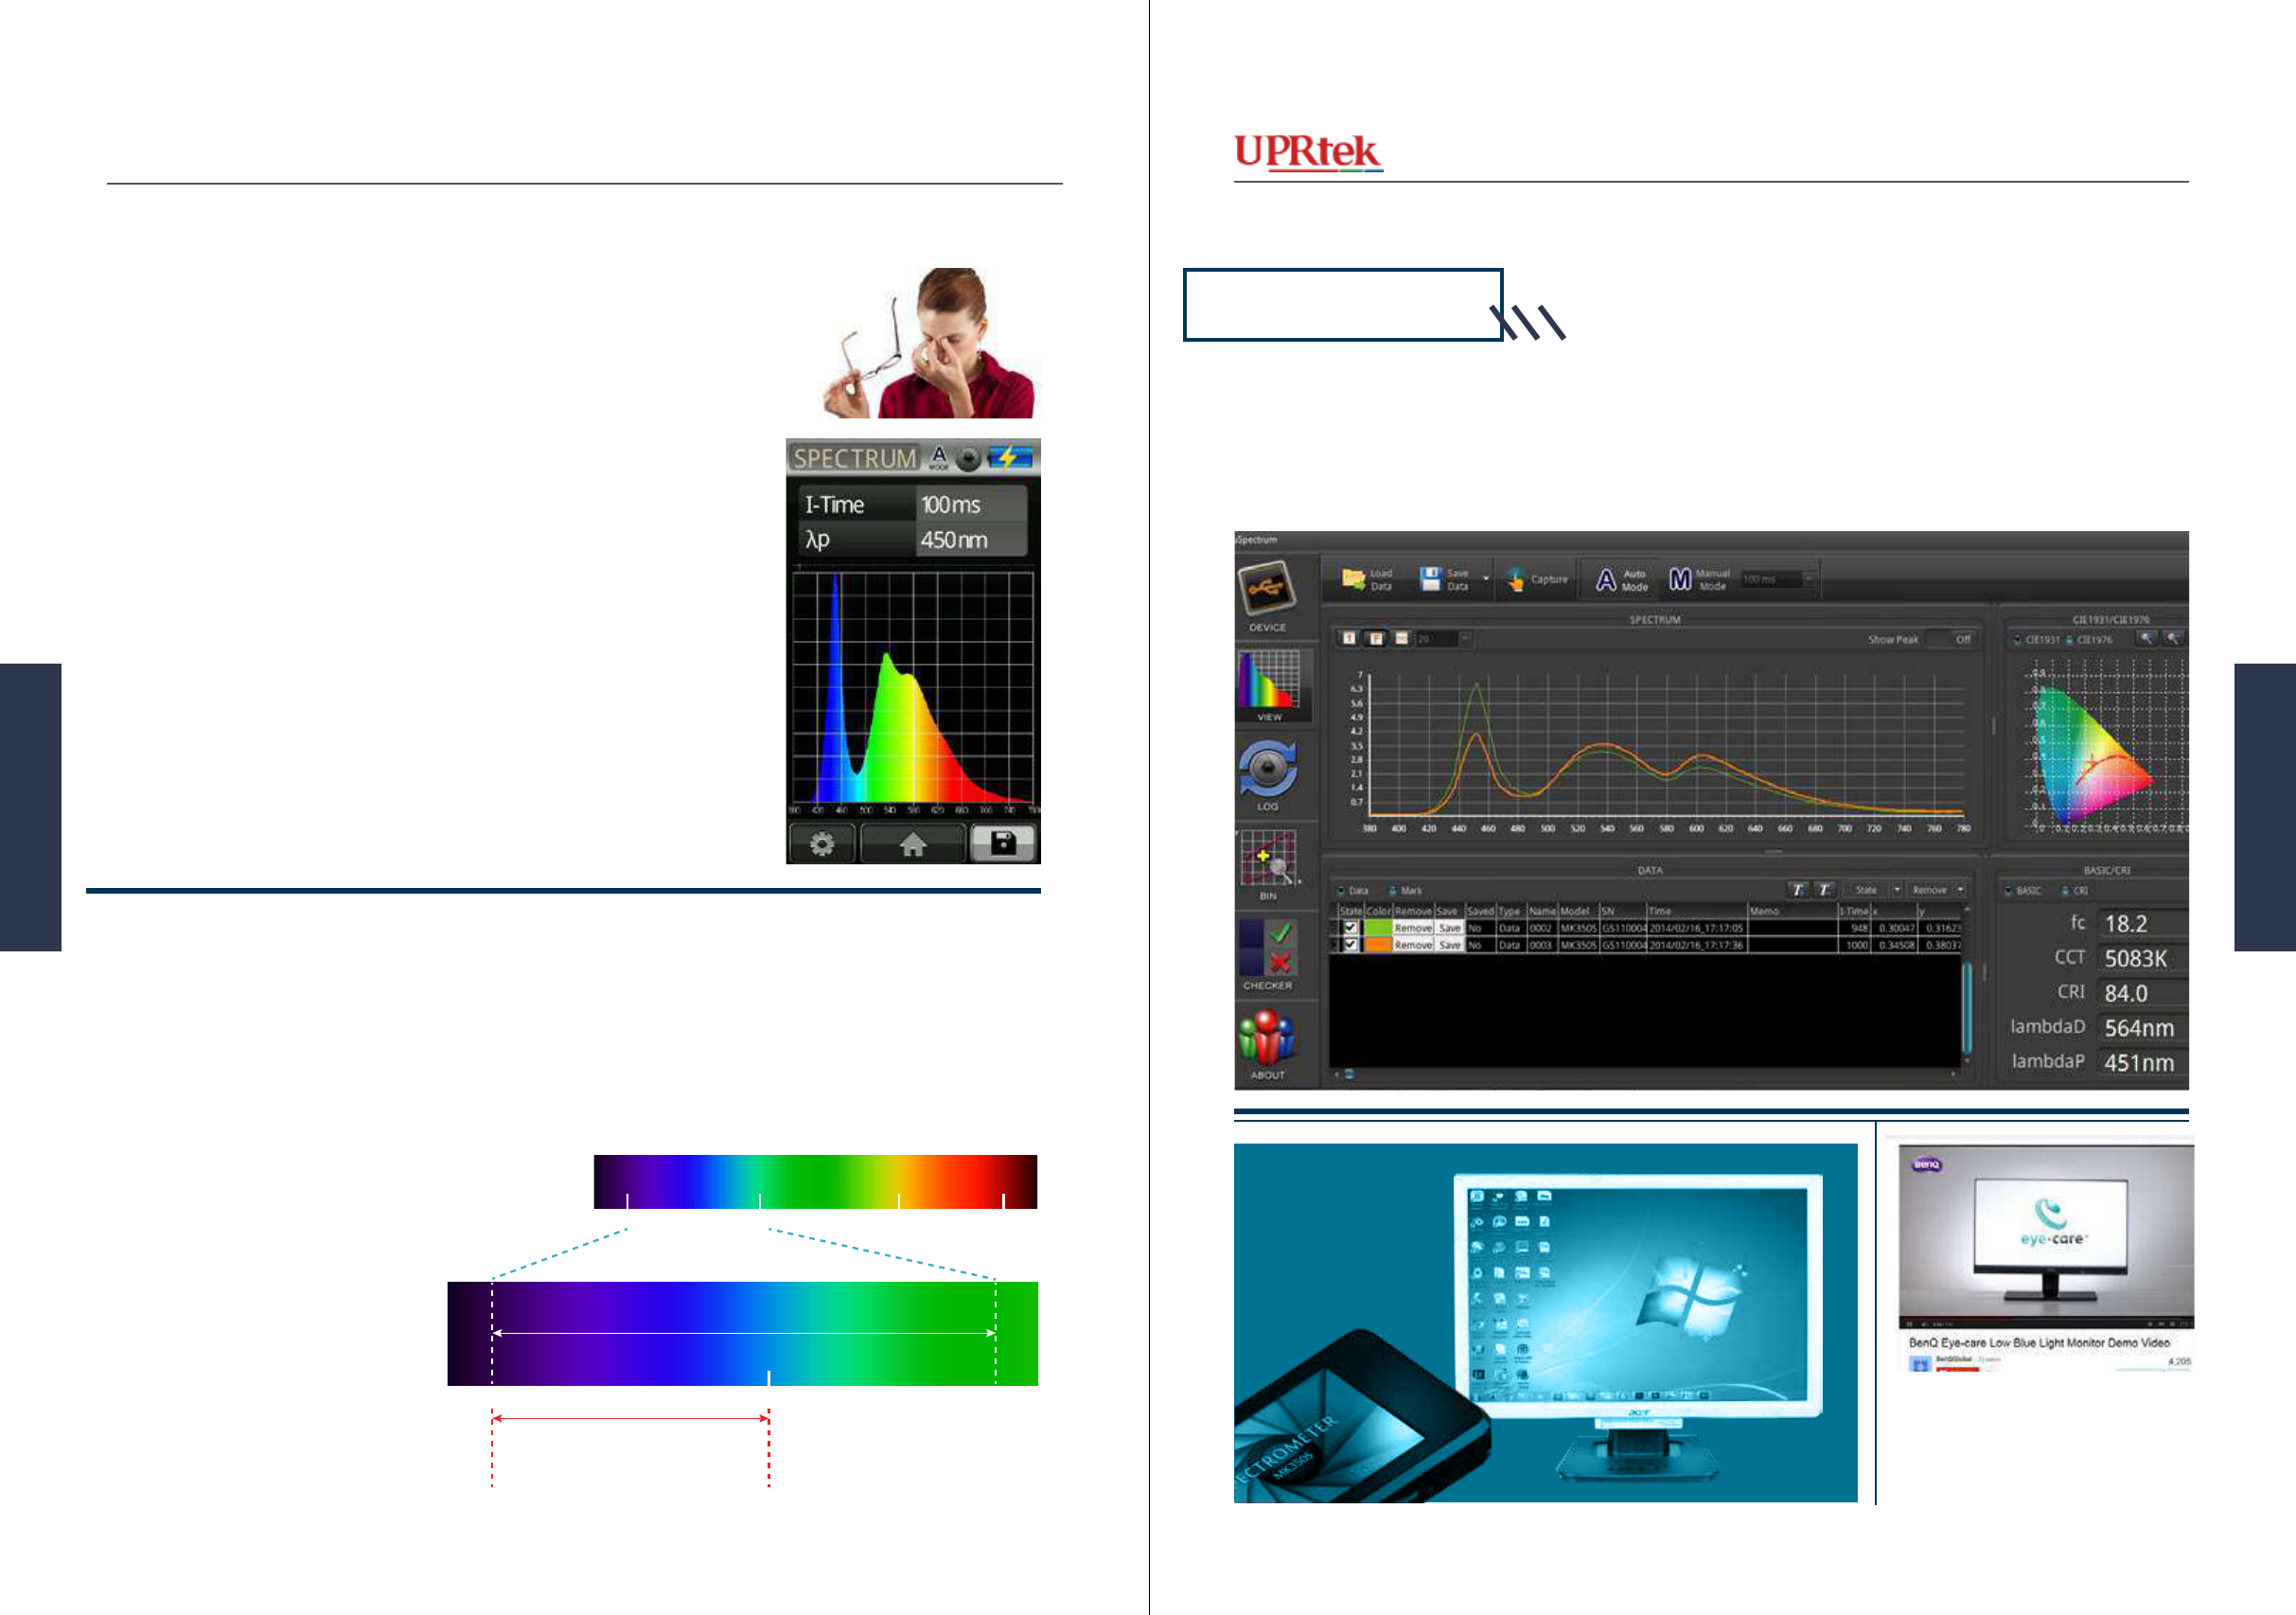
Version 20140410b - Not for distribution - © Copyright 2014 UPRtek All rights reserved
Versio 20140410b - Not for distribution - © Copyright 2014 UPRtek All rights reserved
Much has been discussed about
harmful “Blue Light”, which
refers to the visible blue region
from 400nm - 450nm (shorter
wavelength region of blue). It
is also referred to HEV (Harm-
ful Energy Visible) light and is
under suspicion of causing cell
damage in the retina and Age-re-
lated Macular Degeneration
(AMD). Also, post-cataract sur-
gery patients are more exposed
to HEV since part of the lens,
which yellows with age, is re-
moved and can no longer effec-
tively absorb the HEV blue light
(yellow is blue’s complement).
Measuring
Harmful
Blue
Light
The image below was taken with MK350S using the uSpectrum PC
software. MK350 shows a signicant reduction in HEV intensity
simply by turning down the blue color tones in the monitor’s color
adjustment panel. The monitor may appear distractingly yellowish at
rst, but your eyes will quickly get accustomed to it.
Blue Light ltering products include
Sunglasses that block out some of the
HEV light. There is a computer mon-
itor screen lter and even a low blue-
light monitor.
400 nm
400 nm
Blue Light
450 nm 500 nm
Visible Light
500 nm 600 nm 700 nm
HEV Induced
Retina Damage
and cell Death
Exposure to HEV at night is
also mentioned in suppressing
Melatonin suppression (sleep
hormone) causing sleep disor-
ders by disrupting our circadi-
an (24 hr) rhythms. Anything
that is designed around LEDs,
TVs, Computer Monitors, Light
Bulbs all have the potential of
exposing you to HEV light. The
MK350 can easily reveal HEV
on the color spectrum.
http://www.visionmonday.com/
business/labs/article/protect-
ing-eyes-from-bad-blue-light-
vm-090913
LED monitors,
turn down the blue
Measuring Harmful Blue Light
http://www.youtube.com/watch?v=B8JrVESRcJk
115114 MK350 Series Survival Handbook
Applicaons
Applicaons
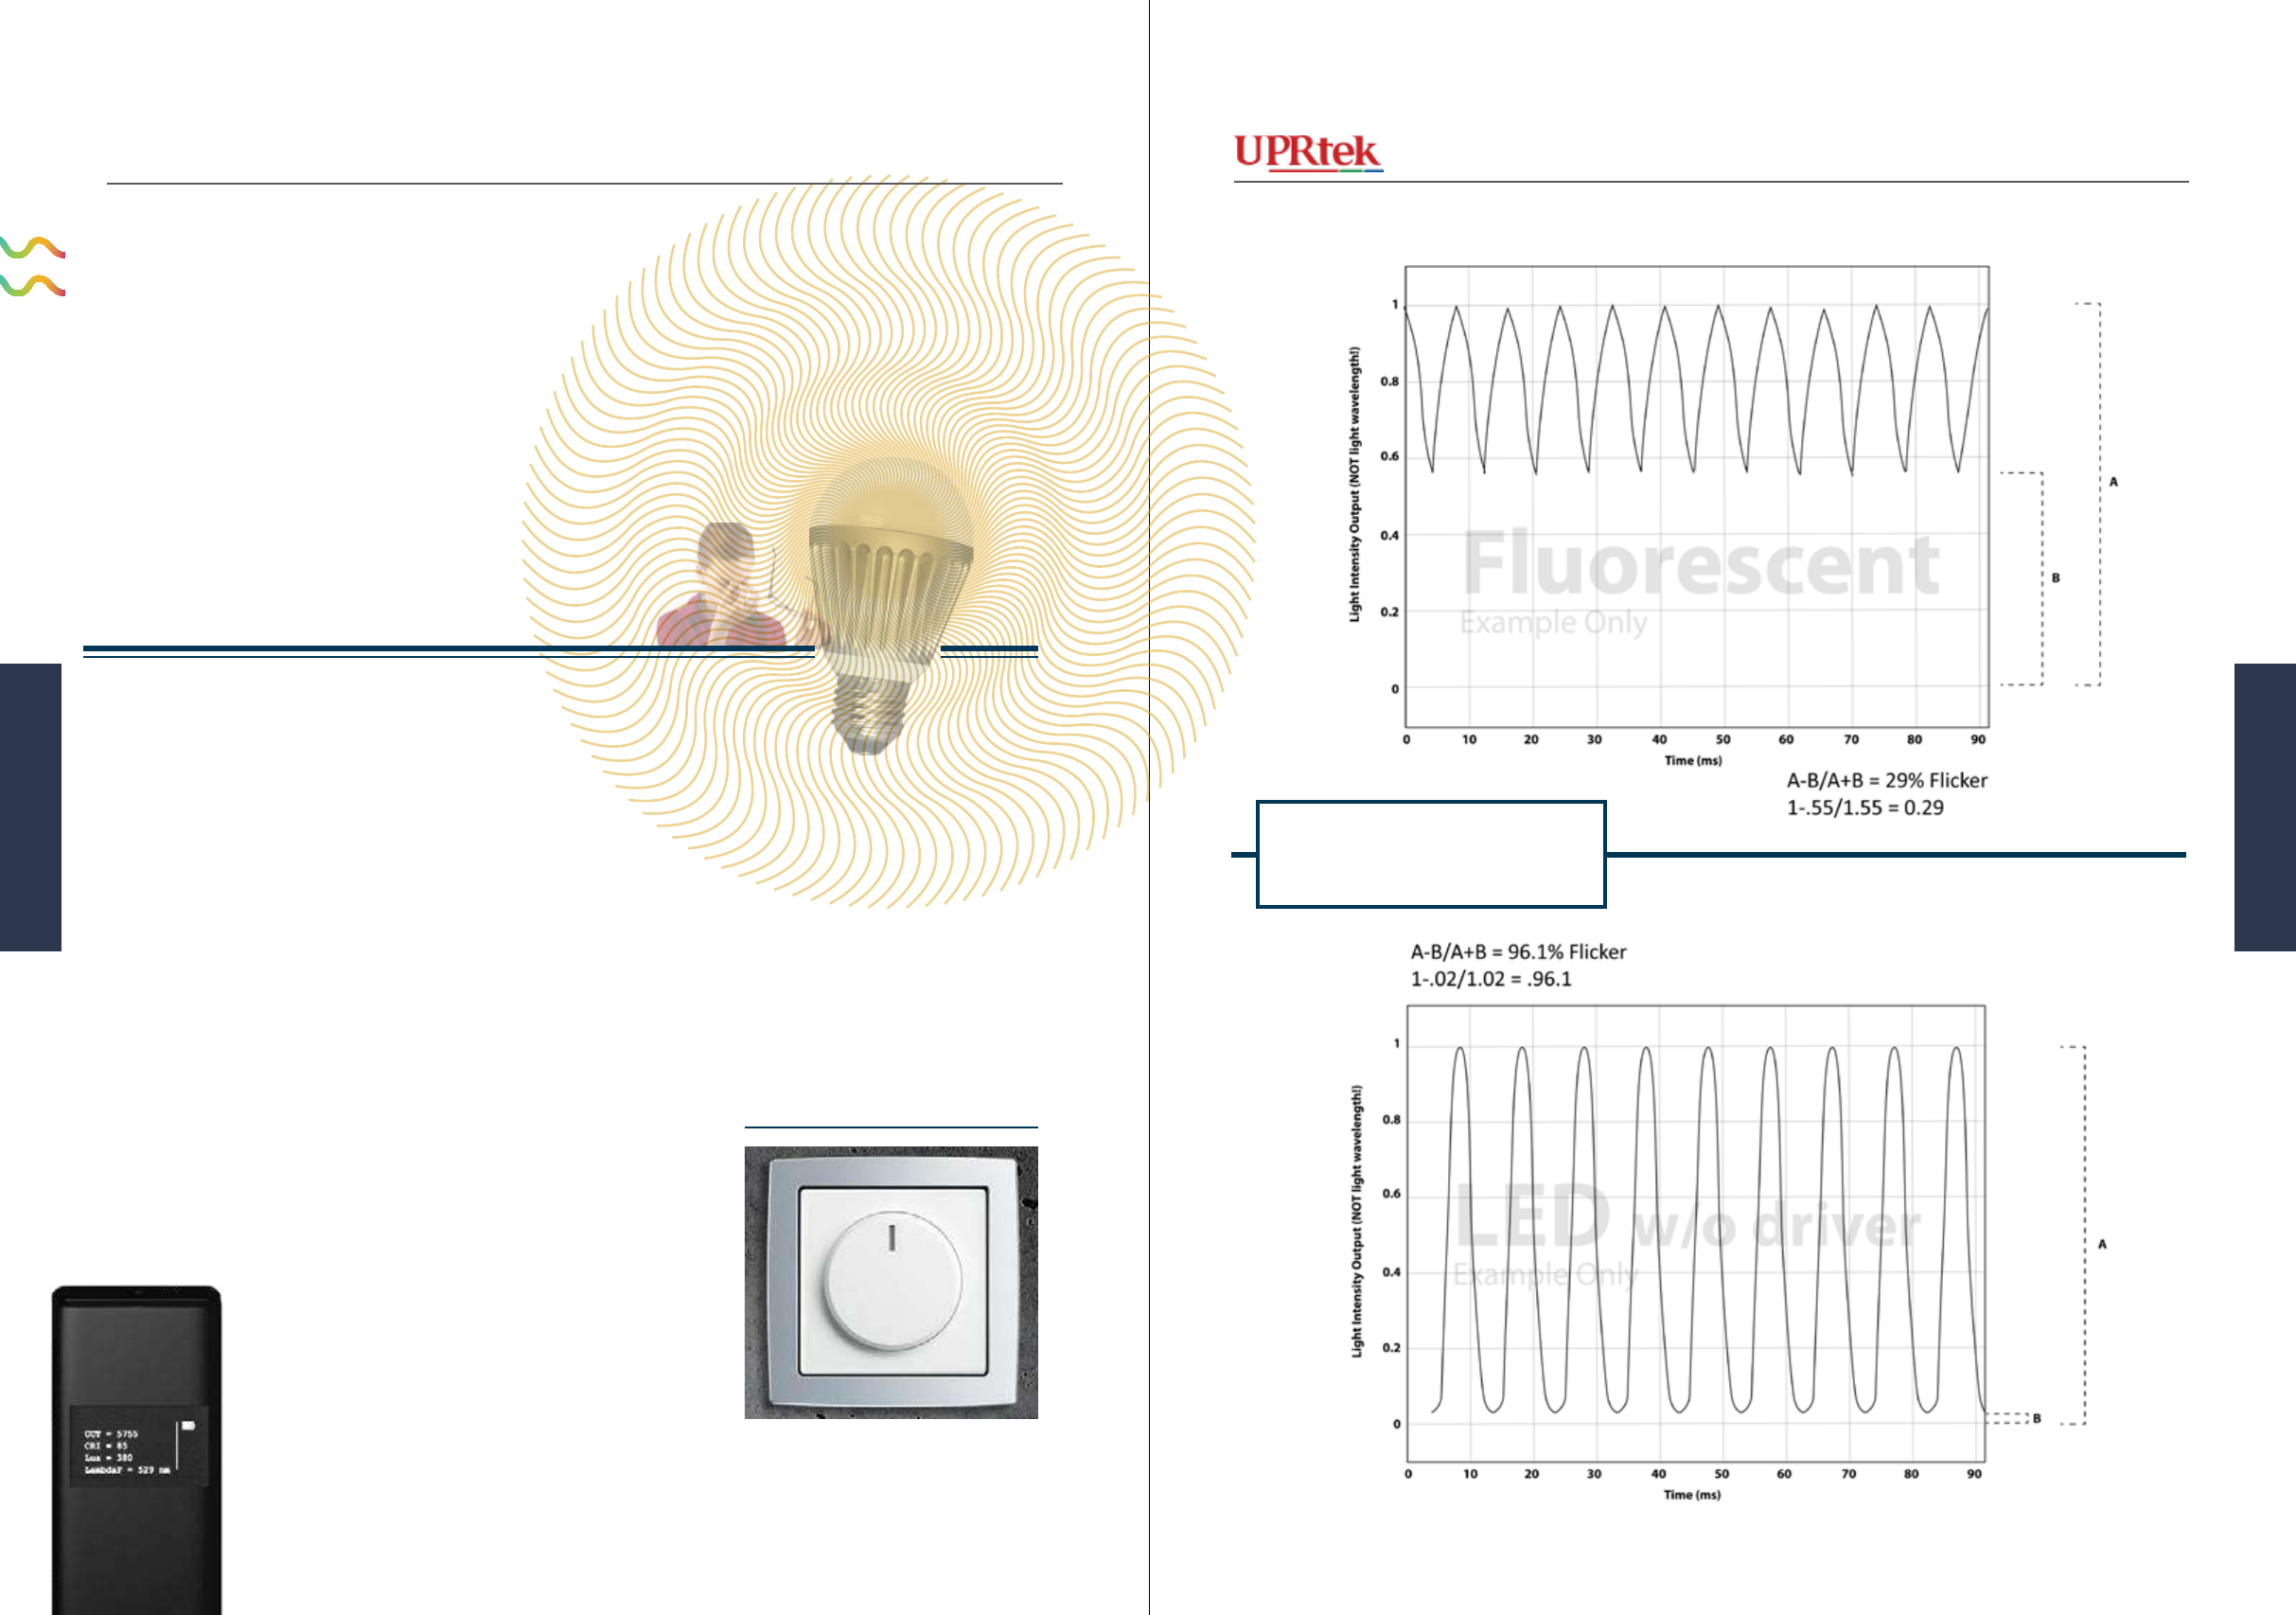
Version 20140410b - Not for distribution - © Copyright 2014 UPRtek All rights reserved
Versio 20140410b - Not for distribution - © Copyright 2014 UPRtek All rights reserved
Flicker is the problem certain
lights have, exhibiting a subtle
pulsating or strobing effect, most
of the time barely noticeable by
the human eye - however, more
organizations are paying atten-
tion to icker because it is being
implicated in triggering a host
of health related issues such as
epilepsy attacks, migraines,
fatigue, reduced visual task
performance, distraction and
visual impairment.
The source of this problem is
the power current, particularly a
conict with the mains (from the
http://apps1.eere.energy.gov/buildings/publications/pd
fs/ssl/poplawski_dimming_lightfair2012.pdf
Dimmer
(these waves are NOT light color waves, but light intensity waves)
Measuring
Flicker
outlet) and the power supply (of
the light). Dimmers also induce
or increase icker. All lights
running on AC power have this
problem to a certain degree -
Fluorescent lights had long been
most criticized for high icker
before more recent advances .
Now LEDs are also beginning
to exhibit the same symptoms.
LEDs further complicate the is-
sue with their changing power
needs that come with tempera-
ture uctuations.
LEDs should be equipped with
what is called an LED driver -
it sits between the power supply
of the light and the light itself.
It’s main function is to regulate
or maintain a constant voltage to
the LED - a well designed driv-
er will adequately mitigate the
problems of icker. If an LED
is equipped with components for
other types of lights (e.g. trans-
formers), this will also cause
icker problems.
The MK350D is able to accu-
rately measure icker percent-
age from 1~100%. 0% is a pure
uninterrupted continuum of light
(no icker). 100% is when there
are complete breaks or 0 light
anytime in the wave.
Calculating
Percentage of Flicker
Measuring Flicker
Busch-Jaeger - CC-BY-SA-3.0
MK350D
117116 MK350 Series Survival Handbook
Applicaons
Applicaons
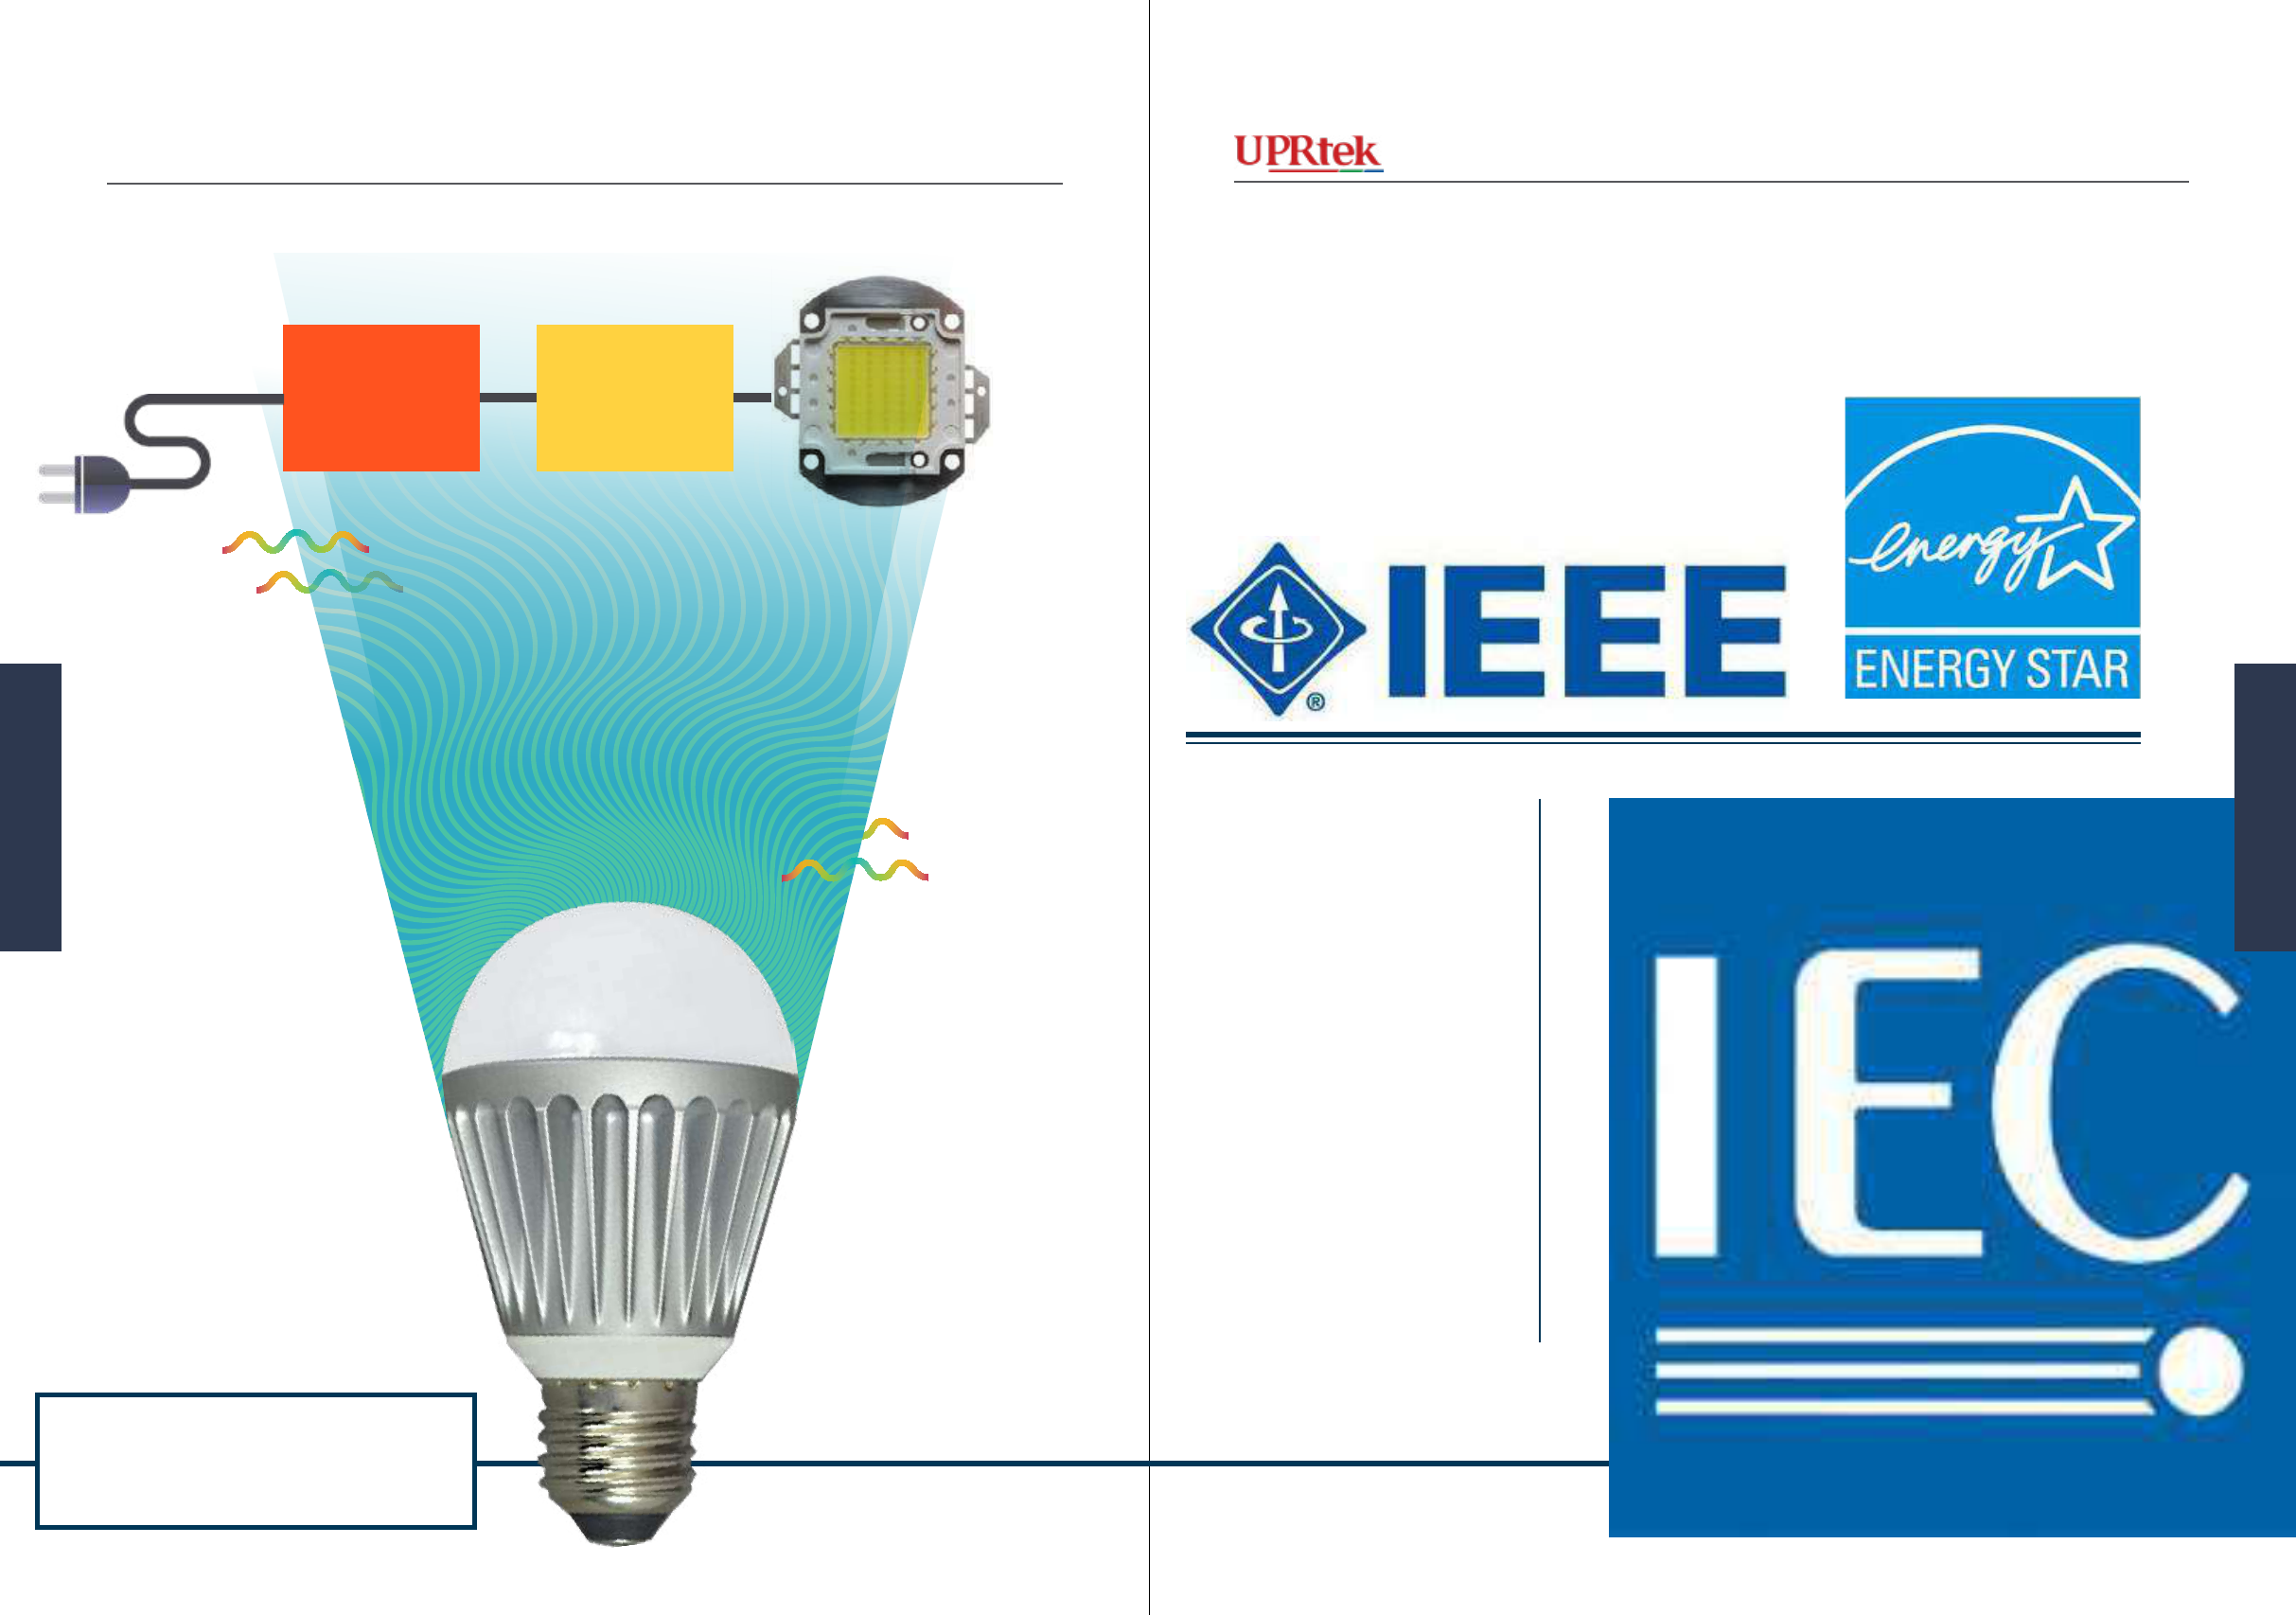
Version 20140410b - Not for distribution - © Copyright 2014 UPRtek All rights reserved
Versio 20140410b - Not for distribution - © Copyright 2014 UPRtek All rights reserved
Power Supply
Driver
Mains
A good LED driver adequately
regulates power uctuations and manages
LED power needs, reducing icker.
State and Light Energy agencies are
already beginning to address this
serious problem with draft regula-
tions in progress (as of this writing
2/2014). The Russian government,
after reviewing exhaustive studies,
has implemented a ban on LED de-
vices with high icker rates.
Organizations such as Energy Star,
IEC, IEEE, EPA are all considering
Flicker standards at the time of this
writing (02/2014).
119118 MK350 Series Survival Handbook
Applicaons
Applicaons
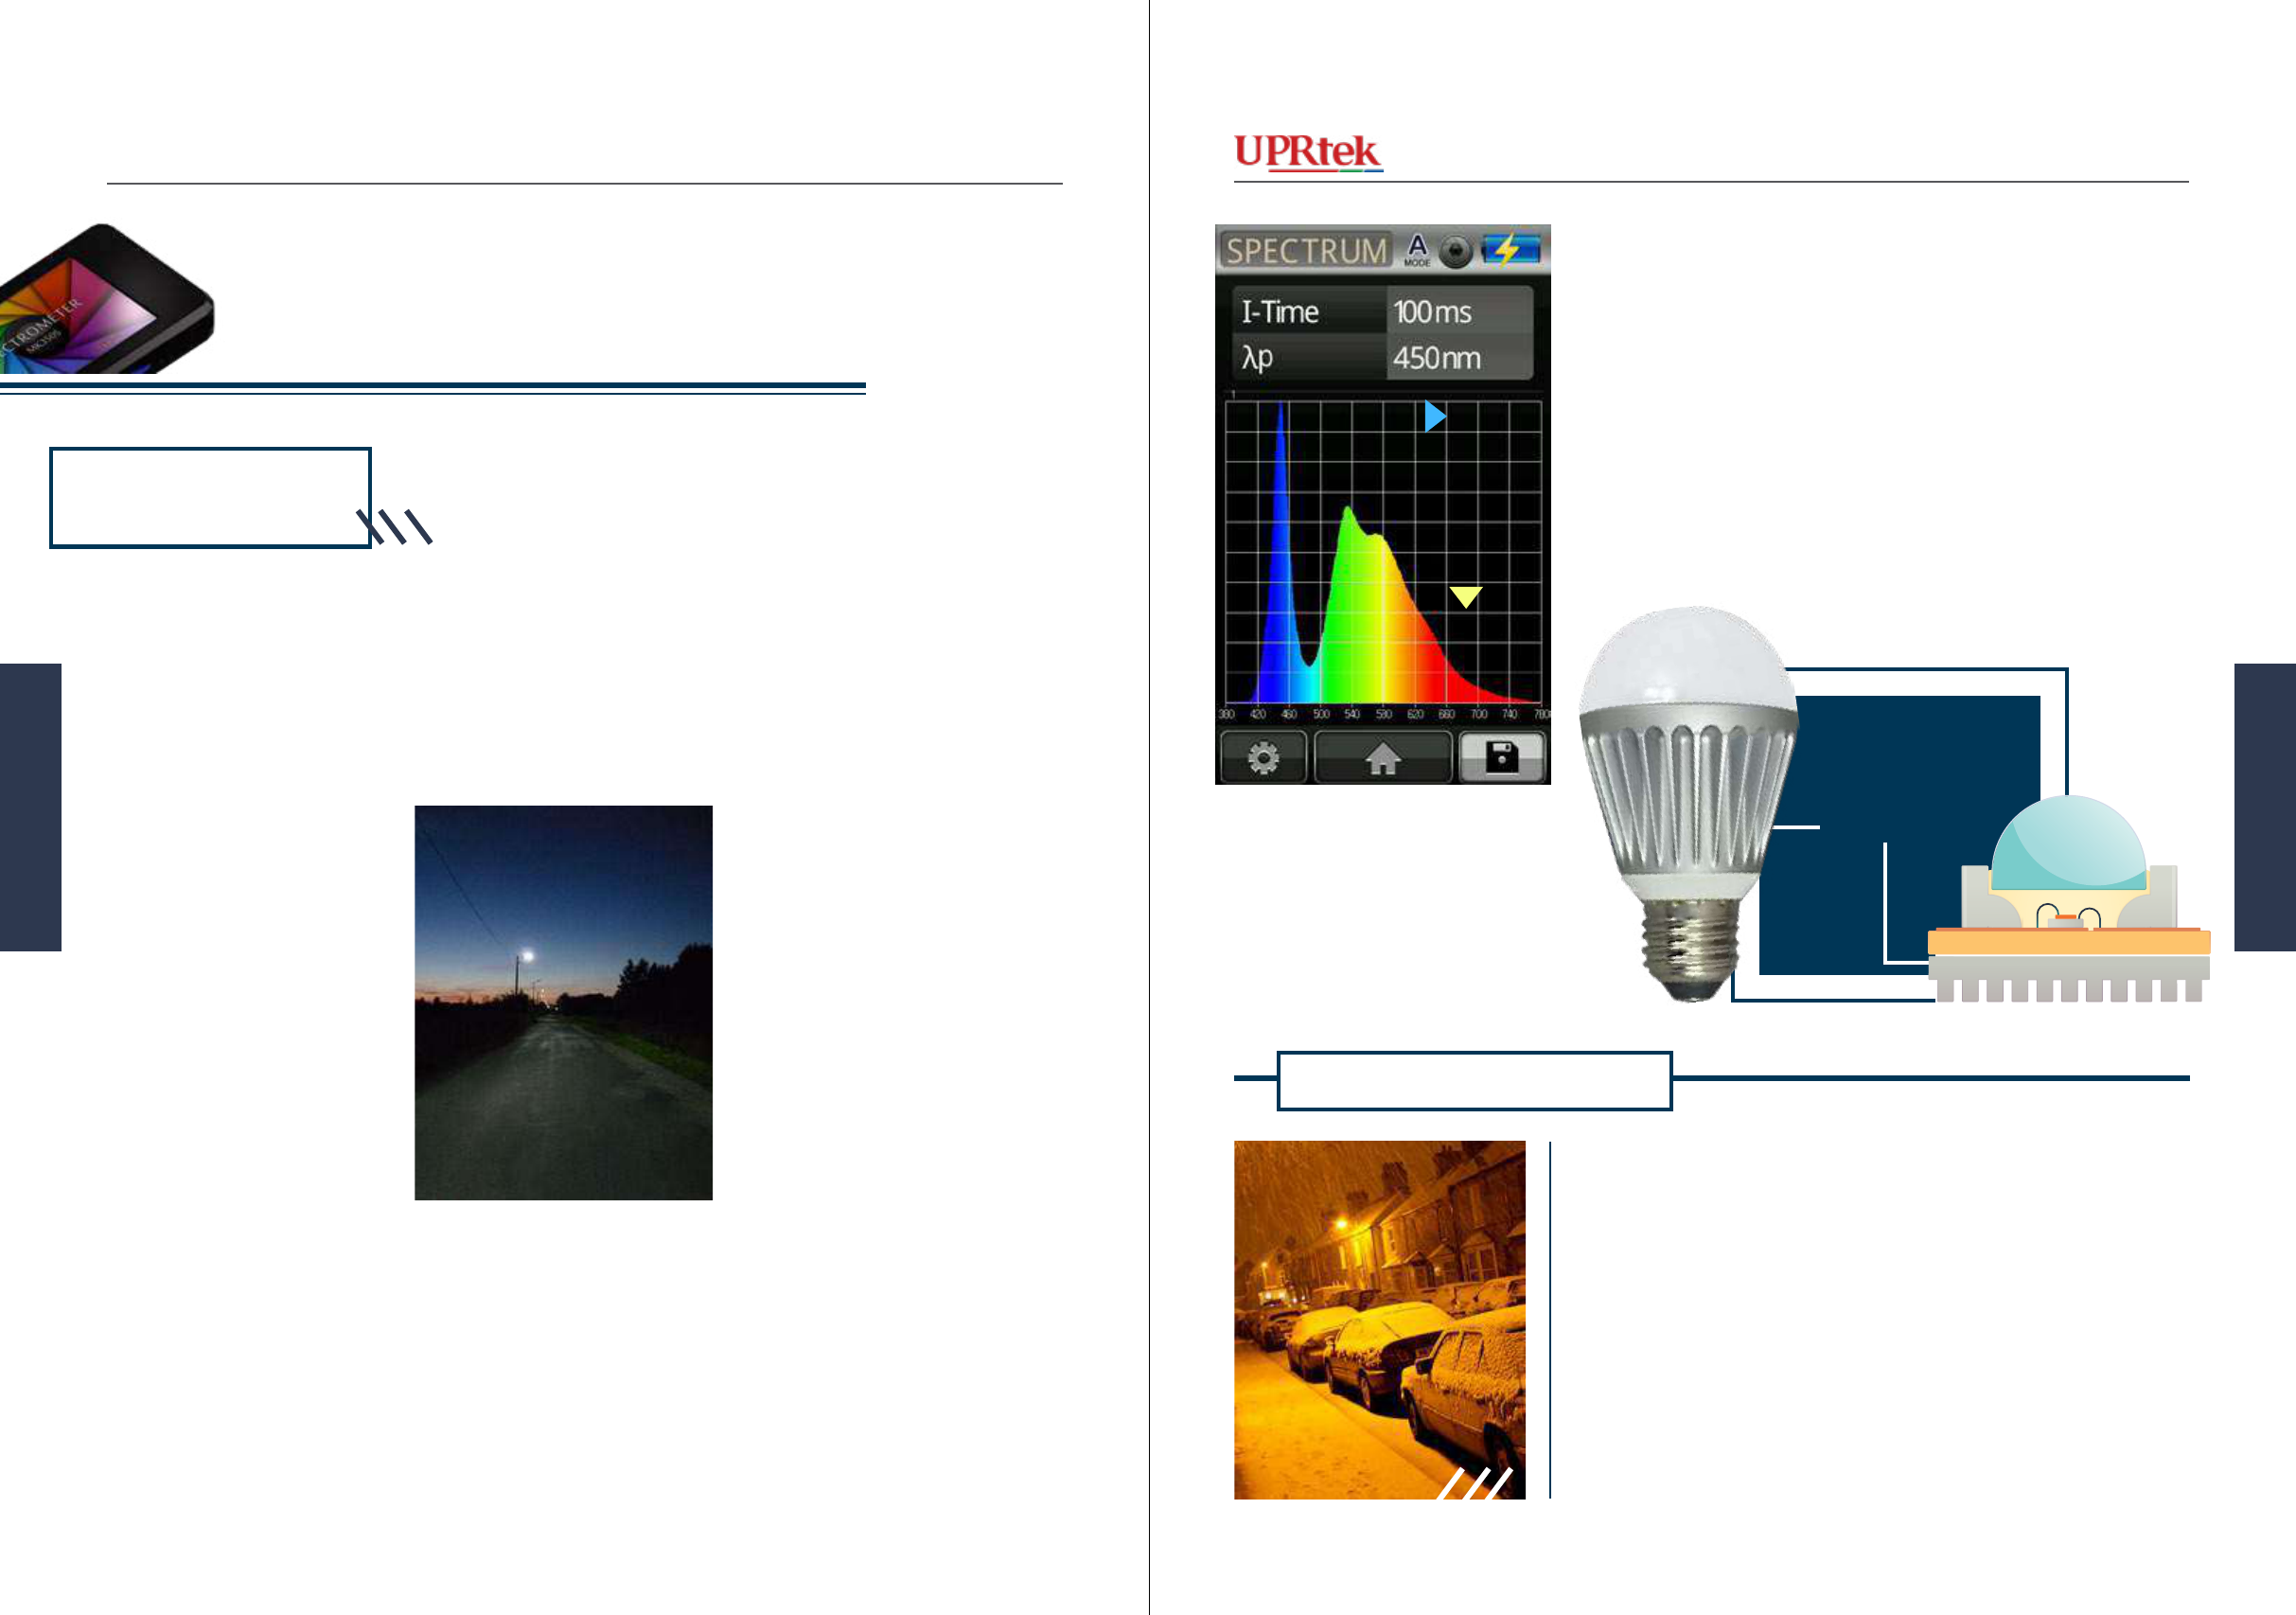
Version 20140410b - Not for distribution - © Copyright 2014 UPRtek All rights reserved
Versio 20140410b - Not for distribution - © Copyright 2014 UPRtek All rights reserved
Lighting
Road&Trac
Blue Shift
Yellow Shift
Heat Sink
Conversely, LED street
lamps and trafc lights
have a heat problem in the
Winter too. But it is the
lack of heat that is the issue
- LEDs give off heat but
much less heat than both
Incandescents and Fluo-
rescents - and this leads to
snow and ice build-up on
street lights.
Measuring
LED Degradation
Yes it’s true that LEDs can last up to 50,000 hours
and this means over 11 years of night time service
from LED street lamps. However, total lifetime
and useful lifetime are two completely different
things for LED lights. LED light quality inherent-
ly degrades in color and luminescence over time
and when its “useful life” as a street light is over,
there can be no compromise - they
must be replaced. The challenge is
how to monitor and maintain those
LED street lights, especially if
they are located in rural, even des-
olate highway areas. This is where
the MK350 devices are especially
important in practicality and con-
venience. Not only are they very
portable, these devices can auto
capture and log data over time,
which could be very convenient
for equi-spaced street lighting.
LED degradation is due to heat that passes through
the LED, and we know that heat can adversely af-
fect materials (e.g. incandescent laments). When
LED light quality degrades, you can assess where
the problem lies by looking at the color spec-
trum - most LEDs have a Blue peak and a Yellow
peak - the Blue is due to the light emitted from
the semiconductor - the yellow is the light emit-
ted from the Fluorescent lm (together they make
a white light). When there is degradation, what we
see in these spectrums are a blue-shift, where the
blue peak moves to the right toward the red - it is
a probable indication that the semiconductor ma-
terial is changing. It was also mentioned that the
yellow Fluorescent can also de-
grade, shifting downwards in the
spectrum (losing intensity).
This degradation is also a very
serious concern for LED trafc
lights where color is tantamount
to driver safety. Another issue is
weather - high temperature cli-
mates can also exacerbate degra-
dation. Yet another issue is that,
as difcult as it is to predict LED
color, it is as difcult to predict LED degradation.
These are all reasons that a portable LED light me-
ter like the MK350 devices for eld observations
are indispensable tools.
A few ways to alleviate heat related degradation is-
sues is to make sure you obtain good materials for
your semiconductor dies and also implement well
designed heat sinks to dissipate heat efciently.
A Wintery LED Issue
In this case, heating circuitry must
be built into the luminaires to sup-
plement heat to melt snow and ice.
In certain regions of the world, there
are very wide swings in hot-cold
temperatures and both heat dissipa-
tion and heating circuitry must be
built into the LED street light/trafc
light luminaire.
Measuring LED Degradation
Lighting Road & Trac
Tiverton UK - CC-BY-SA-2.0 Wikimedia Com-
mons
CmitryG - CC-BY-SA-3.0
- Wikimedia Commons
121120 MK350 Series Survival Handbook
Applicaons
Applicaons
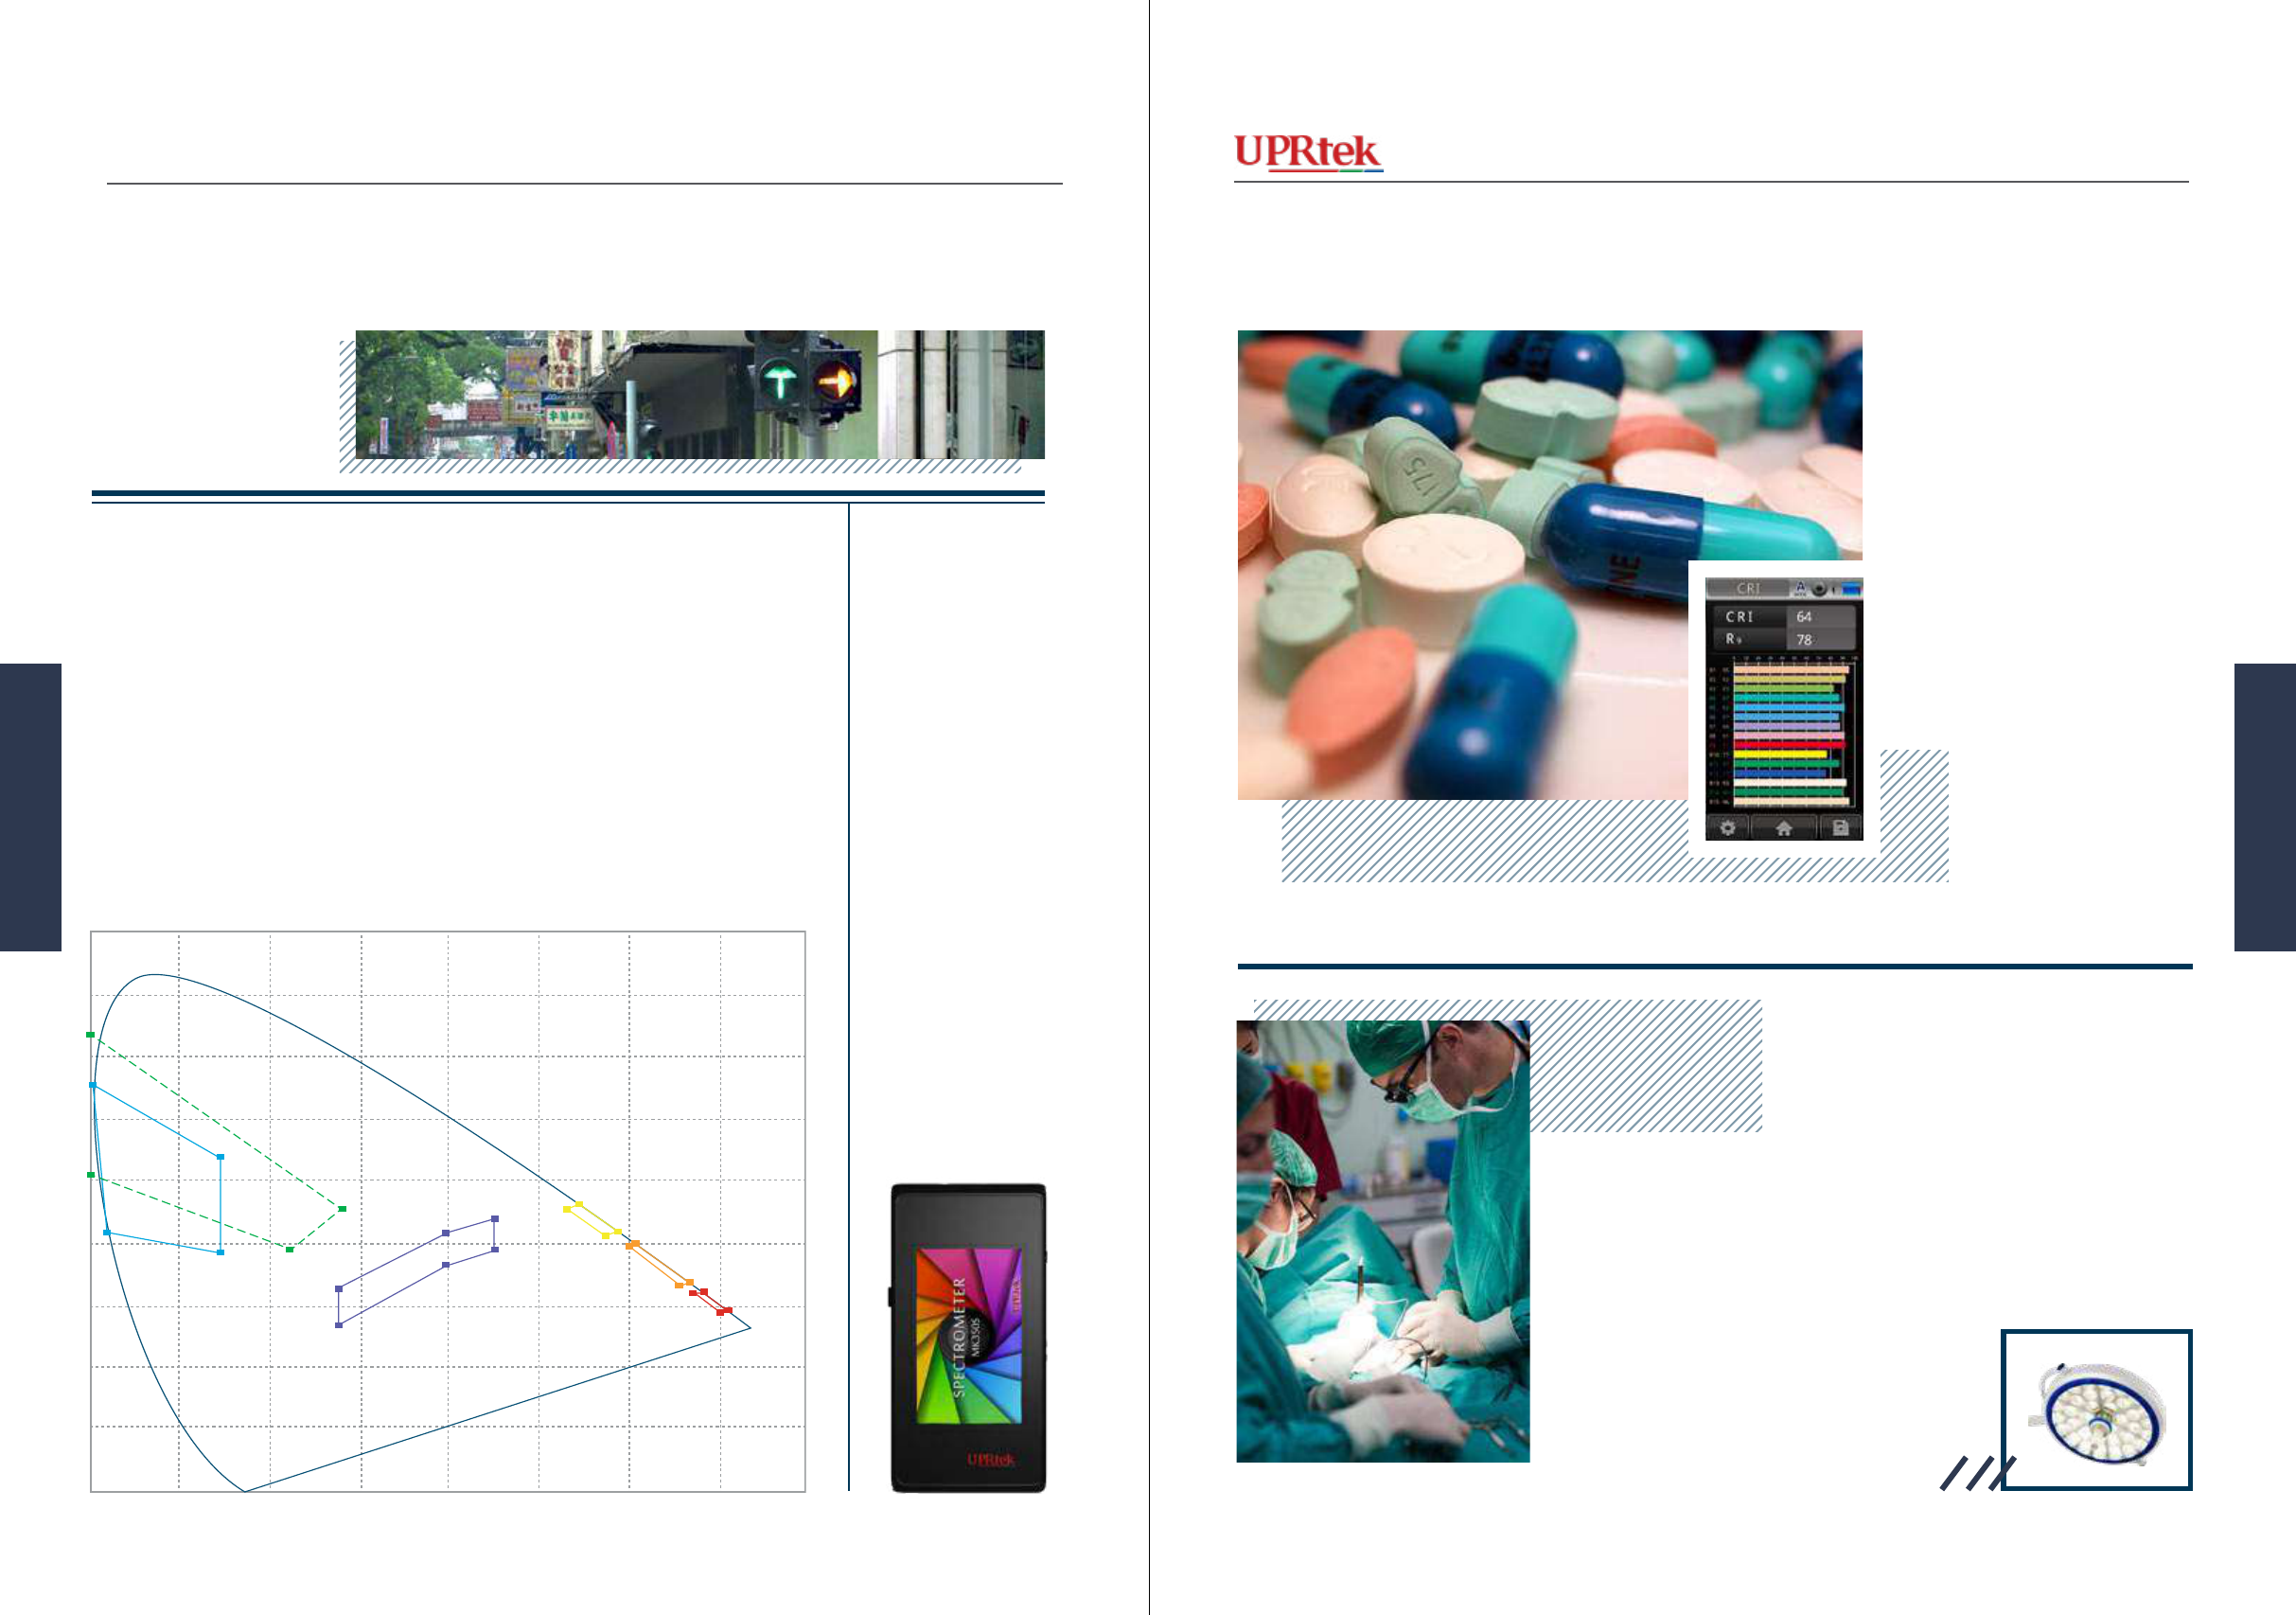
Version 20140410b - Not for distribution - © Copyright 2014 UPRtek All rights reserved
Versio 20140410b - Not for distribution - © Copyright 2014 UPRtek All rights reserved
In most developed countries,
it is critical to maintain proper
color quality for trafc lights .
Trafc lights using LEDs must
be carefully monitored as grad-
ual shifts in color over time
could result in signicant issues
in color perception as daylight
changes (due to time-of-day, )
cloud cover and air pollution.
It is important in pharmaceuti-
cal environments to make sure
high LED CRI (color rendering)
can render pill, tablet and label
colors appropriately to reduce
mishandling and problems in
pill identication. For the same
reason, it is important for senior
and elderly homes to account
for good CRI lighting. In oth-
er areas of a hospital, LEDs are
preferred because of long-life
- changing bulbs frequently re-
sults in loosening of dust from
the ceilings.
As LED technology has evolved
with more reliable CRI, CCT
and LUX specications, there
has been an increase in LED
surgical lighting as a cost sav-
ing, low-maintenance option to
Halogen based lights. In addi-
tion, the very low heat generat-
ed from LED lighting reduces
tissue necrosis. However, when
490
480
470
500
510
520
530
540
560
560
580
590
600
610
620
550
Measuring
Traffic Lights
In the US, the ITE (Institute of Trafc En-
gineers) sets strict guidelines and regula-
tions for color compliance.
Below is a sample Color Space with Bin
markings for trafc light color guidelines.
The MK350S has Bin Rating tools to help
assist these organizations in procuring ap-
propriate colored lighting.
Measuring Light in Hospitals
Surgical Lights
Measuring Trac Lights
Measuring Light in Hospitals
Surgical Lights
Wikipedia Creative Commons Attribution-Share Alike 3.0 Unported - no author Wikimedia Commons
manufacturing or purchasing
surgical LED lights, it is im-
portant to check CRI values, as
it will determine proper color
rendering for intricately visual
procedures.
123122 MK350 Series Survival Handbook
Applicaons
Applicaons
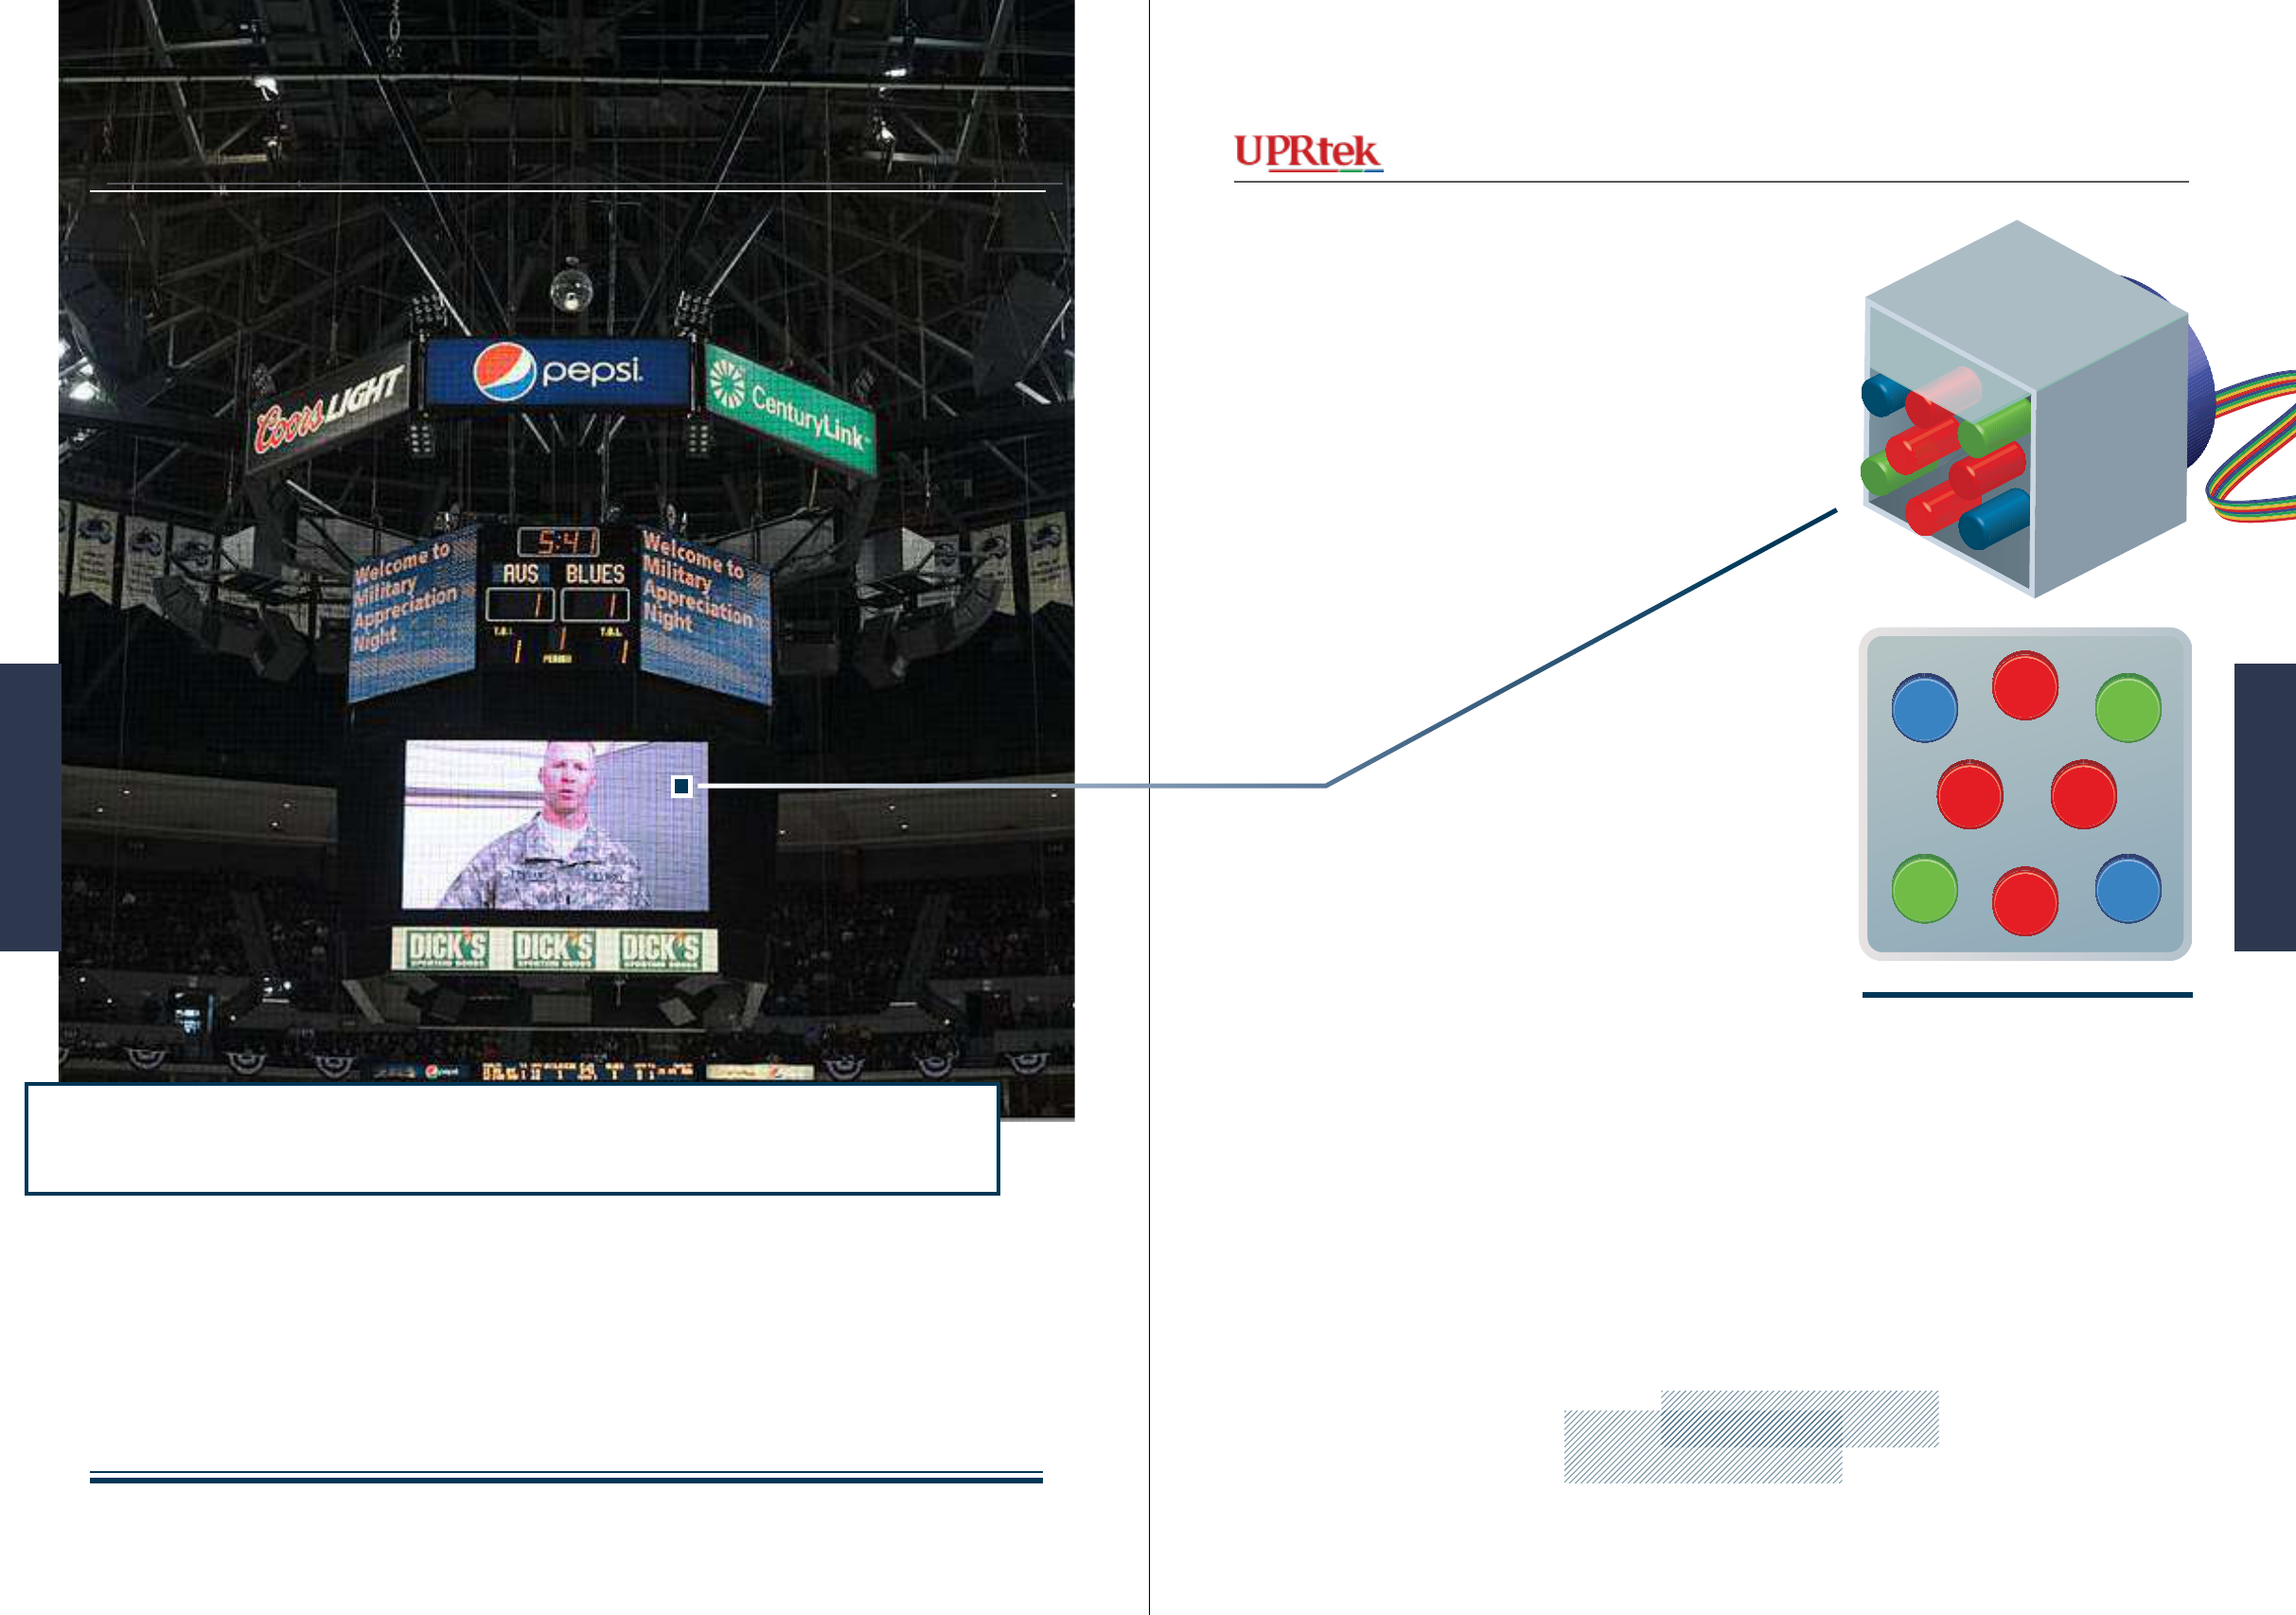
Version 20140410b - Not for distribution - © Copyright 2014 UPRtek All rights reserved
Versio 20140410b - Not for distribution - © Copyright 2014 UPRtek All rights reserved
More recent Jumbo Screen / Jumbo
Tron wall-sized monitors are turning
to LED based display. These screens
are made up of groups of Red Blue
Green LED bulbs in the thousands.
Each group makes up a pixel of in-
formation like on a TV.
Replacement LED bulbs must match
the old LEDs to ensure proper color
and intensity match with the remain-
ing LEDs and this can all be easily
done with the MK350 device.
Otherwise, over time, the images on
the screen will begin to show anom-
alies in color. On another note, you
can use the MK350 to monitor deg-
radation of LEDs as well, because
this will also affect picture quality.
It then uses Color Mixing strategies to vary each group of
pixels to achieve the right colors in the right areas of the
screen. When these LEDs begin to degrade or when they
fail, they must be replaced. However, with the unpredictabil-
ity in LED light color, it is necessary to pay attention to the
light quality of the replacement bulb and an MK350 device is
a convenient device to do to just that.
Replacing LEDs in Jumbo Screen
124
LED Pixel Modules
Replacing LEDs in Jumbo Screens
125124 MK350 Series Survival Handbook
Applicaons
Applicaons

Version 20140410b - Not for distribution - © Copyright 2014 UPRtek All rights reserved
Versio 20140410b - Not for distribution - © Copyright 2014 UPRtek All rights reserved
Any LED based TV or Monitor manufactur-
er can use a light meter to test screen colors.
You can even use Illustrator or Windows
Paint to ll an area with a primary color and
nd the dominant wavelength by displaying
λd on the Basic List.
You can use the MK350 to test the color
range of any LED based monitor. As you
know, the CIE 1931 chromaticity diagram
represents all the colors that we can see.
However, an LED monitor is only capable of
displaying only a subset of those colors. One
monitor brand might be able to display a larg-
er portion of the area. How do you check?
First establish where the Red, Blue and Green
points are for your monitor. Show a pure red
color on the monitor (Windows Paint) and
take your MK350 and hold it up to the screen
and take a reading with the Basic List show-
ing the dominant wavelength (λd). If you
draw a line from the white point (.33, .33),
and extend it to the furthest contour point,
it will be λd. This should tell you how true
your reds are on your monitor. (Note: your
monitor should be adjusted to Normal color
tones)
λd
Second, do the same for Green and Blue and
check their λd values. Then draw a line be-
tween the three points. The area within this
triangle are all the colors that this monitor
is capable of displaying - as you see there is
alot of visible color that it will not be able to
show.
λd and Purity
Testing and Calibrating LED Based Screens
and Monitors.
r
b
g
Testing and Calibrating LED Based screens and Monitors.
r
127126 MK350 Series Survival Handbook
Applicaons
Applicaons
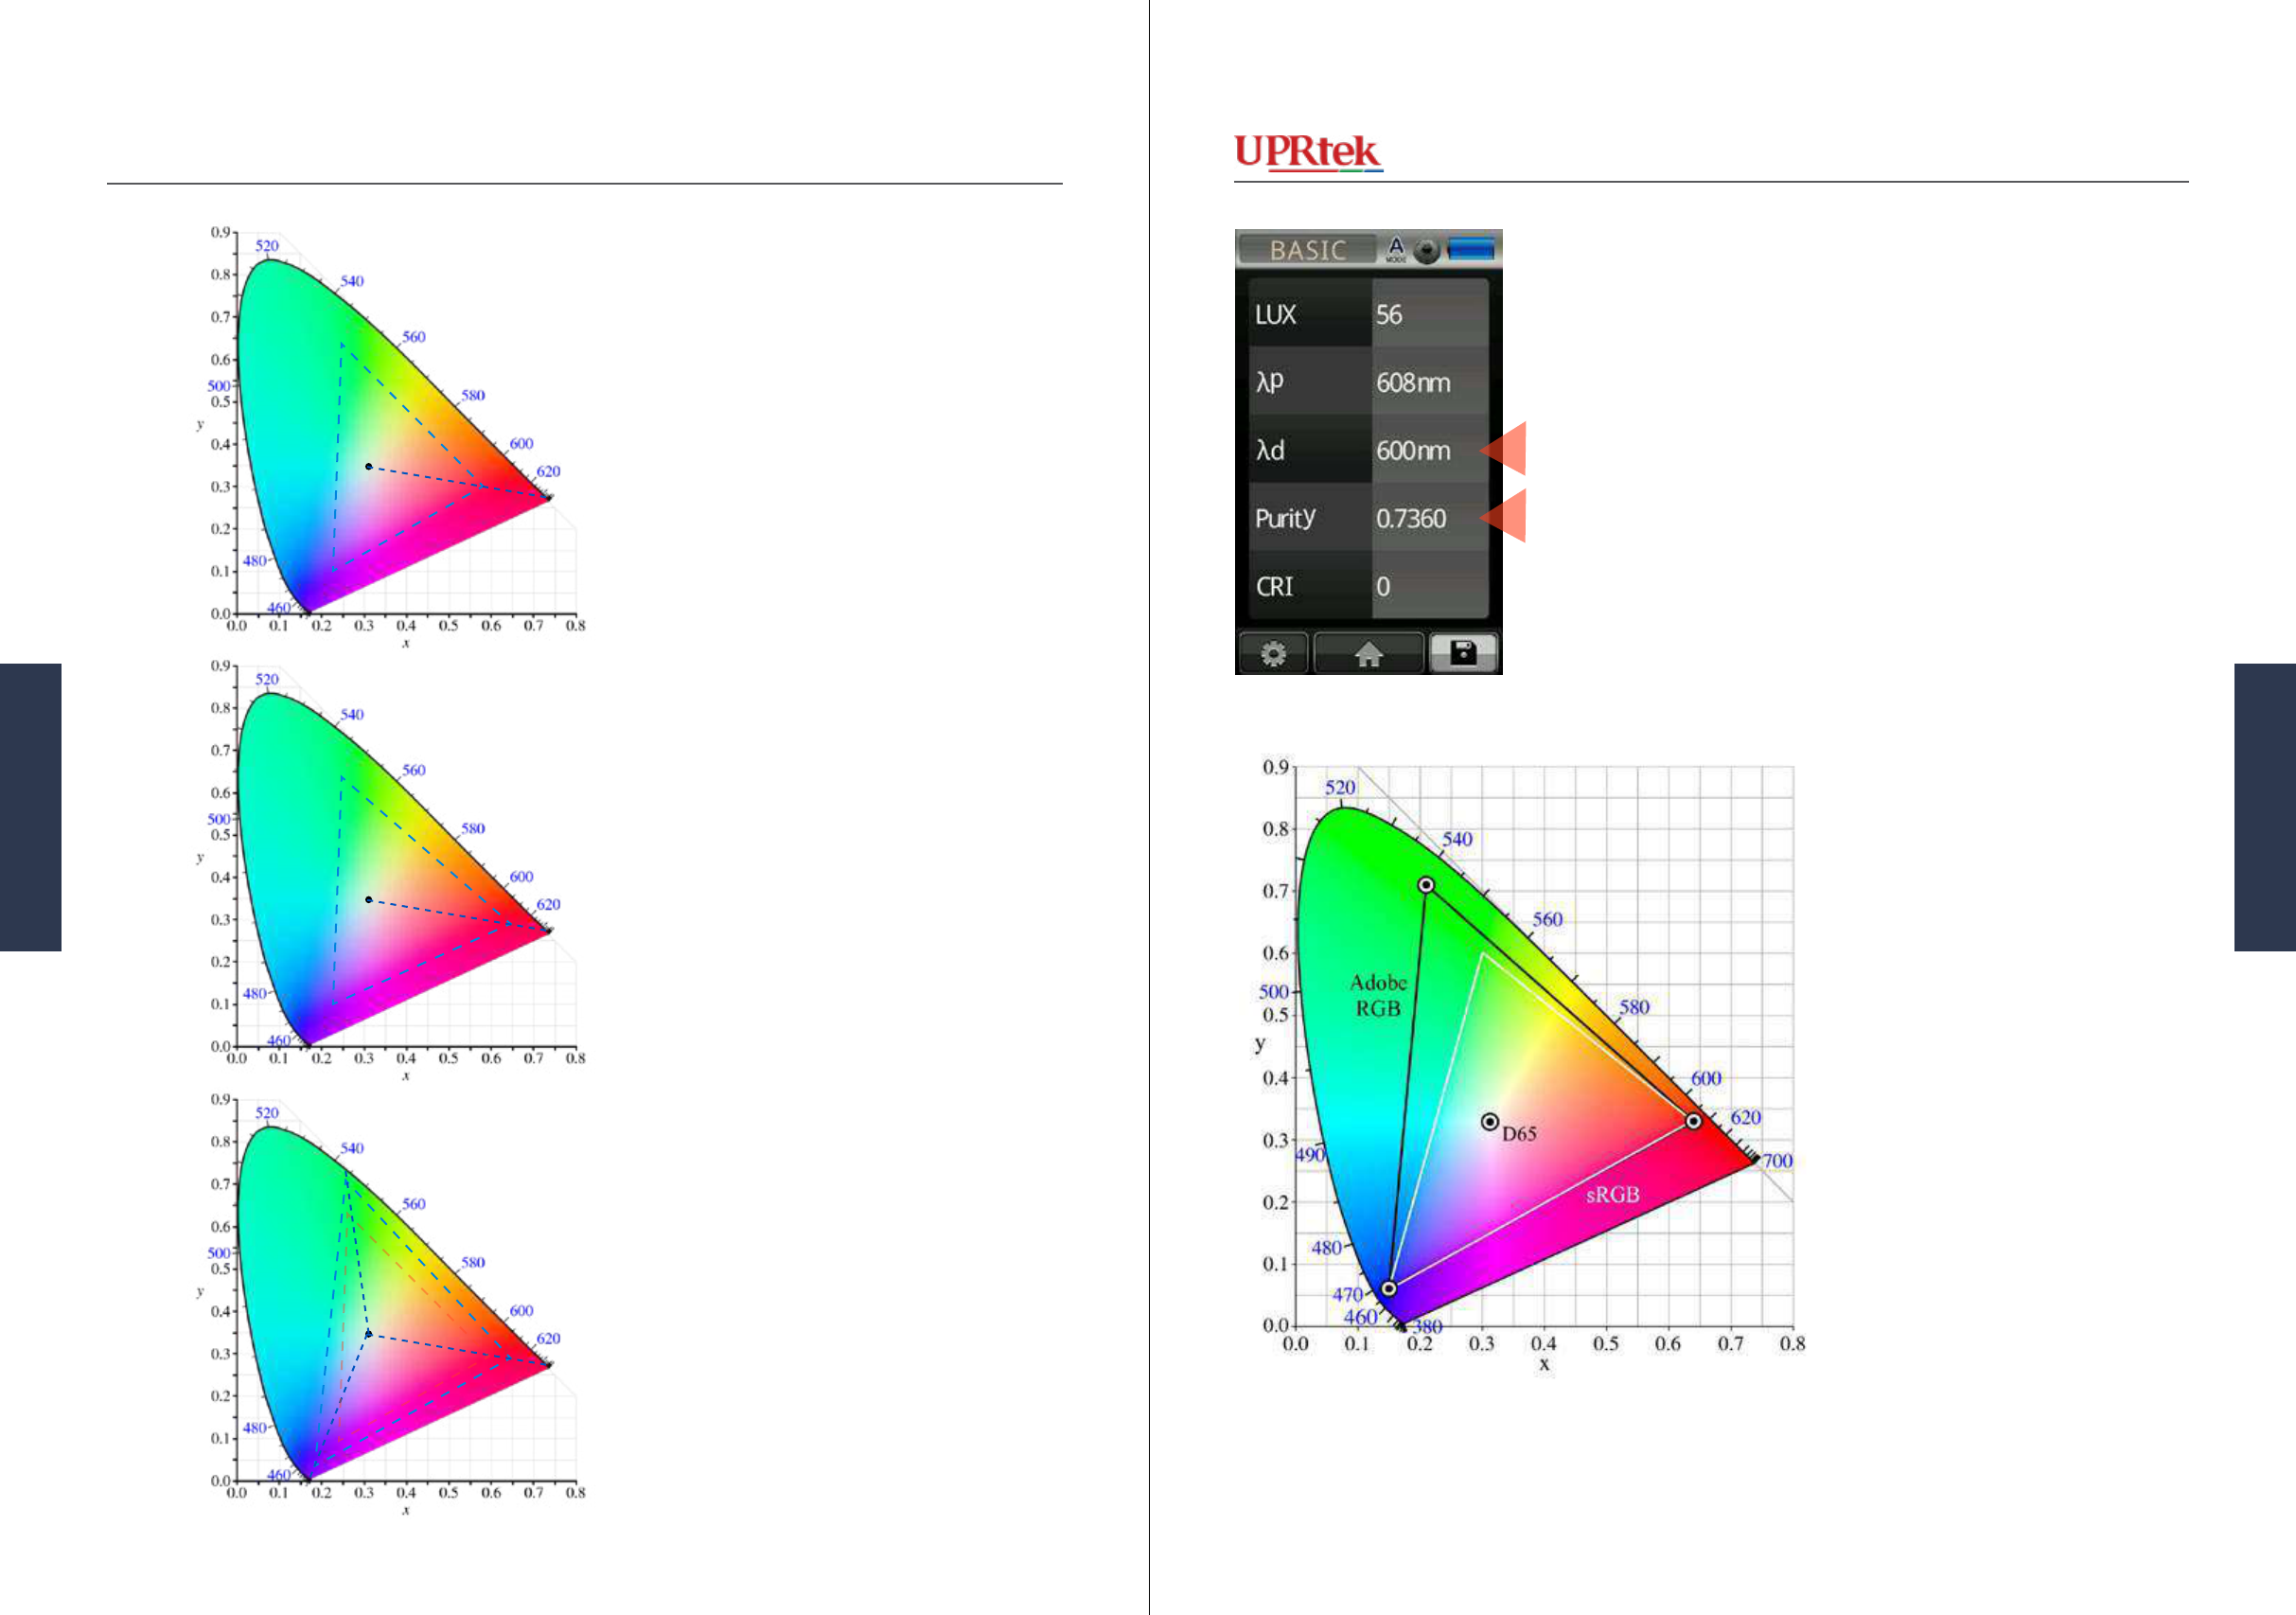
Version 20140410b - Not for distribution - © Copyright 2014 UPRtek All rights reserved
Versio 20140410b - Not for distribution - © Copyright 2014 UPRtek All rights reserved
Now, let’s look at another measure-
ment. It’s called “Purity”. Purity is a
percentage that is:
s/s+t = Purity
Purity tells us how close your color
is to the outer edge which represents
our pure colors.
r
g
b
λd
s
t
Now, let’s say that the purity of the
red color on another monitor is larger.
What this is telling us is that the RGB
triangle will be larger and thus, we
are able to see more of our visible
colors.
r
g
b
λd
s
t
If the Purities for the greens and
blues are also larger, our triangle
would be larger and the monitor
would be able to display even more
visible colors than the other monitor.
All this is to say, the larger the purity,
the better.
λd
t
r
g
b
s
If you are testing a monitor or screen
device, it will probably be using a
specic Color Space. With most
monitors you will nd that they com-
ply with the sRGB color space. This
is indicated within the white triangle
(left). It means that an sRGB moni-
tor can only display colors within it’s
triangle borders, which also means
that there is alot of visible colors that
it cannot display. You can then use
your λd and Purity values to see how
well your monitor’s triangle ts with-
in the sRGB triangle.
Adobe RGB is another color space
that monitors and printers can use.
Notice it’s triangle is larger and thus
can display more colors than sRGB.
sRGB, AdobeRGB
sRGB, AdobeRGB
Wikipedia Creative Commons Attribution-Share Alike 3.0 Mbearnstein37
Wikimedia Commons
129128 MK350 Series Survival Handbook
Applicaons
Applicaons
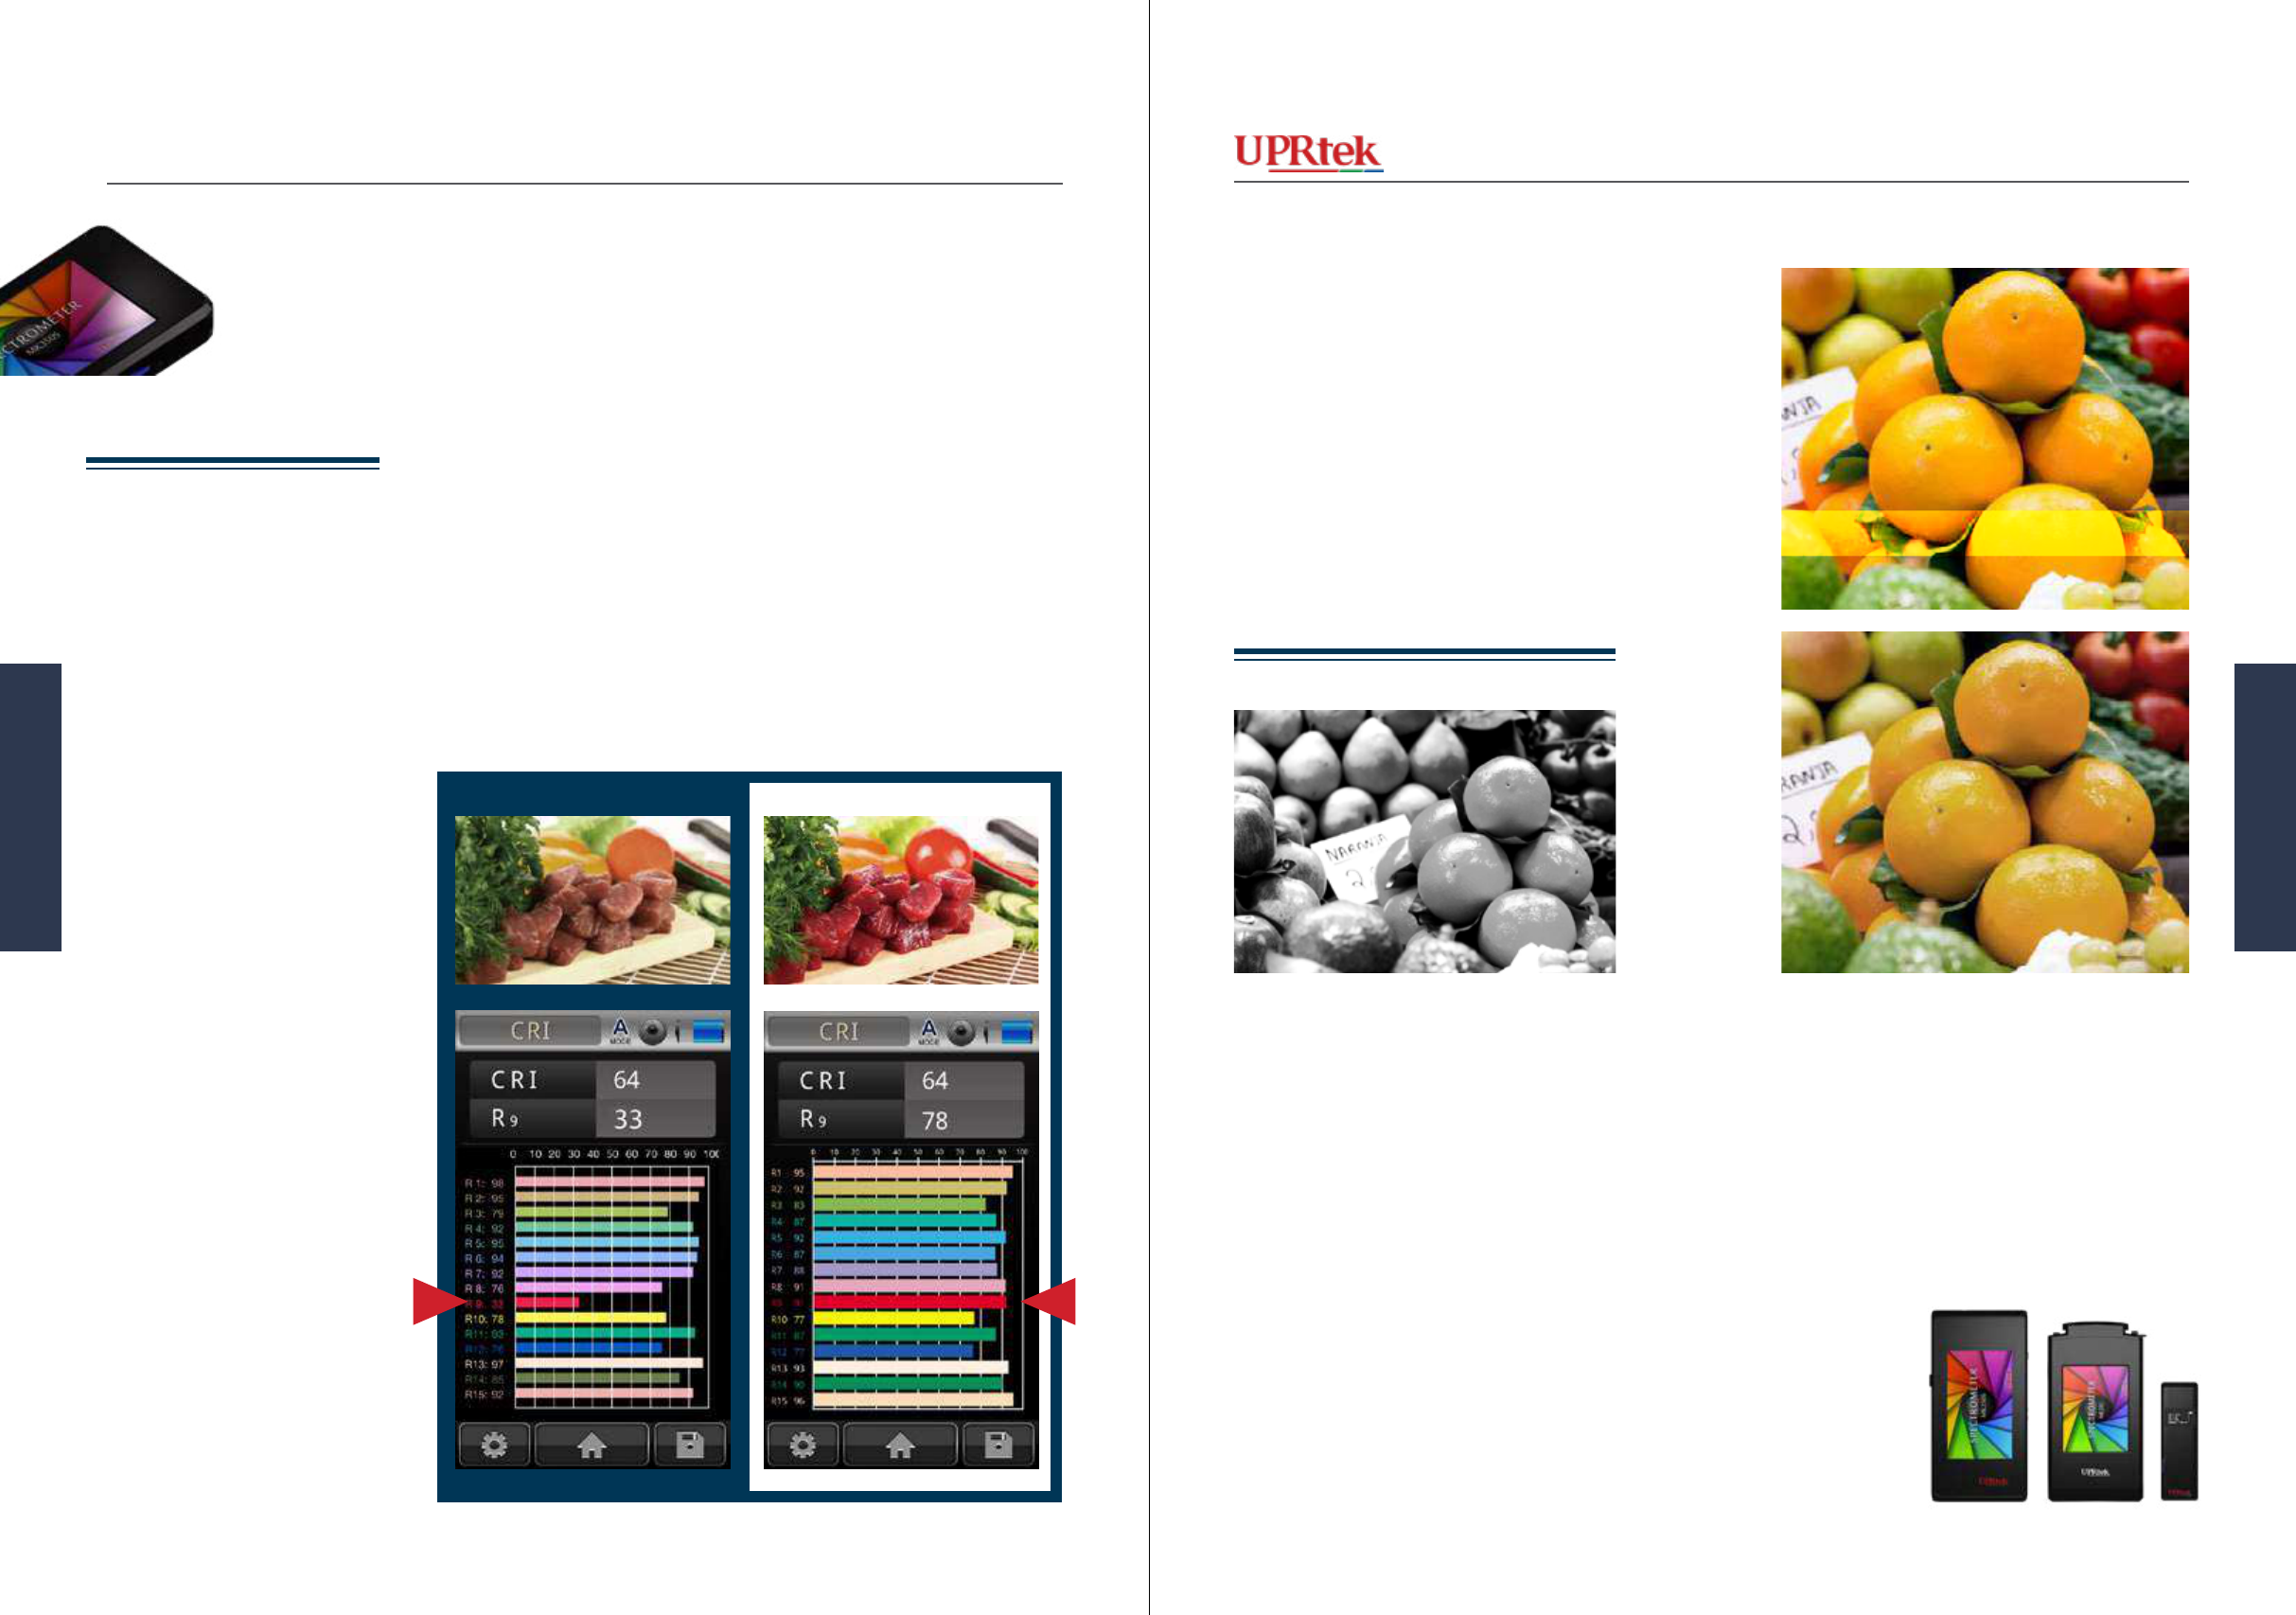
Watch a Video
Version 20140410b - Not for distribution - © Copyright 2014 UPRtek All rights reserved
Versio 20140410b - Not for distribution - © Copyright 2014 UPRtek All rights reserved
CRI (color rendering index) or
the ability of a light to proper-
ly render colors, such as reds,
greens, and blues, is important
in store display design, especial-
ly when using LEDs and Flu-
orescents. The sun is the gold
standard for CRI because it has
a full, even spectrum of colors
and gives us the vivid colors that
our eyes are used to seeing - so
a CRI value of 100 represents
the Sun and any thing less is a
measure of how close it comes
to the Sun.
The CRI values are 15 color
ranges, R
1
-R
15
- each range tells
us how much of each color is
coming from the light source.
There is a general “CRI” value
itself and it averages R
1
-R
8
- but
if your “CRI” value is 100, it
could be misleading if your are
looking at red, as in fresh meat.
To measure the value of reds in
your light you should really look
at R
9
. As you see from the two
pictures (right) a higher R
9
value
renders the red meat more red.
http://www.youtube.com/watch?v=tfK_FF-4aDI
Which oranges
would you buy?
To really see startling differences in store
display and CRI, see the video below at
about the 25 minute 16 second mark.
Note that the Basic and
Compact versions do not
have the CRI bar chart but
can show the “CRI” value
(r1-r8).
Note that CRI for Incandescent lights are
most likely to show favorable CRI (over
90) because, like the Sun, it is a Black
Body Radiator and displays a similar
spectrum of colors.
Importance of
CRI
Lighting
Store Display
Lighting Store Display
Arcial Lighng
131130
Arcial Lighng
MK350 Series Survival Handbook
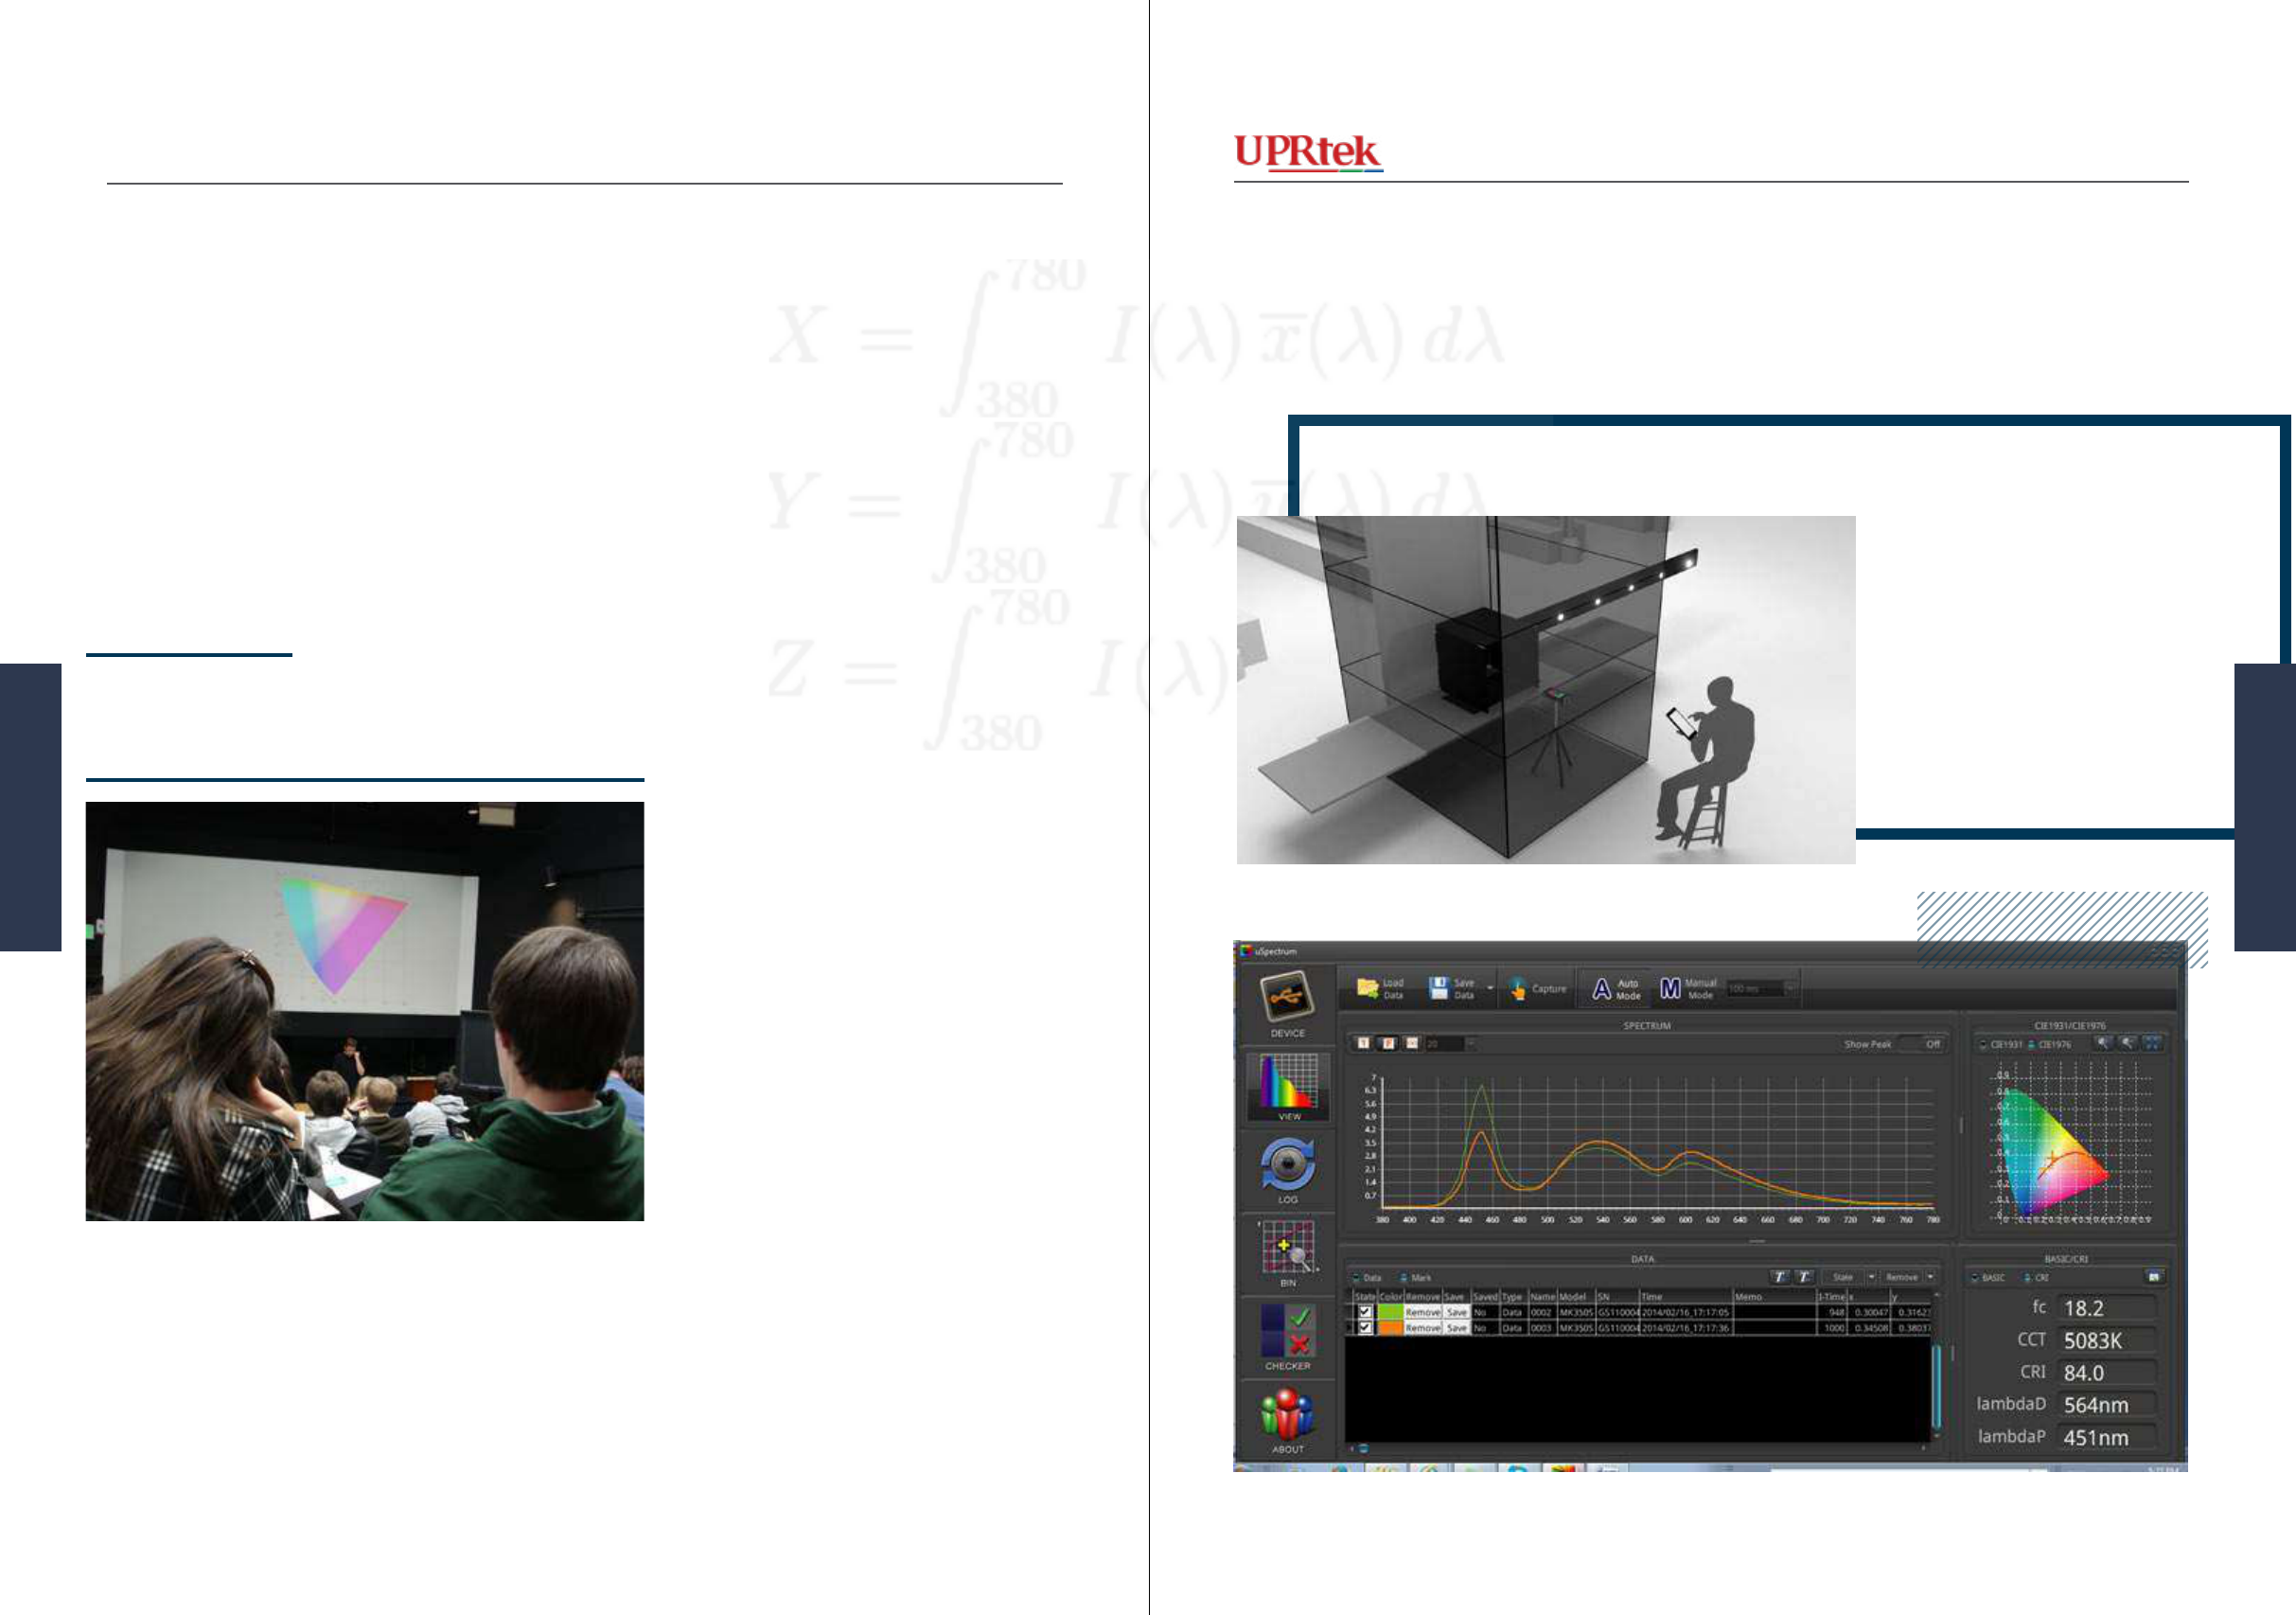
Version 20140410b - Not for distribution - © Copyright 2014 UPRtek All rights reserved
Versio 20140410b - Not for distribution - © Copyright 2014 UPRtek All rights reserved
Lighting
Academics & Research
MK350 is being used at Universities and Colleges as an in-
dispensible teaching tool, for understanding Light, Color
and Physics. Understanding light physics is about complex
mathematical functions and computations and the MK350 al-
lows teachers to train and test students by comparing student
computations with MK350 results. Thesis projects also take
advantage of MK350 uSpectrum software and software devel-
oper’s kit (SDK) for research.
MK350’s ability to capture, re-
cord and compare data is one
of the great advantages for re-
searchers gathering information
for thesis projects. Wireless fa-
cilities and software developer
kits make the MK350 a versatile
option for assorted testing envi-
ronments.
uSpectrum PC software and SDK (Systems Developer’s Kit)
Lighting Academics & Research
Arcial Lighng
133132
Arcial Lighng
MK350 Series Survival Handbook
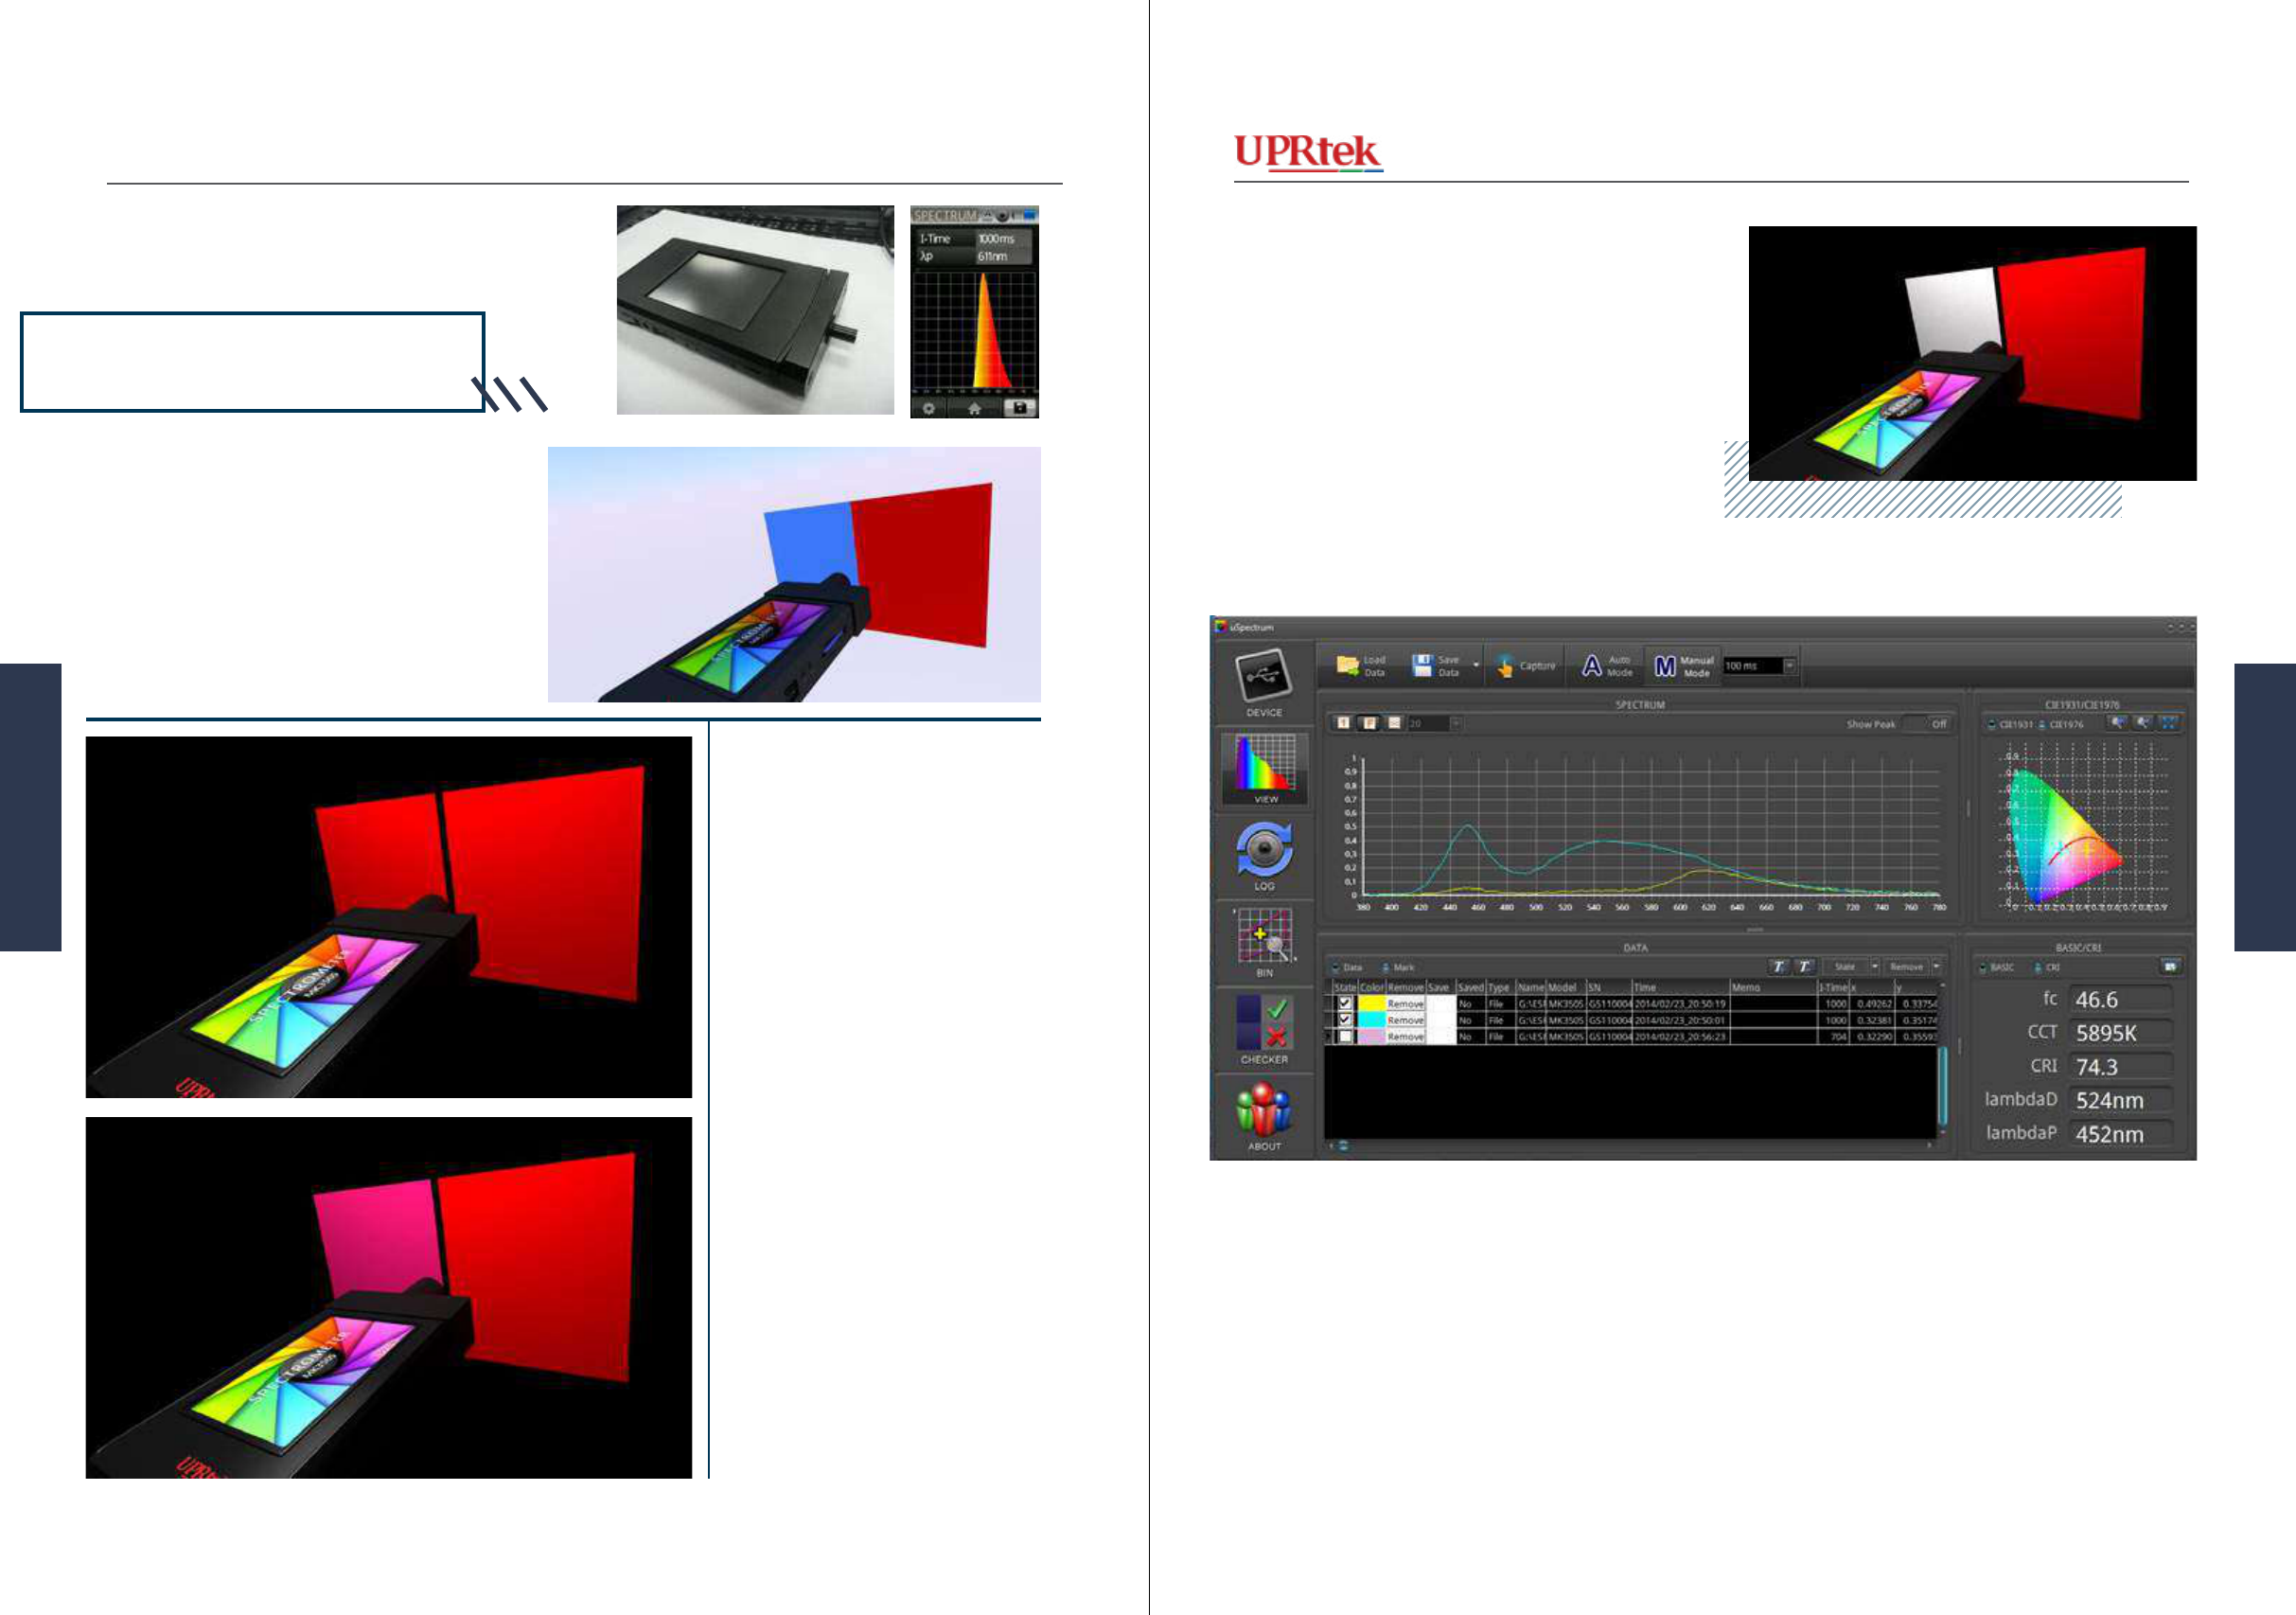
Version 20140410b - Not for distribution - © Copyright 2014 UPRtek All rights reserved
Versio 20140410b - Not for distribution - © Copyright 2014 UPRtek All rights reserved
MK350 is also being researched as a viable tool
for measuring surface colors (as opposed to
only light source). This has many ramications
in the market for standardizing and validating
color matches for printed material, fabric color,
component color uniformity, logo color compli-
ance. This also has ramications for studying
Metamerism.
Current Research
Measuring Surface Colors
When comparing two color patch-
es under one light source, the col-
ors may match - but when you try
it with another light source, they
fail to match. This is an optical
phenomena called metamerism. A
more practical example is where
you pick out a shirt and pants in
a department store because they
have matching colors - but when
you wear it outside under daylight,
the colors do not match anymore.
The MK350 may be able to ana-
lyze this phenomena and come
to understand how light spectrum
and surface reectivity cause these
problems.
Under light source 1
Under light source 2
Measuring surface color varies
widely with the source light. Ac-
ademic Research is under way to
determine if using spectrums from
standard white baseline juxta-
posed againt a color patch can be
mathematically combined to come
up with a standardized color, in
spite of the type of light source.
Metamerism
Research - Measuring Surface Colors
The above color spectrum captured a white baseline swatch (blue line) and a red test swatch (yellow line)
under an LED light using a test lens tunnel accessory (see next page).
Information is courtesy of Professor MeiJun Lo of
the Shih Hsin University (Taiwan)
Source Light A
Source Light B
Arcial Lighng
135134
Arcial Lighng
MK350 Series Survival Handbook
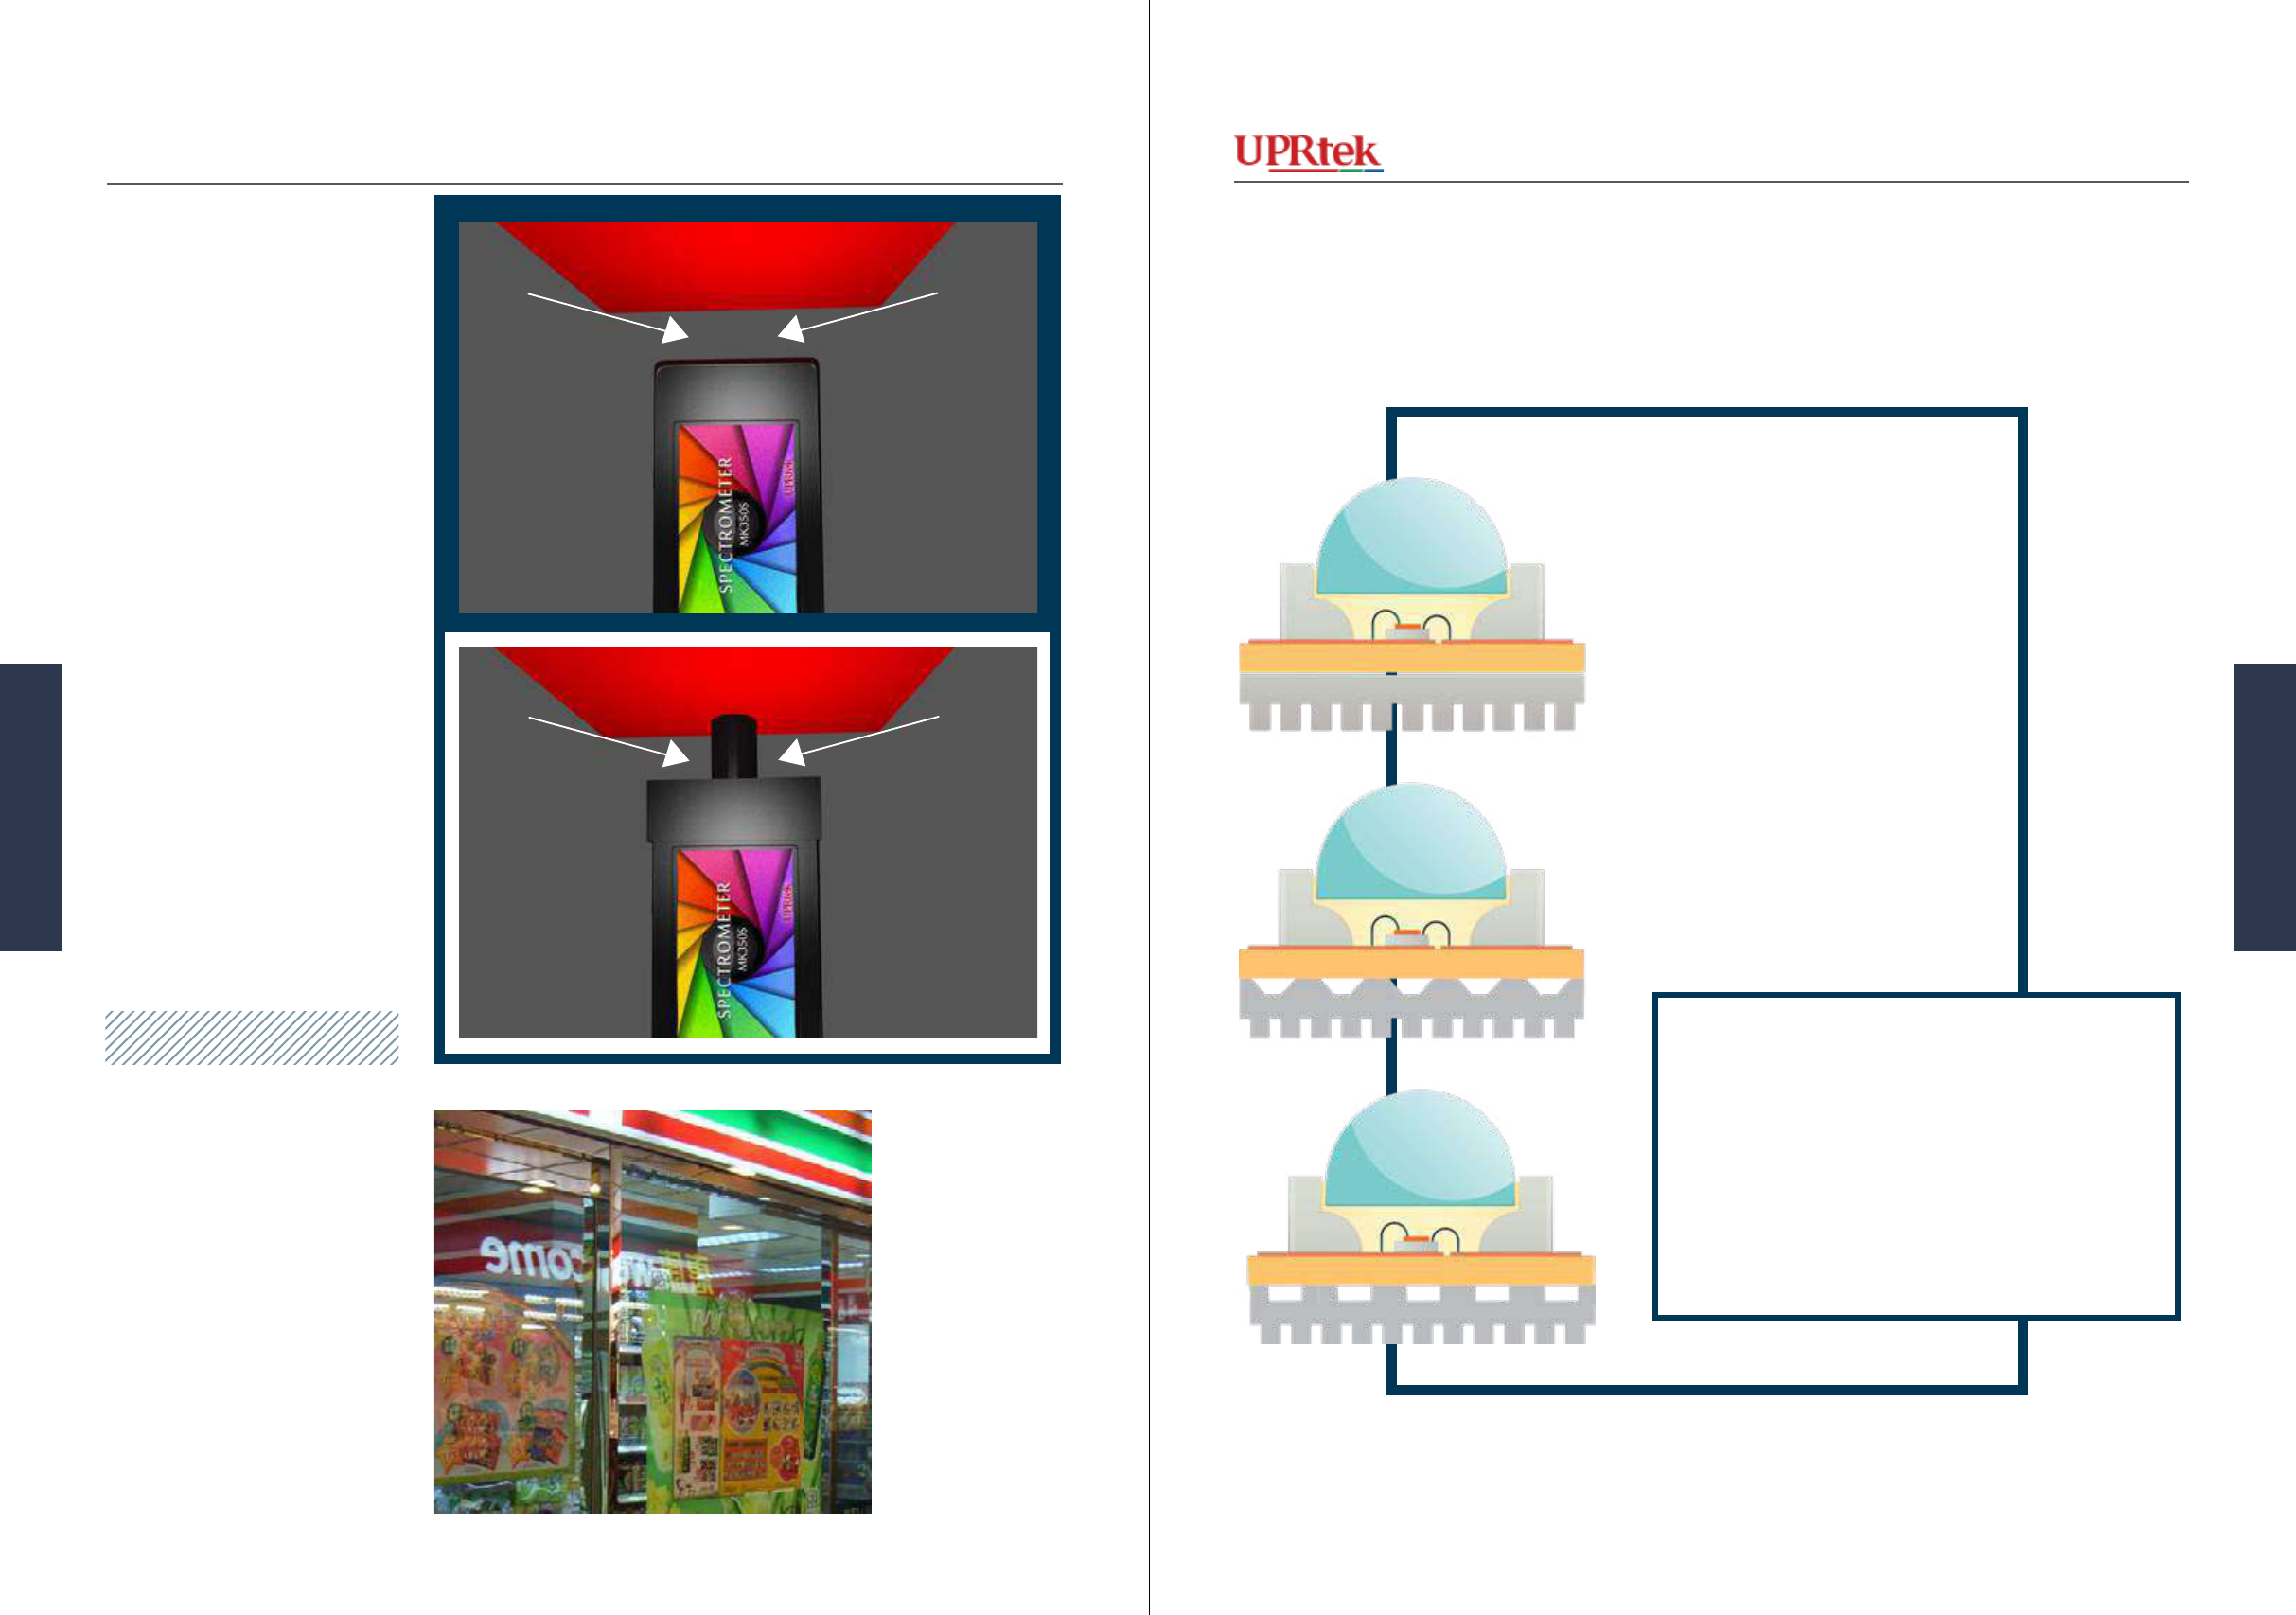
Version 20140410b - Not for distribution - © Copyright 2014 UPRtek All rights reserved
Versio 20140410b - Not for distribution - © Copyright 2014 UPRtek All rights reserved
University researchers have already con-
ducted experiments using the MK350 to
uncover optimal designs for LED heat
sinks to minimize LED light and color
degradation over time.
Heat Sink Design Research
University Professors and Lighting Design-
ers write books about lighting both from a
design perspective and teaching perspective.
The MK350 is a cost-effective, easy-to-use
alternative to otherwise expensive, bulky
equipment that must be borrowed or rented.
Publish or Perish
Performance of Light Emitting Diode on Surface Machined Heat Sink
S. Shanmugan*, D. Mutharasu, O. Zeng Yin
Nano Optoelectronics Research Laboratory, School of Physics, Universiti Sains Malaysia (USM),11800,
Minden, Pulau Penang, Malaysia
Measuring colors on a sur-
face with an MK350 device as
shown (right) will let too much
peripheral light in. Because the
MK350 performs Cosine Cor-
rection your results will show a
spectrum closer to the dominant
light source. Trying to block out
the peripheral light by pressing
the lens up against the surface
will block out all light and will
only produce results for black.
UPRtek is currently research-
ing accessory devices as shown
right to block out peripheral light
while capturing only the surface
area in front. However, even
with this procedure, you are still
at the mercy of the source light
colors.
Peripheral light obscures
surface measurements
Accessory lens tunnel
blocks peripheral light.
LED Heat Sink Research
Research Publishing
Being able to measure surface
colors will help companies
monitor their brand colors, es-
pecially in the outdoors, where
sunlight is apt to oxidize paints/
inks and fade colors over time.
Many companies are especial-
ly cognizant of displaying true
brand colors and will be quick
to replace them when color deg-
radation falls below standards.
Arcial Lighng
137136
Arcial Lighng
MK350 Series Survival Handbook
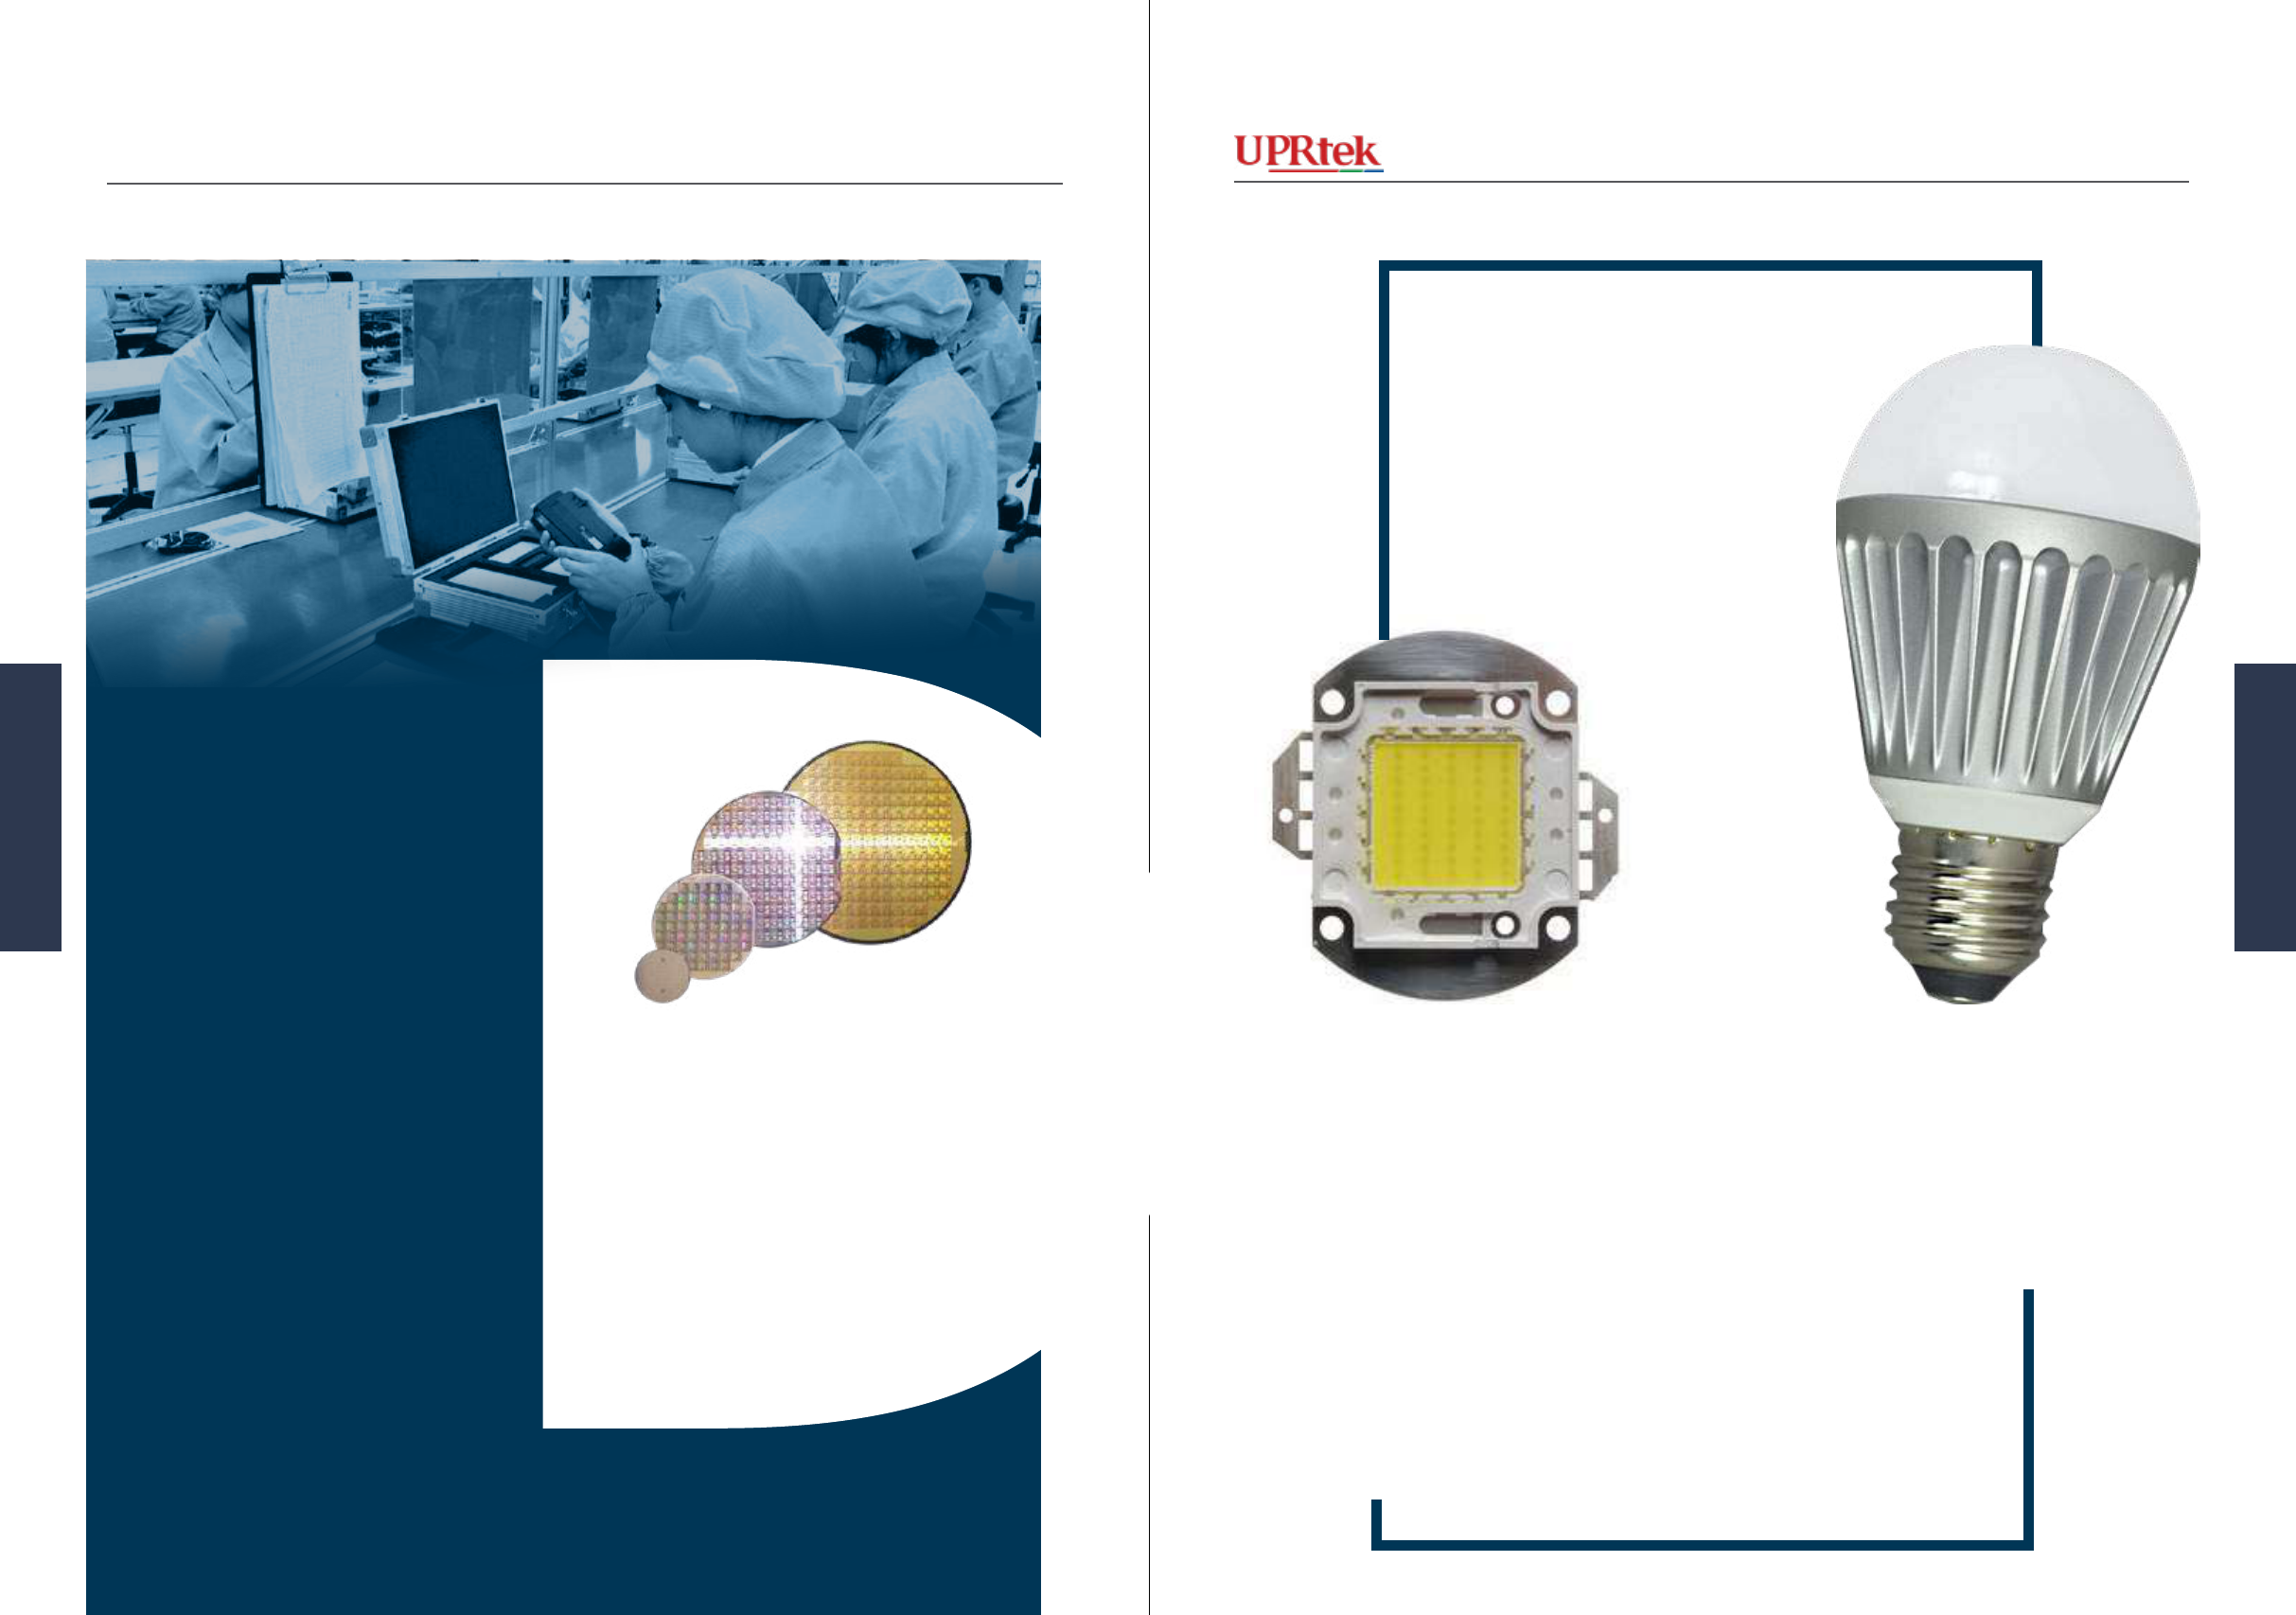
Version 20140410b - Not for distribution - © Copyright 2014 UPRtek All rights reserved
Versio 20140410b - Not for distribution - © Copyright 2014 UPRtek All rights reserved
Manufacturing
Professionals
LED manufacturing professionals are
people working in the three basic types
of LED manufacturing companies.
The LED Chip Manufacturer produces
semiconductor chips that come on wafers.
This is an important process of mixing al-
loys and impurities (doping) to produce
the nal wafer product.
www.youtube.com/watch?v=AMgQ1-
HdElM (www.microchemicals.eu)
The nal process is done by LED Bulb
Manufacturers. This includes applying
the housing, power supply, driver and any
other remaining wiring and componentry
needed to nalize the bulb or luminaire for
delivery to the end customer.
www.youtube.com/watch?v=ltqO3O8MMws
(ChromaAutomation)
www.youtube.com/watch?v=SoCfcETd72Q
(Formetcolnc)
The LED Assembly Manufacturer re-
ceives wafers, and using mostly robotics,
apply the appropriate circuitry (wiring)
and cut the wafer into chips. These chips
are tested for color and light properties
(robotically) and at this point are classi-
ed and physically separated into bins.
Then chips from one bin are mounted on
a circuit board. Fluorescent lm is also
added. After further preparation, they are
cut into individual circuit boards.
LE
LED Professionals
Wikipedia Creative Commons Attribution-Share Alike 3.0
Wikimedia Commons
Arcial Lighng
139138
Arcial Lighng
MK350 Series Survival Handbook
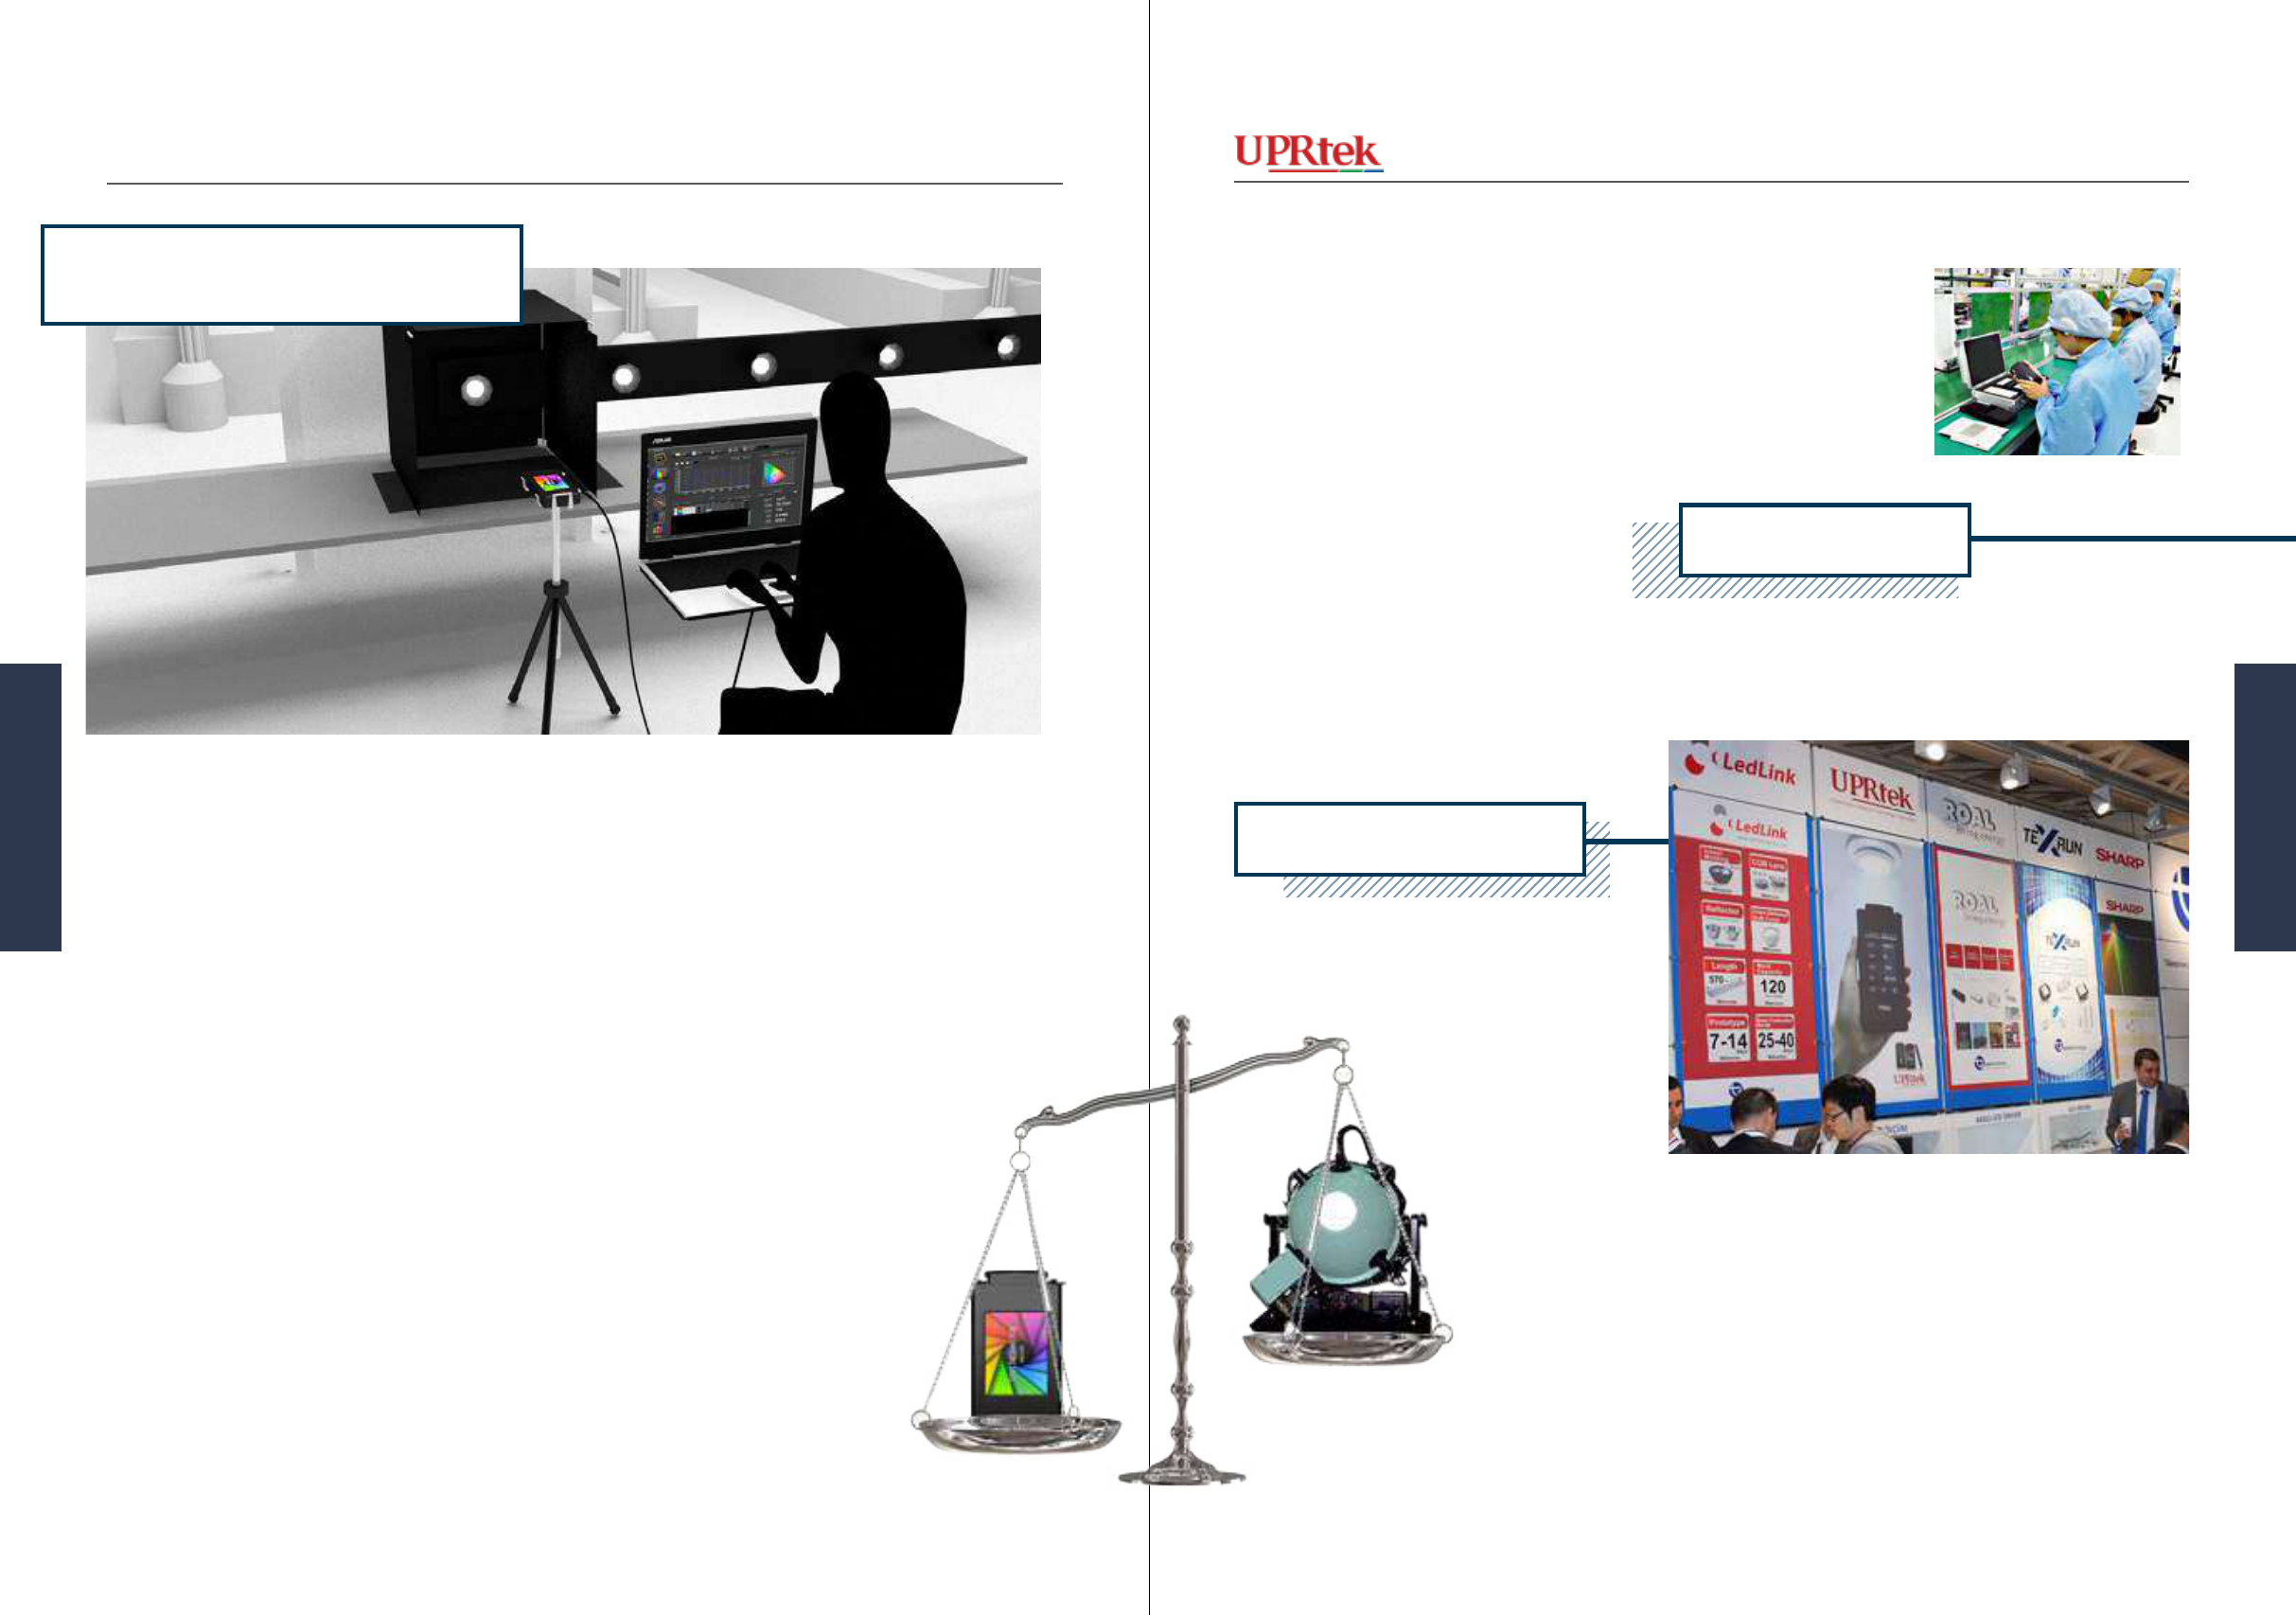
Version 20140410b - Not for distribution - © Copyright 2014 UPRtek All rights reserved
Versio 20140410b - Not for distribution - © Copyright 2014 UPRtek All rights reserved
Even though the assembly lines
in all 3 types of LED manufac-
turing companies are equipped
with robotic facilities for mea-
suring light properties, there
remains many ancillary applica-
tions where the portable MK350
devices remain an indispensable
industry tool.
Research and Development in
all three types of companies
are using the MK350 in their
test labs. Experimentation is a
laborious, time consuming pro-
cess taken up by collecting data,
testing, comparing, and analyz-
ing. Though these companies
have sophisticated equipment
(e.g. integrating spheres), the
workow for this type of pre-
liminary research work is best
All LED Bulb Companies create deep channels in the LED
market through distributors, agents, wholesale and retail
stores, all of whom need to compare and evaluate LED
light and color quality as never before. Even end-users
such as factories, libraries, museums, department stores
will become more savvy about LEDs and agents must be
prepared to validate LED quality offsite with a reliable,
precision meter. These same meters are also proving in-
valuable at lighting exhibitions, allowing buyers to evalu-
ate while sellers validate.
Practicality vs. Precision
There are hundreds of thousands of LED components rolling off of as-
sembly lines every minute and it is impossible to provide 100% quali-
ty-control for every single item. However, at certain points in the SOP, it
is prudent to sample items periodically to ensure that processes upstream
are performing as expected. This type of spot checking is easily and read-
ily performed by the MK350. In addition, data can be easily logged for
purposes of reporting and evaluating defect rates.
served by the compact, portable
MK350. It is said that margin in
precision between a sphere and
an MK350 is far outweighed by
the immense practicality of the
MK350.
The MK350 works with the uS-
pectrum PC software and that
ultimately is the key to this type
of work, providing full screen
PC connectivity, with data log-
ging, multiple item compari-
son, sorting and annotation - in
addition, UPRtek provides dll
libraries allowing companies to
develop their own software to
match their own testing facilities
- some companies are even mak-
ing customized MK350 ttings
to semi-automate testing using
MK350 auto-logging facilities.
Quality Control
Research and Development
Lighting Exhibitions
Research and Development
Quality Control
Light Exhibitions
Arcial Lighng
141140
Arcial Lighng
MK350 Series Survival Handbook
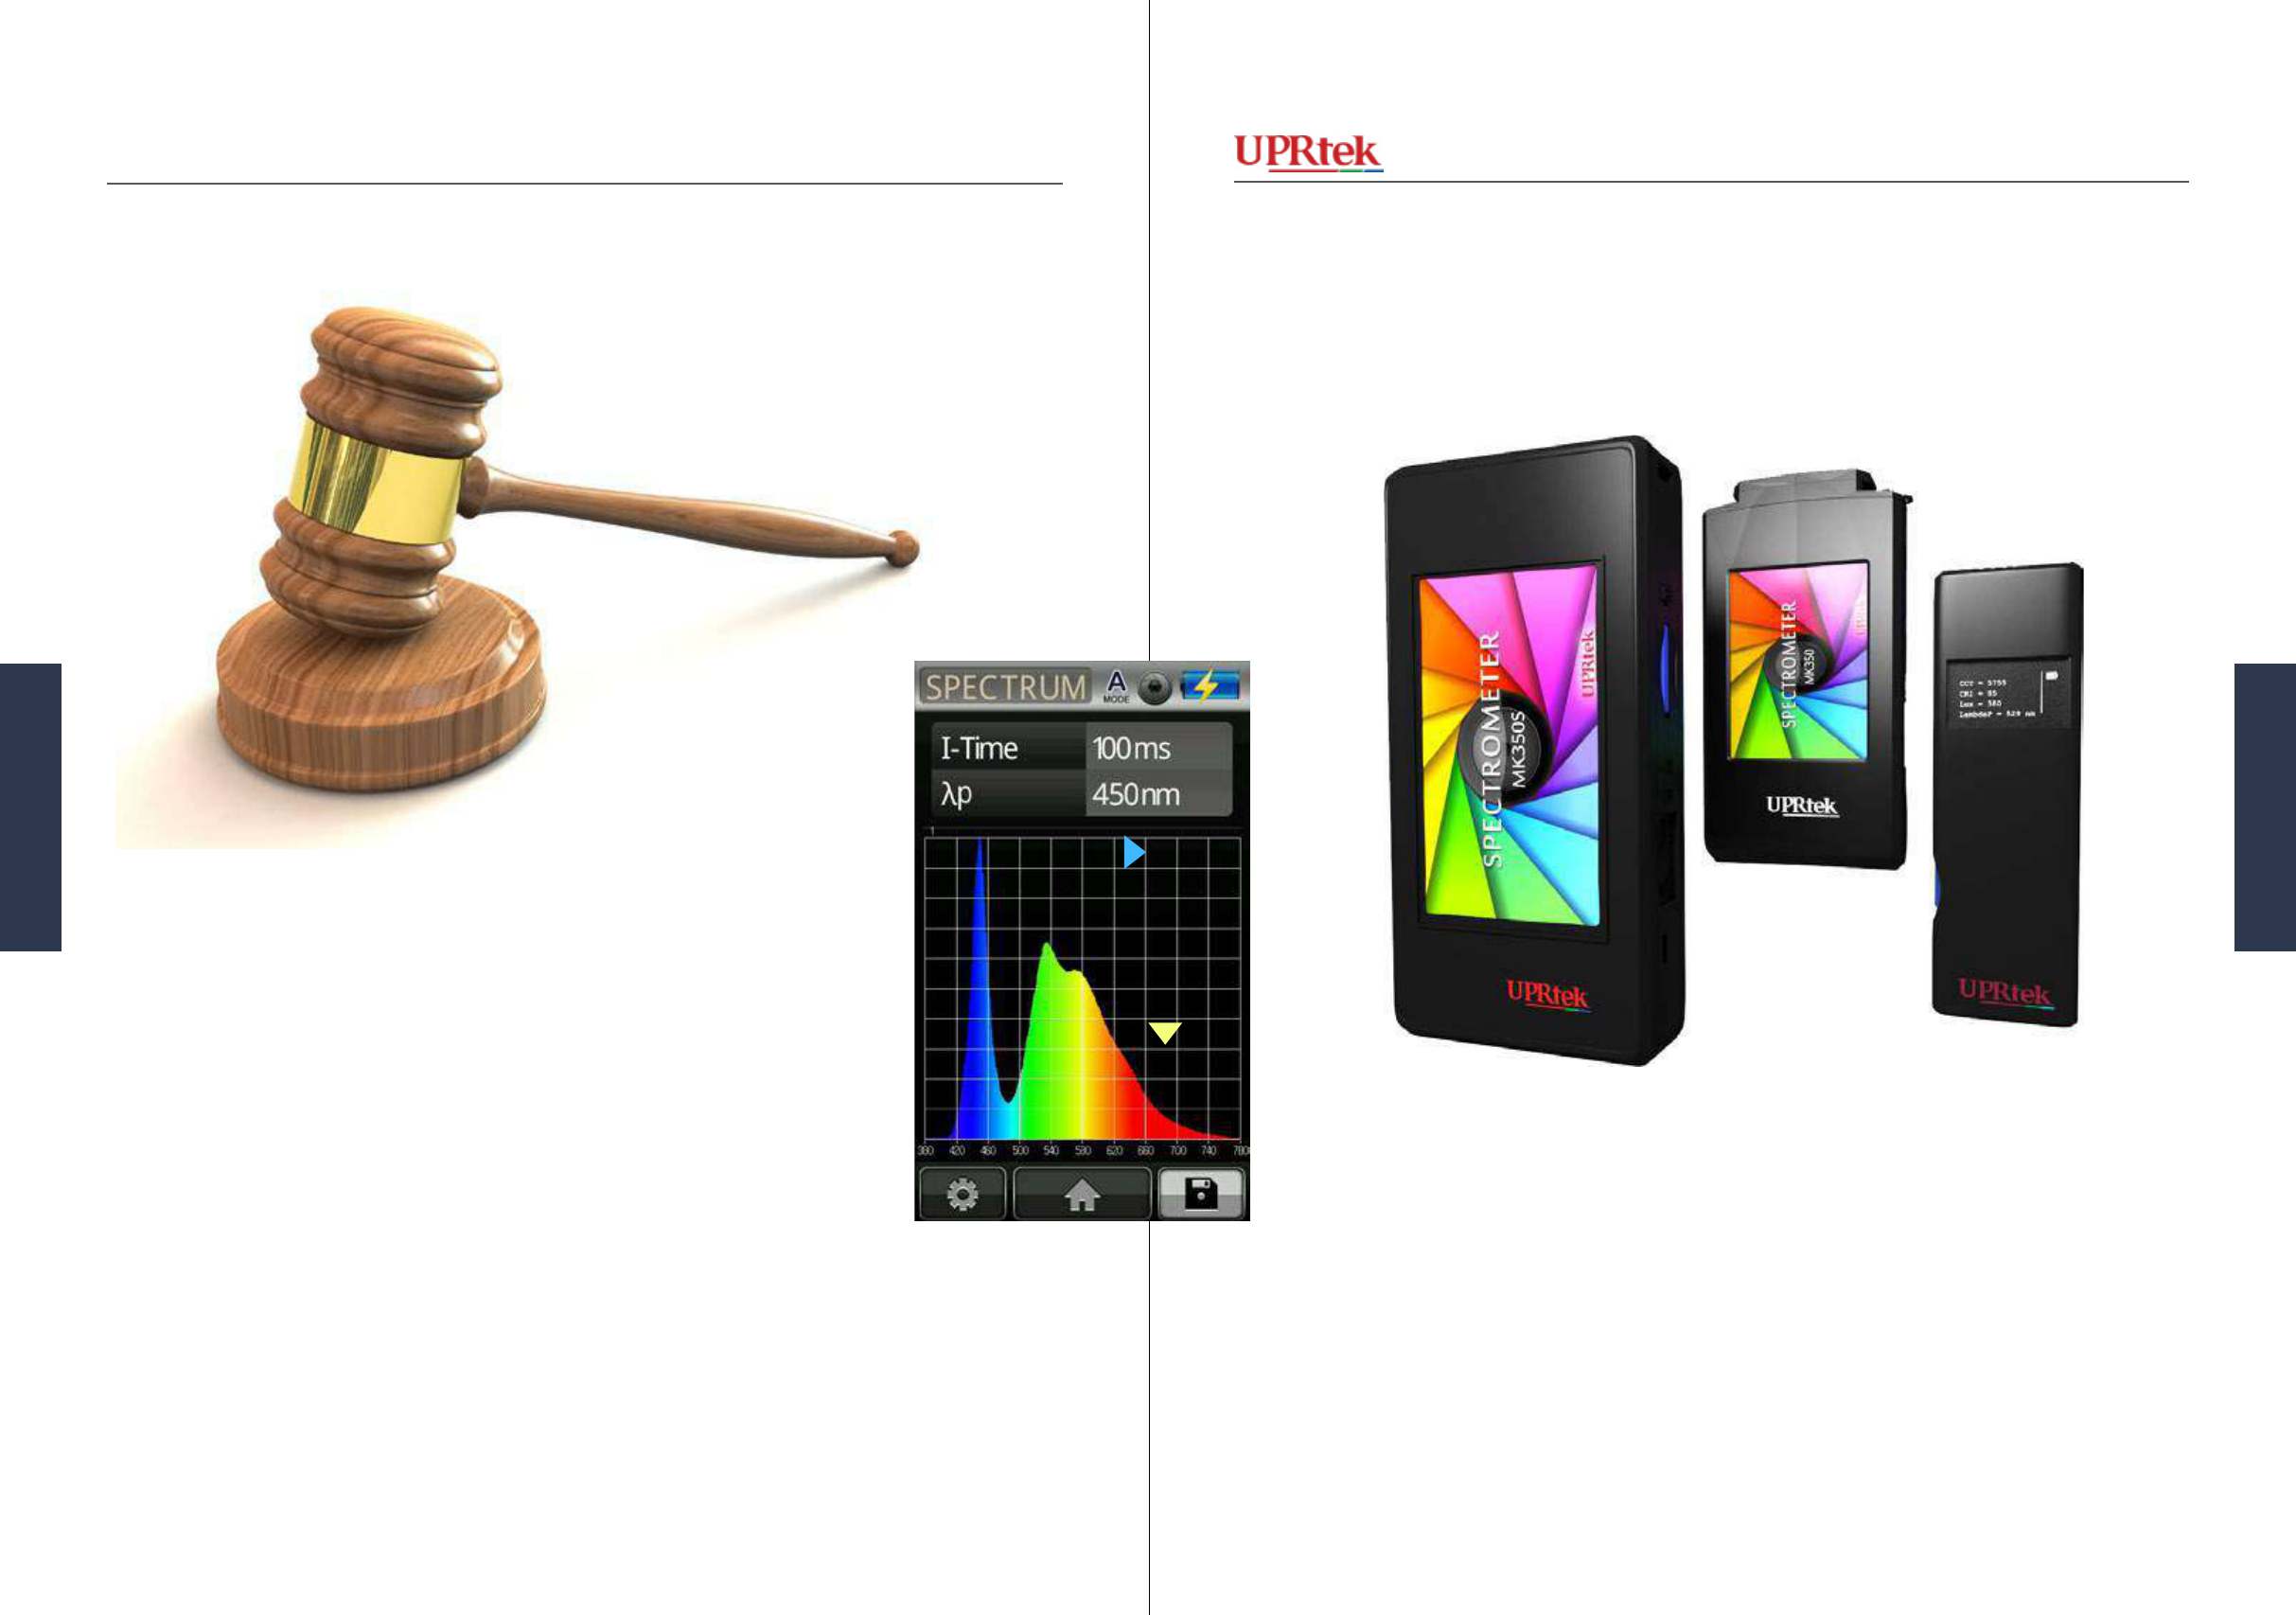
Version 20140410b - Not for distribution - © Copyright 2014 UPRtek All rights reserved
Versio 20140410b - Not for distribution - © Copyright 2014 UPRtek All rights reserved
The Judge
The big three manufacturing arms of the LED industry are not without
occasional disagreements. The MK350 series is often used to settle dif-
ferences in light quality between companies. In one case, an LED bulb
maker used the MK350 color spectrum to reveal a aw in the Blue peak,
showing abnormal double horns, settling a dispute between semiconduc-
tor company and the assembly company.
Blue Shift
Yellow Shift
Chris Potter - CC-BY-2.0-Generic
Arcial Lighng
143142
Arcial Lighng
MK350 Series Survival Handbook
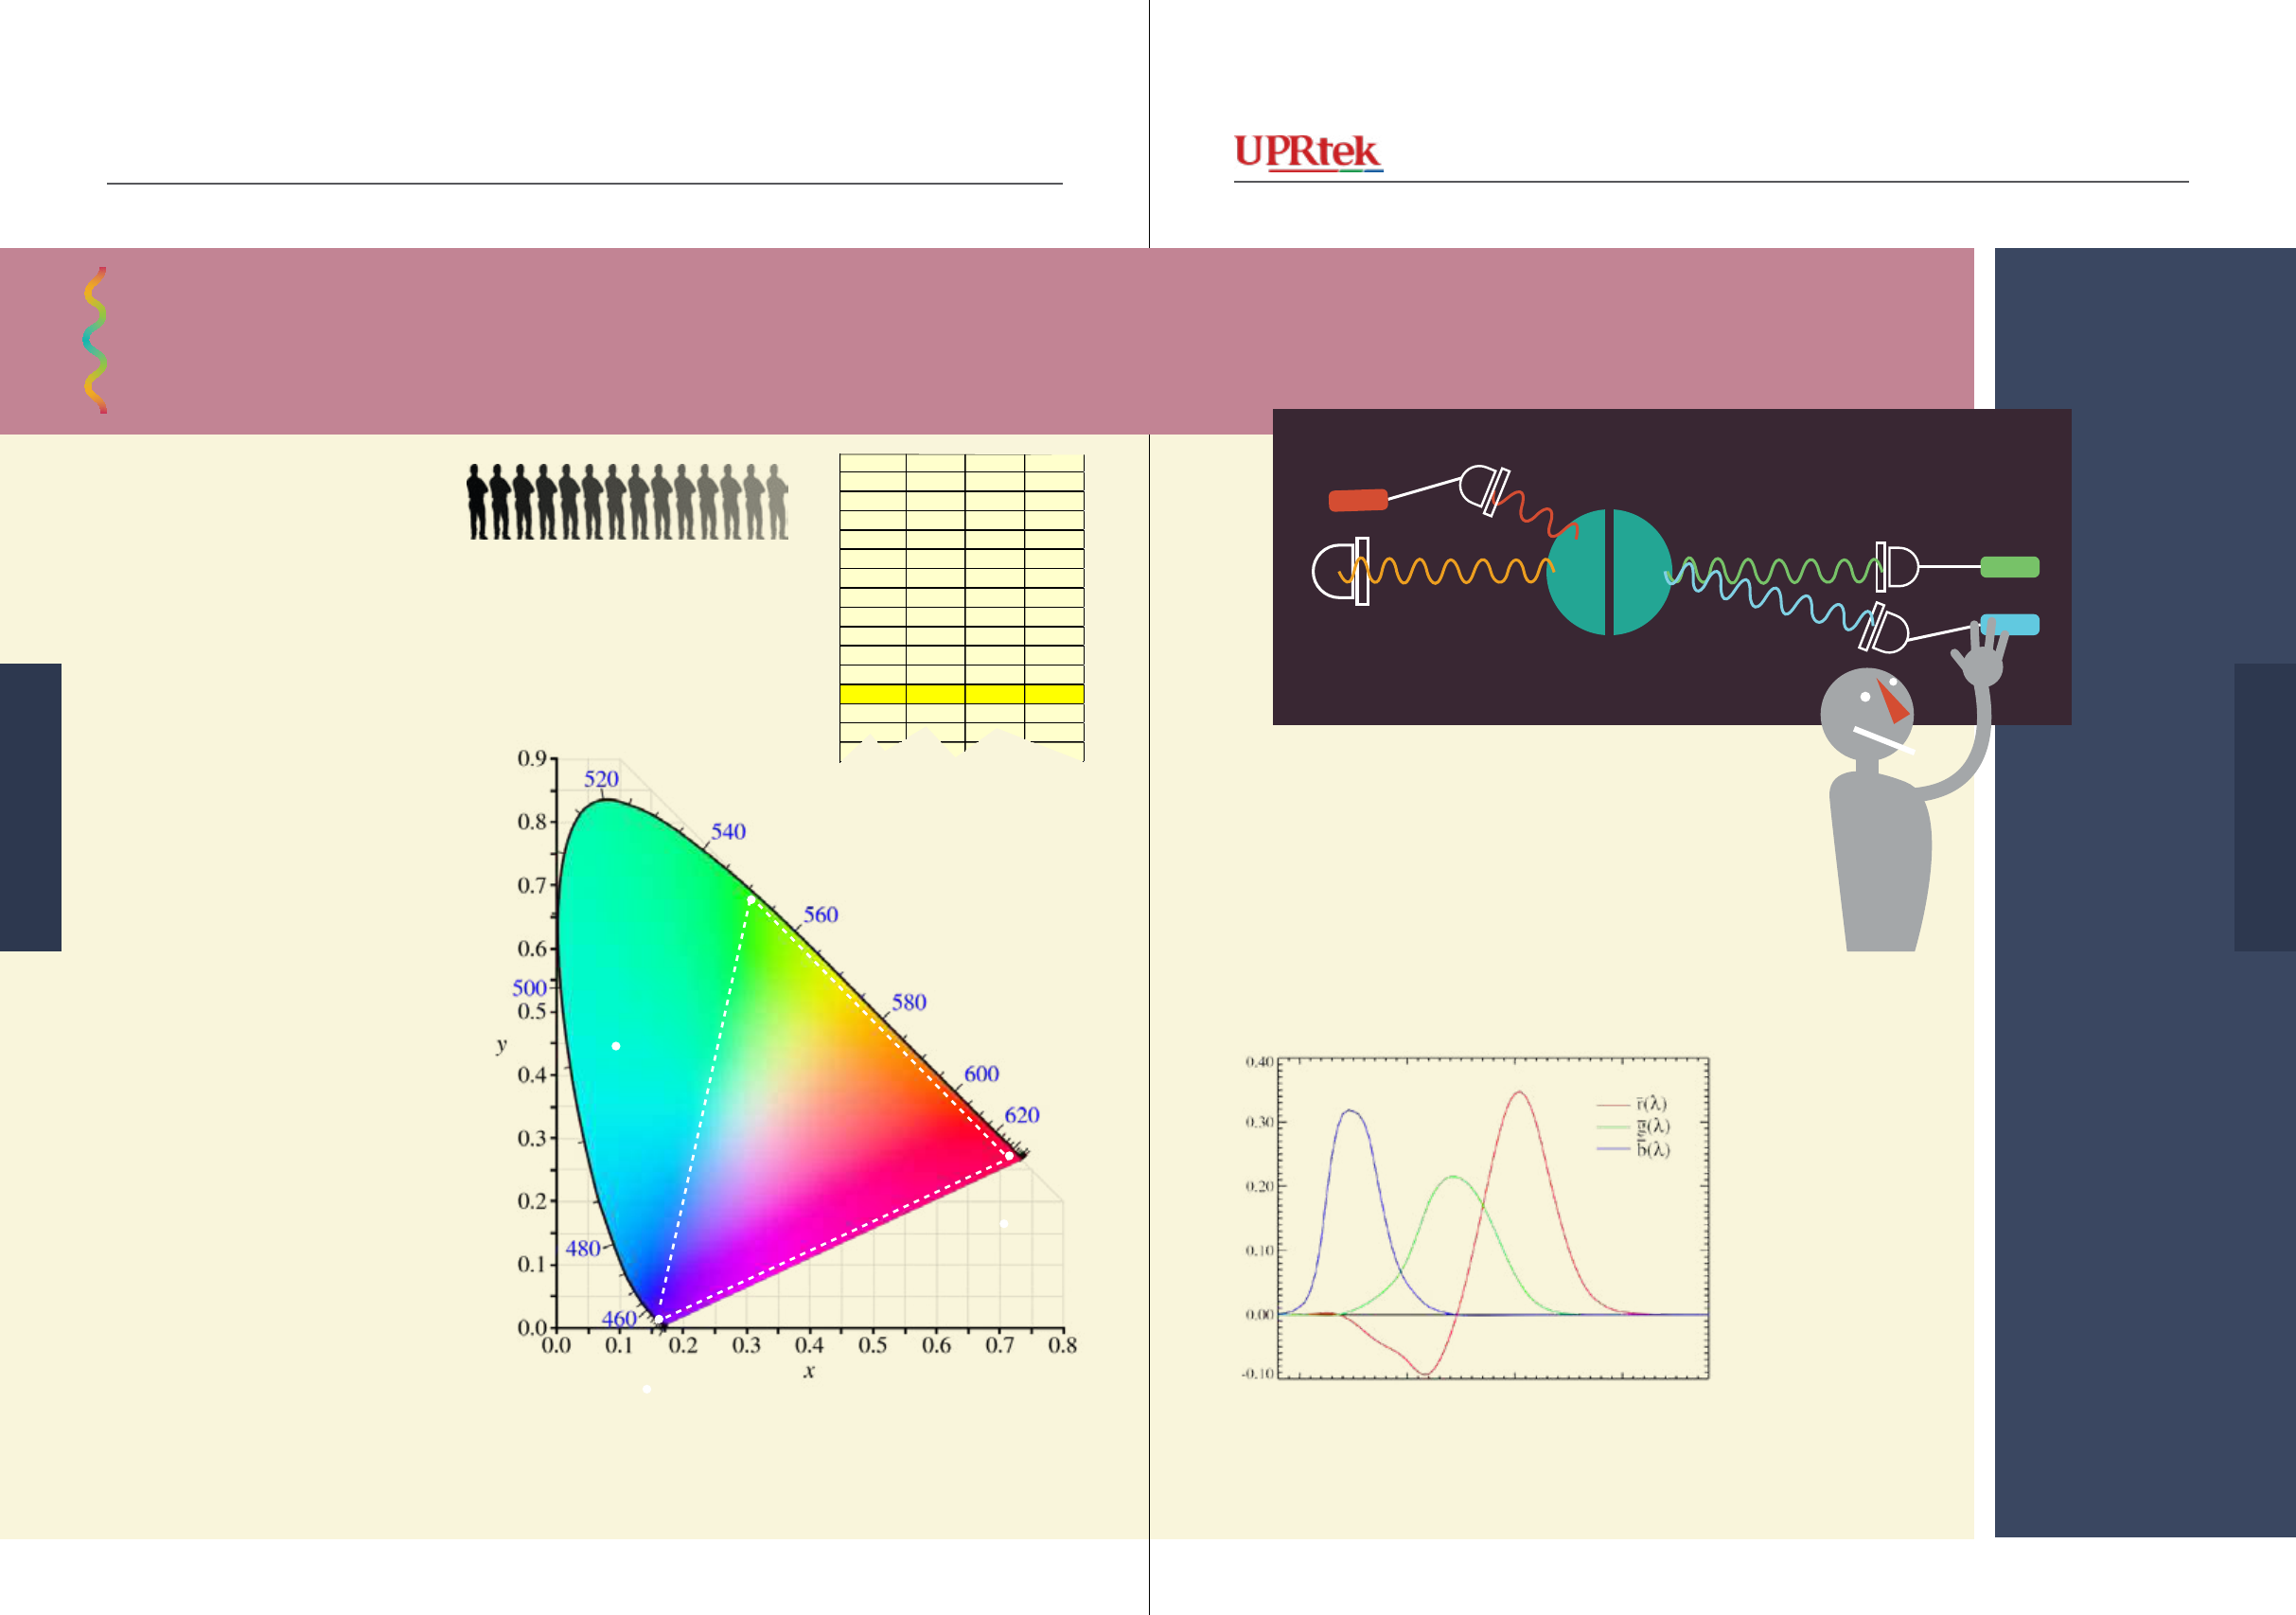
r g b
λ
380 0.0272 -0.0115 0.9843
385 0.0268 -0.0114 0.9846
390 0.0263 -0.0114 0.9851
395 0.0256 -0.0113 0.9857
400 0.0247 -0.0112 0.9865
405 0.0237 -0.0111 0.9874
410 0.0225 -0.0109 0.9884
415 0.0207 -0.0104 0.9897
420 0.0181 -0.0094 0.9913
425 0.0142 -0.0076 0.9934
430 0.0088 -0.0048 0.9960
435 0.0012 -0.0007 0.9995
440 -0.0084 0.0048 1.0036
445 -0.0213 0.0120 1.0093
450 -0.0390 0.0218 1.0172
Version 20140410b - Not for distribution - © Copyright 2014 UPRtek All rights reserved
Versio 20140410b - Not for distribution - © Copyright 2014 UPRtek All rights reserved
As convenient as a model RGB seems
to be, alas, it’s not perfect - RGB CAN-
NOT reproduce all the colors we can
see. Draw a triangle from our 3 pure
colors of Red Blue and Green and you
can see this - the area within the triangle
are really all the colors RGB can simu-
late, which is obviously not all the col-
ors we can see. There is a large area in
the blue-green that humans can see but
are not contained in the triangle. Why?
This is because the RGB additive model
is not perfectly aligned with how we see
colors.
Red
Blue
Green
x,y
Appendix 1 - CIE 1931 In- depth
Appendix 1 - CIE 1931 in-depth
100%
100%
0%
R 700nm
G 546.1nm
B 435.8nm
To account for the inadequacies of RGB, the experimenters
added red light to the “test” color. If you plot the original
experimental data, you get the 2D graph below-left with
negative red values.
Troublesome negave values for the Red
Arcial Lighng
145144
Arcial Lighng
MK350 Series Survival Handbook
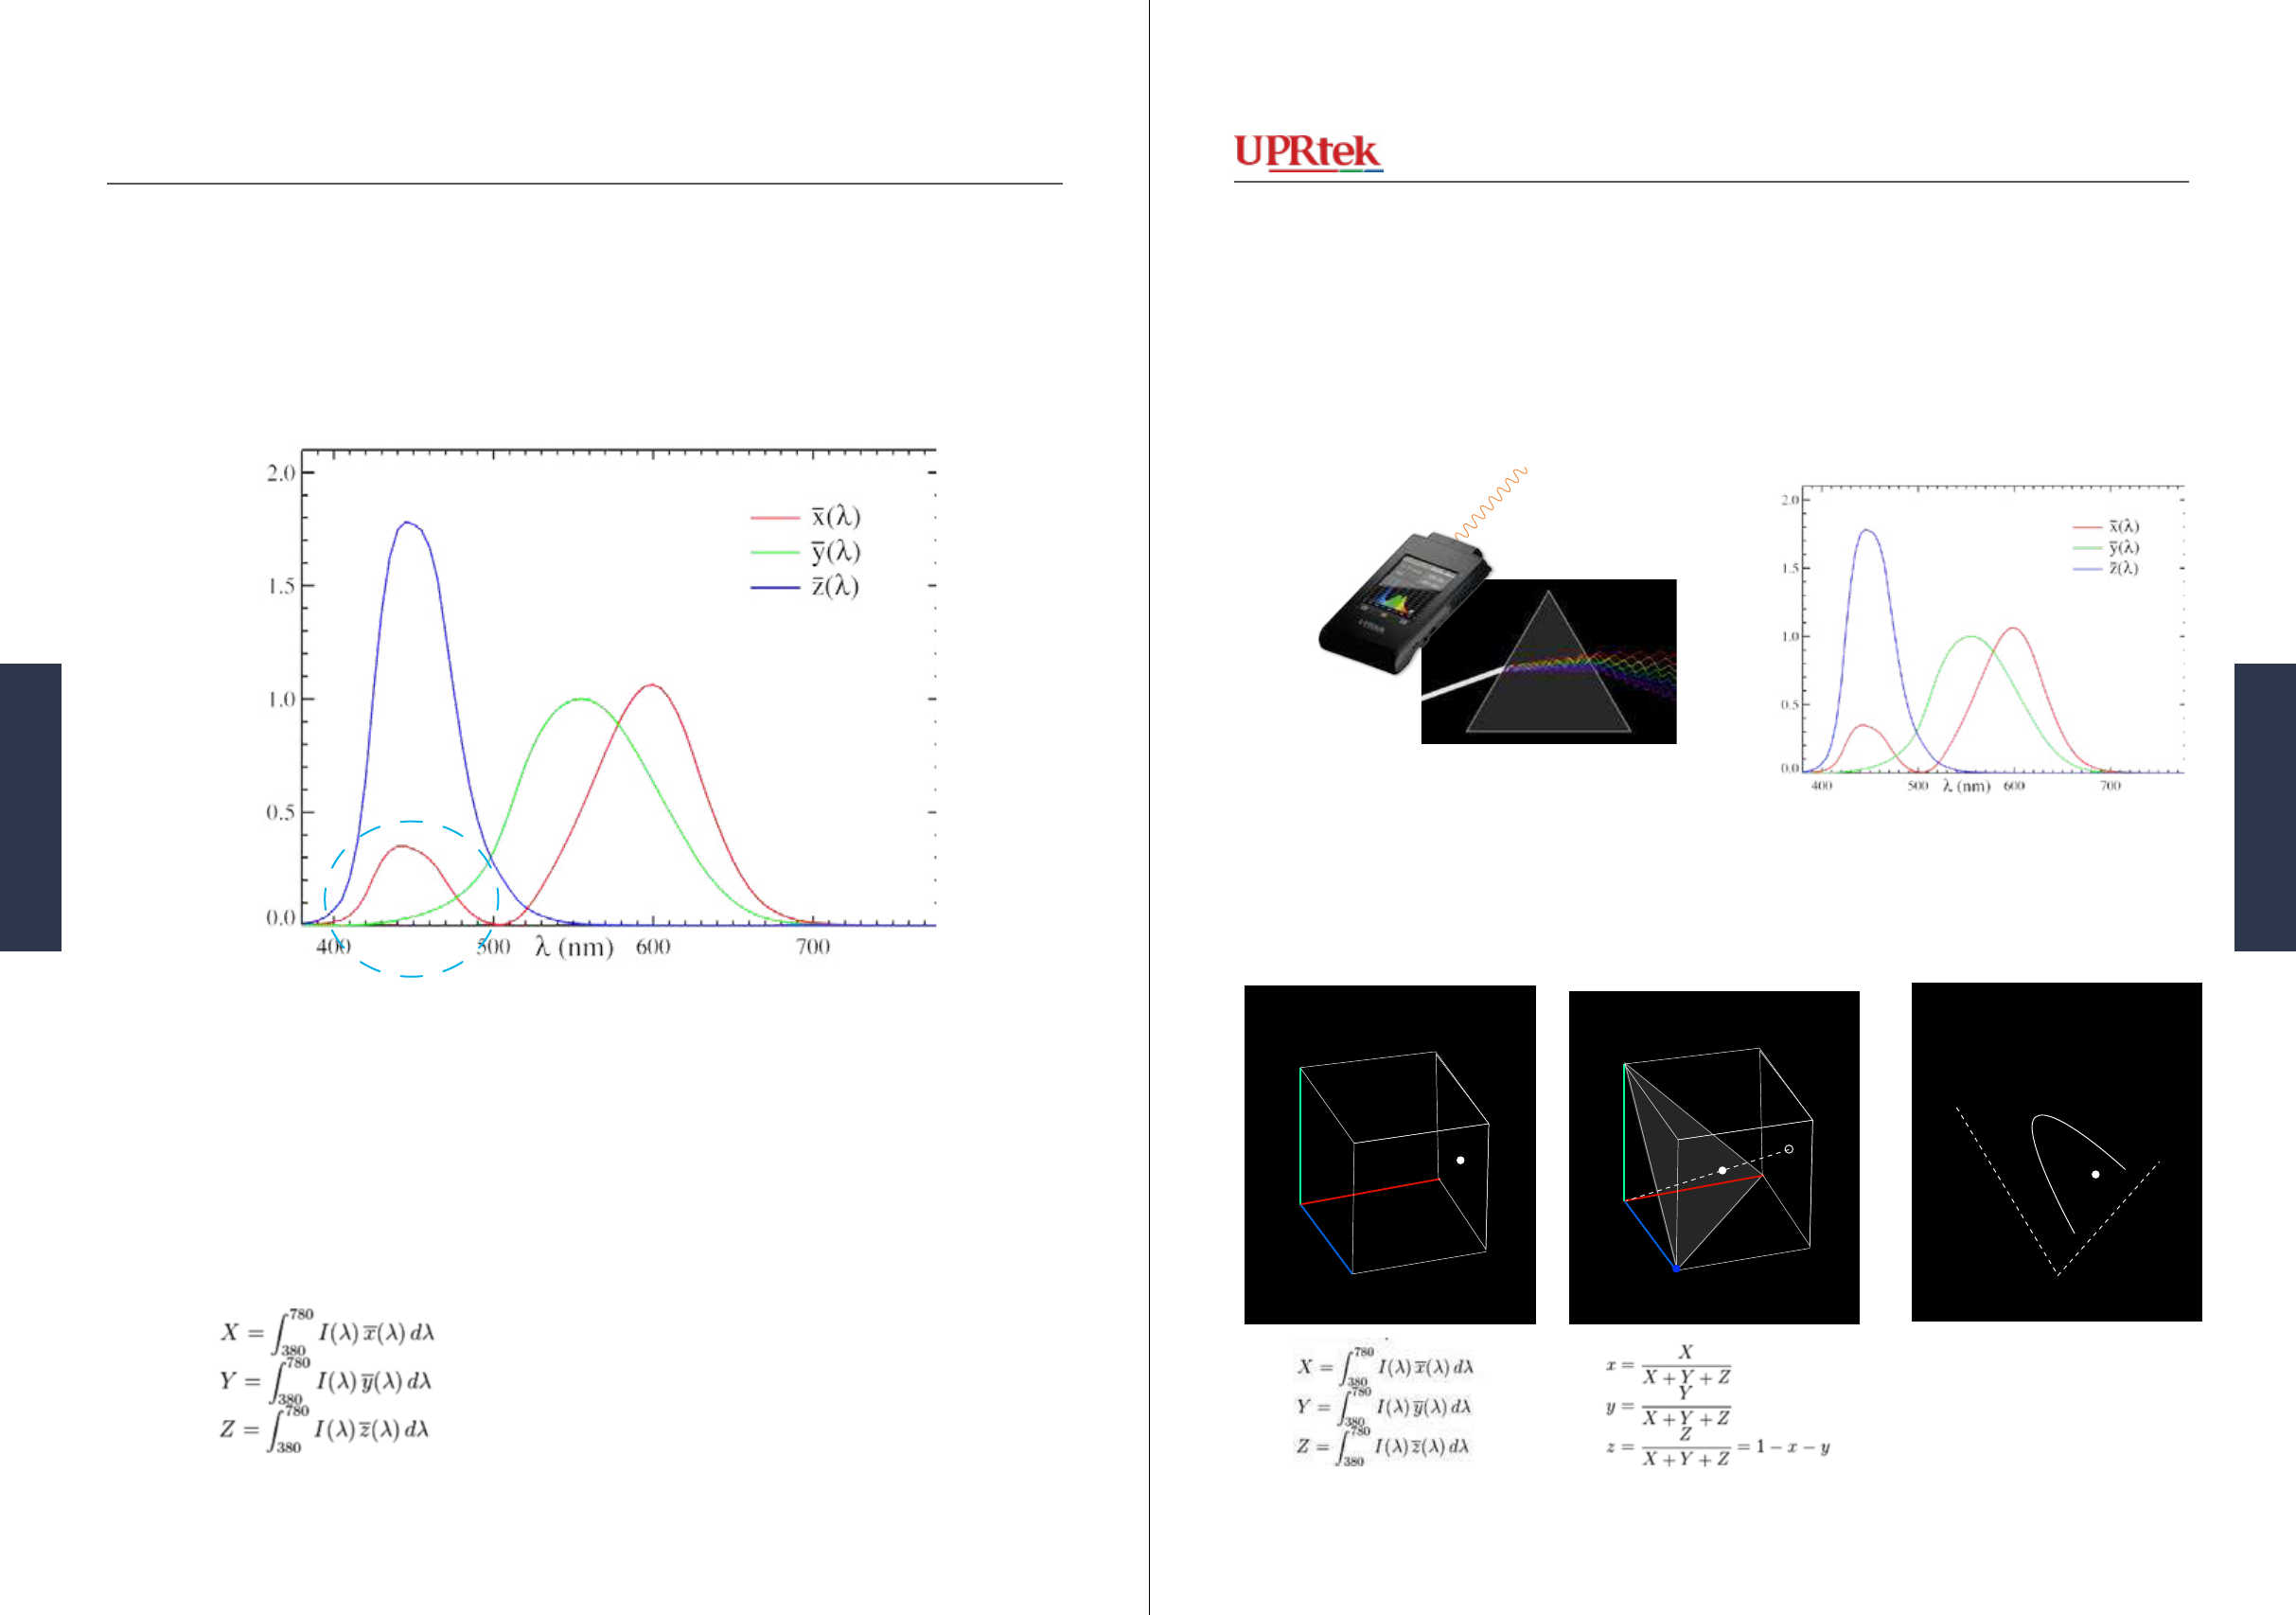
Version 20140410b - Not for distribution - © Copyright 2014 UPRtek All rights reserved
Versio 20140410b - Not for distribution - © Copyright 2014 UPRtek All rights reserved
Mathemacally adjusted for negave Red values
The Color Matching Function chart data is then transformed further into what we call
“X”, “Y” and “Z” values (in capitals) - these values represent still another way in which
humans see color, but they are still, in essence, tristimulus values derived from the
original RGB human experiments. The transformation formula is shown below, using
integral calculus - here we also must introduce I(λ), which is the intensity (or SPD -
Spectral Power Distribution) of each of the wavelengths and λd represents the resolution
or slice of each wavelength taken from the continuum (spectrum). The formula sums all
the wavelength data into a single X, Y and Z data set.
So let’s go through the process again of calculating an x,y coordinate for a light source.
1) MK350 captures light and separates it into multiple wavelength data along with their intensities,
2) sends data through Color Matching Functions, 3) transforms that data into an XYZ point in 3D
space (mathematically), 4) normalizes to Unit Plane (mathematically , and 5) plots it to an x,y 2D
plane
Test Color - 580 nm
100 %
0 %
100 %
R 700 nm
G 546.1 nm
B 435.8 nm
1,1,0
1
1
1
x
y
1
1
1
1,1,0
1, 1, 0
1, 1, 1
1, 0, 1
0, 1, 0
0, 0, 0
0, 1, 0
1, 1, 0
1, 1, 1
1, 0, 1
0, 1, 0
0, 0, 0
0, 1, 0
1, 0, 0
0, 1, 0
0, 0, 0
0, 1, 0
x, y
X
Y
Z
X
Y
Z
X
Y
Z
Use Color Matching and SPD data
to transform to a single point
(represented by X, Y, Z in 3D space
below).
1 2
3 4
5
Mathemacally normalize to
Unit Plane (x+y+z=1). Import-
ant - the proporons of the 3
values have not changed so it
sll represents the same color.
Use the Unit Plane to make a 2D
x,y coordinate system, and plot
the x,y coordinates on the Color
Gamut explained in the earlier
sectons..
Capture light, disperse wavelengths, record SPDs
Send each wavelength data through
Color Matching Funcon
Test Color - 580 nm
100 %
0 %
100 %
R 700 nm
G 546.1 nm
B 435.8 nm
1,1,0
1
1
1
x
y
1
1
1
1,1,0
1, 1, 0
1, 1, 1
1, 0, 1
0, 1, 0
0, 0, 0
0, 1, 0
1, 1, 0
1, 1, 1
1, 0, 1
0, 1, 0
0, 0, 0
0, 1, 0
1, 0, 0
0, 1, 0
0, 0, 0
0, 1, 0
x, y
X
Y
Z
X
Y
Z
X
Y
Z
The smart people at CIE mathematically adjusted these negative values and came up
with a new graph or the Color Matching Functions shown below. Notice that the red
line that was below the axis (negative) now lies on top of it. Keep in mind that these
new functions are still originally based on the RGB experiments.
Note that there sll are some simplica-
ons for the sake of explanaon.
The CIE model capitalizes on this fact by dening Y
as luminance. Z is quasi-equal to blue stimulation,
or the S cone response, and X is a mix (a linear
combination) of cone response curves chosen to be
nonnegative.
www.wikipedia.org - CIE 1931
Arcial Lighng
147146
Arcial Lighng
MK350 Series Survival Handbook

Version 20140410b - Not for distribution - © Copyright 2014 UPRtek All rights reserved
Versio 20140410b - Not for distribution - © Copyright 2014 UPRtek All rights reserved
Luo Meijun, Digital Color Management Science: Color Metrology, Publisher “Blue Ocean Cul-
ture”: Publication date 2011/04/29
Shanmugan S. D. Mutharasu and O. Zeng Yin Nano “Performance of Light Emitting Diode
on Surface Machined Heat Sink“ International Journal of Power Electronics and Drive System
(IJPEDS) Vol.2, No.4, December 2012, pp. 380~388
Kelly, Kevin M.A. B.Sc.(Eng) C.Eng. MCIBSE. MIEI and Kevin O’Connell M.A. B.Sc.(Eng)
C.Eng. MCIBSE. MIEI. Interior Lighting Design - A Student’s Guide
<http://eleceng.dit.ie/
kkelly/Lighting/Interior lighting design Students Guide.pdf>
Morton, J.L. Color Matters “Color & Design - Basic Color Theory” <http://www.colormatters.
com/>.
Blackwell, Craig MD Fellow American Academy of Opthalmology, diplomate American Board
of Opthalmology “Color Vision 4: Cones and the Opponent Process” Jan 2008 < http://www.
youtube.com/watch?v=V73k_0KuUJo>
Blackwell, Craig MD Fellow American Academy of Opthalmology, diplomate American Board
of Opthalmology “Color Vision 2: Color Matching ” Jan 2008 < http://www.youtube.com/
watch?v=82ItpxqPP4I>
HyperPhysics, Dept of Physics and Astronomy, Georgia State University “Light and Vision” <
http://hyperphysics.phy-astr.gsu.edu/hbase/hframe.html>
Wikipedia “CIE 1931 color space” < http://en.wikipedia.org/wiki/CIE_1931>
Wikipedia “CIELUV” < http://en.wikipedia.org/wiki/CIELUV>
USAtoday “Why people still use incandescent bulbs” Dec 2013 <http://www.usatoday.com/sto-
ry/news/nation-now/2013/12/27/incandescent-light-bulbs-phaseout-leds/4217009/>
Design Recycle Inc. Comparison Chart LED Lights vs. Incandescent Light Bulbs vs. CFLs
<http://www.designrecycleinc.com/led comp chart.html>
Luxeon “How does an LED work Oct 17, 2013” <www.youtube.com/watch?v=BH9LI-
973H8w>
Bibliography
Bibliography
Cameron, Brad “Dr. Quantum- Double Slit Experiment” Sep 13, 2006 < http://www.youtube.com/
watch?v=DfPeprQ7oGc>
Khanacademymedicine “Vision: Photo-receptor Distribution in the Fovea” 9/17/2014 < http://www.you-
tube.com/watch?v=UXIfzc1UH-g>
Learning Solutions “How does a spectrophotometer work?” Nov 4, 2011 < http://www.youtube.com/
watch?v=pxC6F7bK8CU>
BenQ “BenQ Eye-care Low Blue Light Monitor Demo Video” Oc 13, 2013 <http://www.youtube.com/
watch?v=B8JrVESRcJk>
British Broadcasting Corporation “BBC Design Rules 3rd Episode: Light” Aug 12, 2011 < http://www.
youtube.com/watch?v=tfK_FF-4aDI>
Bozeman Science “Photosynthesis” April 3rd, 2012 < http://www.youtube.com/watch?v=g78utcLQrJ4>
Formetco “The Making of a Formetco LED” Jan 13, 2012 <http://www.youtube.com/watch?v=SoCfcET-
d72Q>
ChromaAutomation “Chroma LED Bulb In-Line Assembly and Test Solutions” April 5, 2013 < http://
www.youtube.com/watch?v=ltqO3O8MMws>
MicroChemicals “Silicon Wafer Production” June 8, 2012 <www.youtube.com/watch?v=AMgQ1-
HdElM>
Vision Monday “Protecting Eyes Fromk ‘Bad’ Blue Light” Sept. 09, 2013 < http://www.visionmonday.
com/business/labs/article/protecting-eyes-from-bad-blue-light-vm-090913>
Digi-Key Corporation “Characterizing and Minimizing LED Flicker in Lighting Applications” July, 17,
2012 <http://www.digikey.com/us/en/techzone/lighting/resources/articles/characterizing-and-minimiz-
ing-led-icker.html>
Hawk, J. Chris MD, Chair - Annual Meeting of the American Medical Association “The Role of Color
Arcial Lighng
149148
Arcial Lighng
MK350 Series Survival Handbook
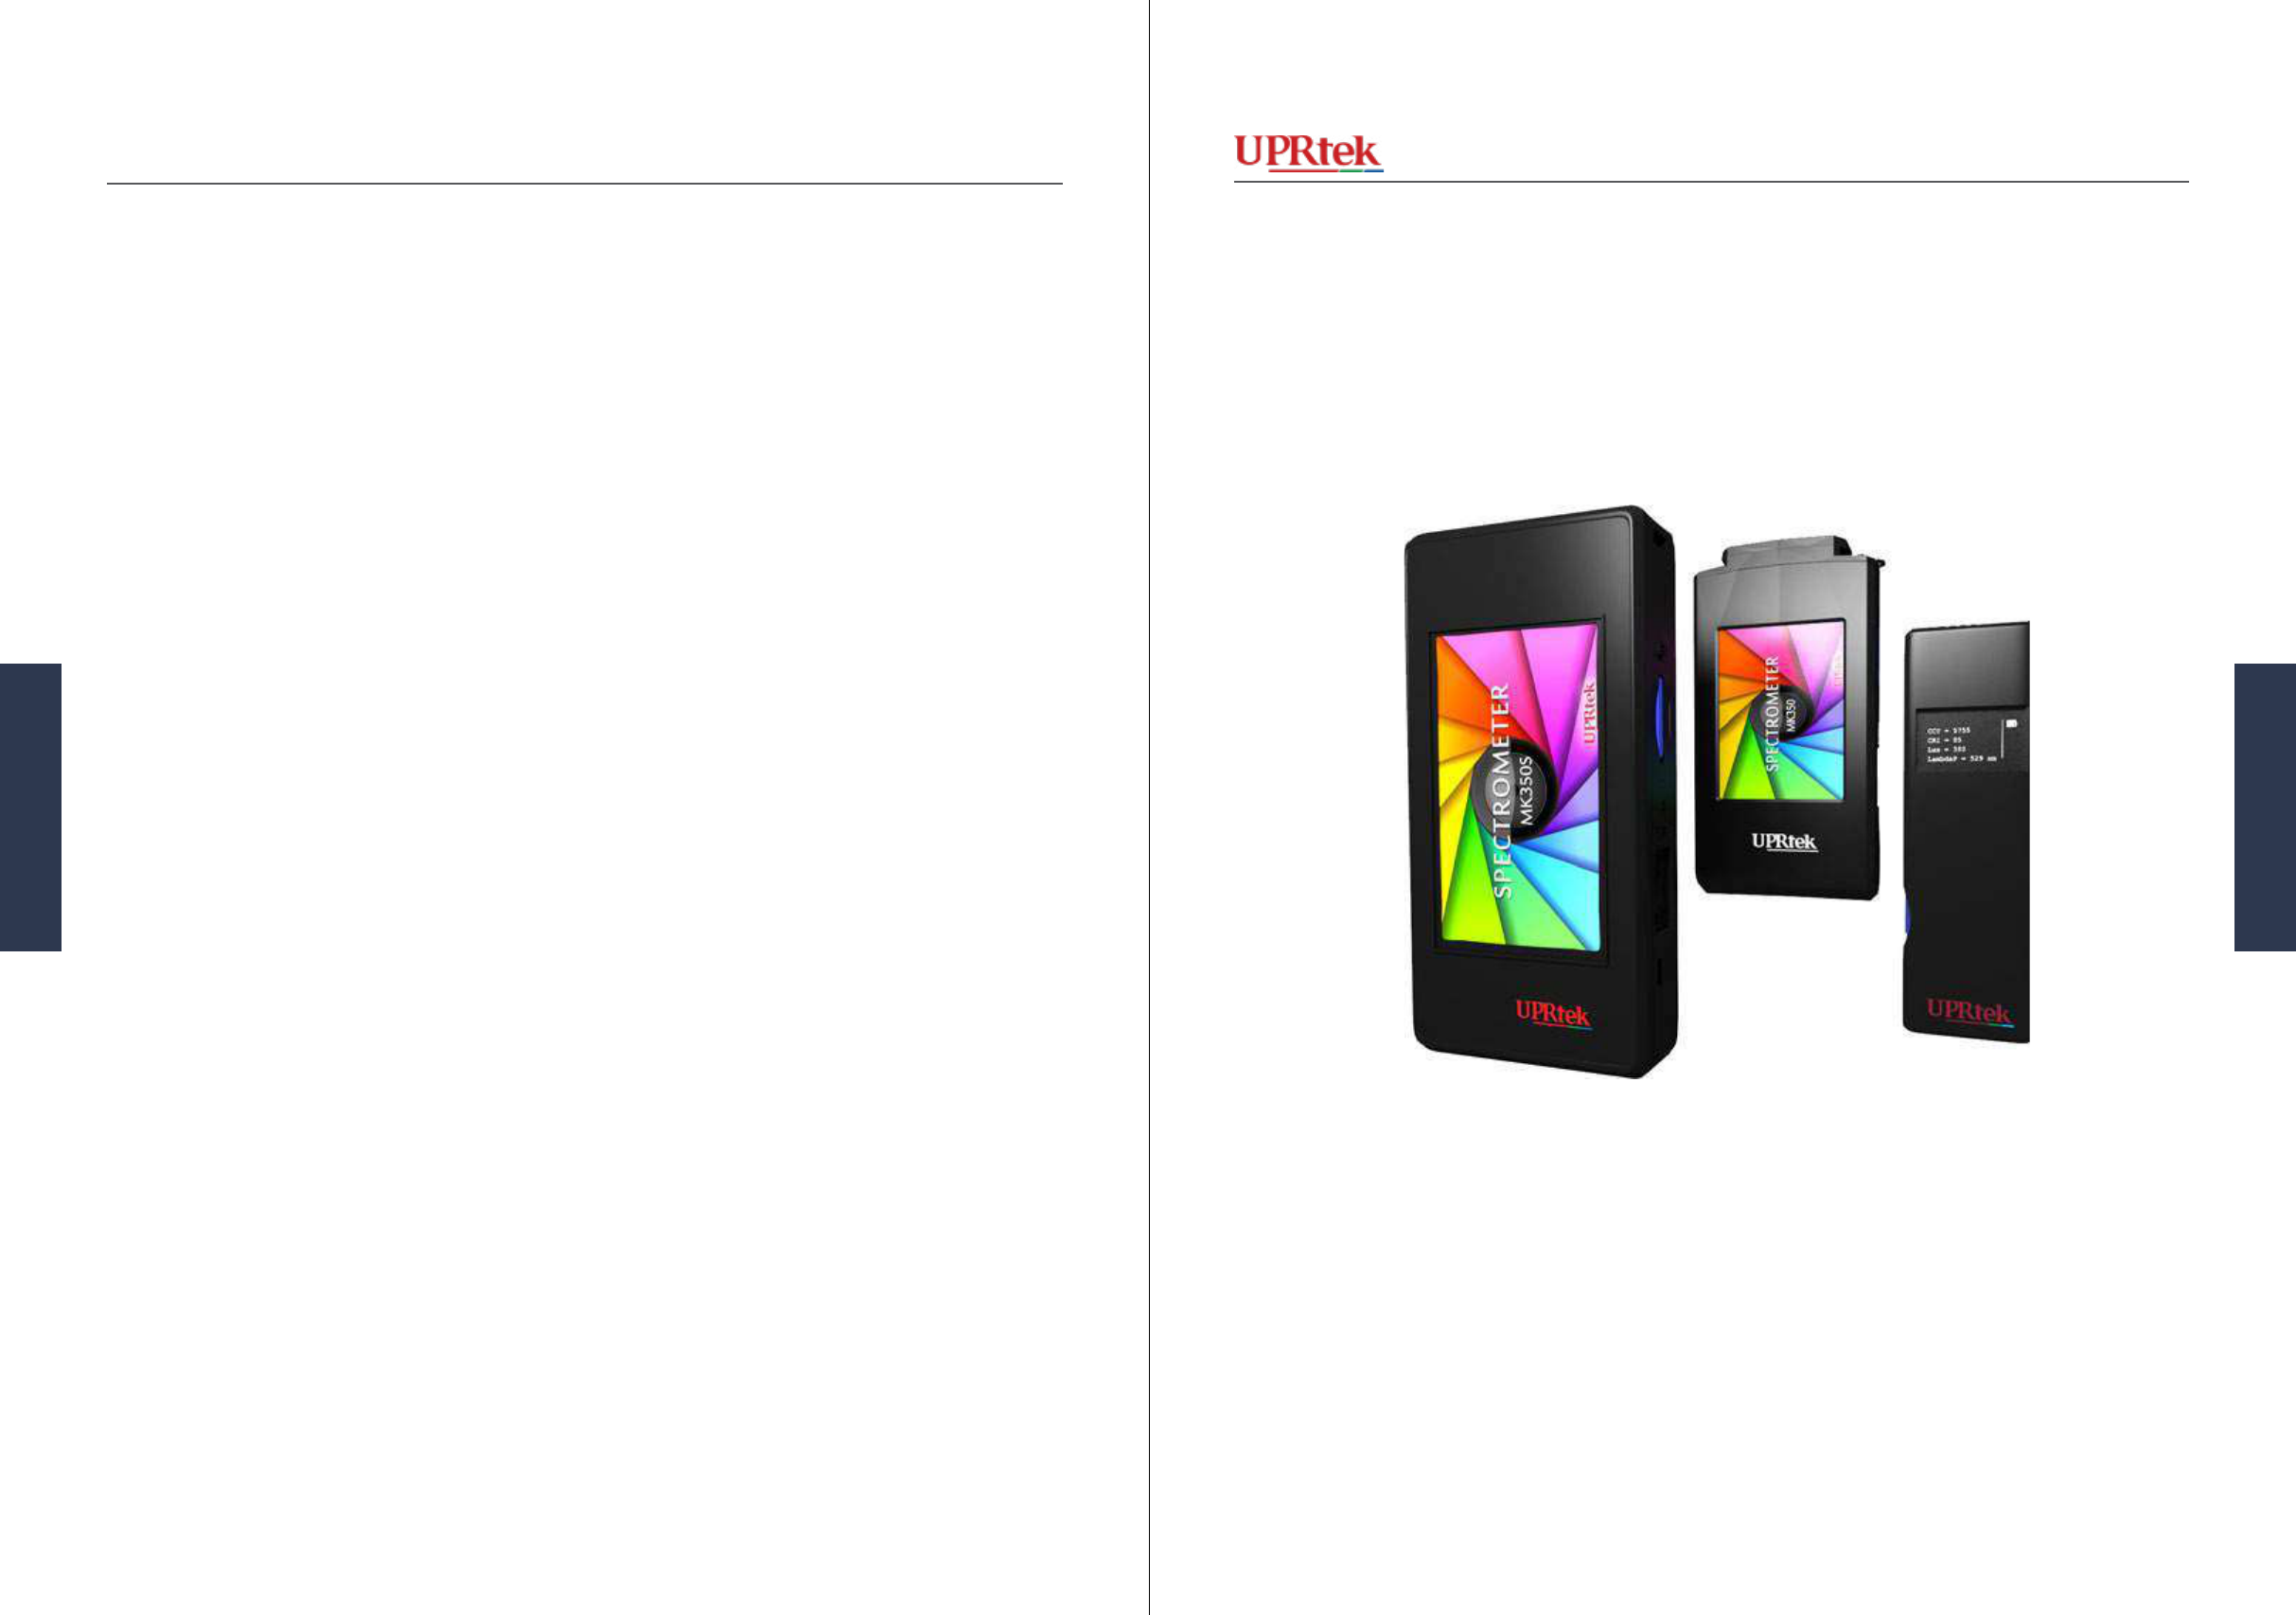
Version 20140410b - Not for distribution - © Copyright 2014 UPRtek All rights reserved
Versio 20140410b - Not for distribution - © Copyright 2014 UPRtek All rights reserved
UC Davis ChemWiki “Photo-receptor Excitation” <http://chemwiki.ucdavis.edu/Biological_Chemis-
try/Photo-receptors/Photoreceptor_Excitation>
PRWeb “LED Lighting Market Shares and Forecasts 2013-2019 in New Research Report at Reportsn-
Reports.com” Oct 09, 2013 <http://www.prweb.com/releases/led-lighting-market-share/and-fore-
casts-2013-2019/prweb11212486.htm>
DFF “Color” <http://displayforum.wikispaces.com/Color>
Schils, Paul Color Space Period <http://www.color-theory-phenomena.nl/08.02.html>
Ampacet “Elements of Color Perception - Metamerism” <http://www.ampacet.com/usersimage/File/
tutorials/newsletter_E_blaster_EB_COLOR.pdf>
US Department of Energy “What You Need to Know about LED Flicker and Dimming” May 9-11,
2012 <http://apps1.eere.energy.gov/buildings/publications/pdfs/ssl/poplawski_dimming_light-
fair2012.pdf>
Harris, William and Craig Fredenrich, PhD (HowStuffWorks) “How Light Works” <http://science.
howstuffworks.com/light7.htm>
Biyee SciTech “Interactive 1931 CIE Chromaticity Diagram” <http://www.biyee.net/color-science/
cie-chromaticity-diagram/>
3Brain High Resolution Technology “Calibration of CMOS circuits” <http://www.3brain.com/index.
php/37/AutomatedCalibration>
Miranda, Deron Deron’s Planet <http://deron.meranda.us/ruminations/purple/>
Arcial Lighng
151150
Arcial Lighng
MK350 Series Survival Handbook